A catalogue of clusters of galaxies identified from all sky surveys of 2MASS, WISE, and SuperCOSMOS
Abstract
We identify 47600 clusters of galaxies from photometric data of Two Micron All Sky Survey (2MASS), Wide-field Infrared Survey Explorer (WISE) and SuperCOSMOS, among which 26,125 clusters are recognized for the first time and mostly in the sky outside the Sloan Digital Sky Survey (SDSS) area. About 90% of massive clusters of in the redshift range of have been detected from such survey data, and the detection rate drops down to 50% for clusters with a mass of . Monte Carlo simulations show that the false detection rate for the whole cluster sample is less than 5%. By cross-matching with ROSAT and XMM–Newton sources, we get 779 new X-ray cluster candidates which have X-ray counterparts within a projected offset of 0.2 Mpc.
keywords:
catalogues — galaxies: clusters: general — large-scale structure of Universe.1 Introduction
Clusters of galaxies are the largest gravitationally bound systems in the Universe. They are located at the knots in the cosmic web. Galaxy clusters can be identified from observational data in optical, X-ray and millimeter bands (e.g. Abell, 1958; Sunyaev & Zeldovich, 1972; Abramopoulos & Ku, 1983). In optical band, galaxy clusters have been identified based on clustering of galaxies on the sky (Abell, 1958; Abell et al., 1989) or clustering in the three-dimensional space (Huchra & Geller, 1982; Yang et al., 2007; Tago et al., 2008; Wen et al., 2009, 2012; Szabo et al., 2011), or even based on galaxy colours (Gladders & Yee, 2000; Goto et al., 2002; Koester et al., 2007; Rykoff et al., 2014). In X-ray images, clusters can be efficiently recognized as diffuse extended sources. A few thousand X-ray clusters have been identified (e.g. Böhringer et al., 2000, 2004; Takey et al., 2011; Böhringer et al., 2013; Finoguenov et al., 2015; Liu et al., 2015; Böhringer et al., 2017), and the largest sample of X-ray clusters in the local universe have been found from the ROentgen SATellite (ROSAT) all sky survey data (e.g. Piffaretti et al., 2011). Sensitive observations of cosmic microwave background (CMB) with Wilkinson Microwave Anisotropy Probe (WMAP) and Planck satellite as well as the ground telescopes show the distortion of CMB spectrum by hot intracluster gas, i.e. Sunyaev-Zel’dovich (SZ) effect. Up to now, 1653 low-redshift clusters were found via the SZ effect from the second Planck data release (Planck Collaboration et al., 2016) and a few hundred of clusters up to a high redshift from the Atacama Cosmology Telescope (ACT) and South Pole Telescope (SPT) surveys (Marriage et al., 2011; Hasselfield et al., 2013; Bleem et al., 2015b).
Recent years, the Sloan Digital Sky Survey (SDSS, York et al., 2000) provides a great data base for identification of galaxy clusters. Galaxy clusters or groups have been identified from the SDSS spectroscopic data (e.g., Merchán & Zandivarez, 2005; Berlind et al., 2006; Tago et al., 2010; Tempel et al., 2014) or the five-band photometric data (e.g., Goto et al., 2002; Koester et al., 2007; Wen et al., 2009; Hao et al., 2010; Szabo et al., 2011; Rykoff et al., 2014, 2016; Banerjee et al., 2018). Currently, the largest catalogue contains 158103 clusters detected in the sky area of 14,000 deg2 (Wen et al., 2012; Wen & Han, 2015). Outside of the SDSS sky region, however, only a few thousand clusters are known (e.g. Abell, 1958; Abell et al., 1989; Dalton et al., 1997; Böhringer et al., 2000; Böhringer et al., 2013) and most of them have a low redshift.
All sky survey data of the Two Micron All Sky Survey (2MASS, Skrutskie et al., 2006), Wide-field Infrared Survey Explorer (WISE, Wright et al., 2010) and SuperCOSMOS (Hambly et al., 2001) provide a good opportunity to identify more galaxy clusters in the sky area outside the SDSS. In this paper, we identify 47,600 galaxy clusters by using photometric redshifts of galaxies from the all sky data of 2MASS, WISE and SuperCOSMOS. In Section 2, we briefly describe these survey data. In Section 3, we describe the identification procedures for galaxy clusters. In Section 4, we discuss the properties of this sample of galaxy clusters, including the completeness, false detection rate and richness estimates. The identified clusters are cross-matched with the X-ray sources in the ROSAT and XMM–Newton surveys to find new X-ray cluster candidates. A short summary is presented in Section 5.
Throughout this paper, we assume a flat cold dark matter cosmology taking km s-1 Mpc-1, and .
2 Galaxy data for cluster identification
Three data sets of all sky surveys are used for cluster identification. The 2MASS111http://www.ipac.caltech.edu/2mass/ is an all-sky survey in three near-infrared bands (Skrutskie et al., 2006): (1.25 m), (1.65 m) and (2.17 m) with the 10 magnitude limits of 15.8, 15.1, and 14.3 mag for point sources, respectively. More than 100 million sources are detected, and the Extended Source Catalogue (XSC) contains about one million galaxies up to a limit of mag (Jarrett et al., 2000). The WISE222http://irsa.ipac.caltech.edu/Missions/wise.html observes the whole sky in four mid-infrared bands (Wright et al., 2010): (3.4 m), (4.6 m), (12 m) and (22 m) with 5 magnitude limits of 17.1, 15.7, 11.5, and 7.7 mag in the Vega system for point sources, respectively. The SuperCOSMOS333http://www-wfau.roe.ac.uk/sss/ data are measured from the photographic plates of the Palomar Observatory Sky Survey-II (POSS-II) in the north and the United Kingdom Schmidt Telescope (UKST) in the south, which include optical photometric magnitudes in three bands (, and ) with limits of mag and mag (Peacock et al., 2016). Obviously, the WISE survey in the and goes much deeper than the 2MASS but is comparable with the SDSS for galaxies (Yan et al., 2013).
By combining the data of 2MASS, WISE and SuperCOSMOS, Bilicki et al. (2014) estimated photometric redshifts for about one million 2MASS XSC galaxies (2MPZ444http://surveys.roe.ac.uk/ssa/TWOMPZ) by using the artificial neural network (ANNz) approach, which have an uncertainty of and a median redshift of . Bilicki et al. (2016) further estimated the photometric redshifts of about 20 million galaxies555http://ssa.roe.ac.uk/WISESCOS covering 28,000 square degree of the sky in the WISE and SuperCOSMOS surveys by using the ANNz approach again. They removed stars and quasars by the colour cuts of and , and found that the so-obtained ‘galaxies’ with , and at high Galactic latitudes is approximately 95% pure (i.e. mixed with stars up to 5% of the total number of listed ‘galaxies’) and 90% complete (i.e. about 10% of real galaxies may be missing due to the colour cuts). The photometric redshifts of the galaxies have a median of of 0.2 and an uncertainty of .
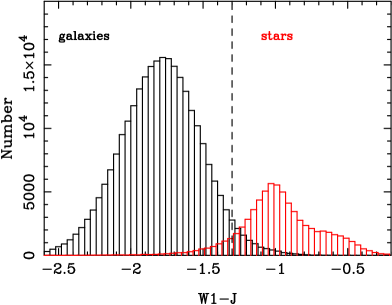
The main data set for identification of galaxy clusters is the sample of 20 million WISESuperCOSMOS galaxies (see Section 3) which have photometric redshifts estimated by Bilicki et al. (2016). To make the galaxy sample as complete as possible at the bright end, 0.8 million bright 2MPZ galaxies of in the same 28,000 square degree sky coverage (Bilicki et al., 2014) are further supplementally included. For common galaxies appearing in both catalogues, the redshifts from 2MPZ catalogue are adopted. We also notice that the ‘galaxies’ in the catalogue of Bilicki et al. (2016) are still contaminated with some bright stars, which can be distinguished by using the colour of (Xu et al., 2014; Kovács & Szapudi, 2015). As shown in Fig. 1, stars and galaxies are distributed with two peaks, which can be roughly separated by a criterion of . Here the recognized stars and galaxies are taken from the SDSS data with a limit of (Lupton et al., 2001). This colour cut would cause 1.4% of total galaxies omitted, but the contaminating stars can be reduced to 3% at the Galactic latitudes of and 6.5% at the Galactic latitudes of . With this process, about 1.9 million sources are removed from the WISESuperCOSMOS catalogue of Bilicki et al. (2016). Finally, 18.4 million galaxies from 2MASS, WISE and SuperCOSMOS are used for identification of galaxy clusters in the following.
3 Galaxy clusters identified from SuperCOSMOS, WISE and 2MASS
Photometric redshift can be used to discriminate member galaxies of clusters and field galaxies during identification of galaxy clusters (e.g. Wen et al., 2006, 2009; Szabo et al., 2011; Wen et al., 2012). A galaxy cluster usually contains one or more giant luminous member galaxies, and one of them is the brightest cluster galaxy (BCG). We first select a sample of BCG candidates, and then identify clusters as being overdensity regions of galaxies around them.
3.1 Find out BCG candidates
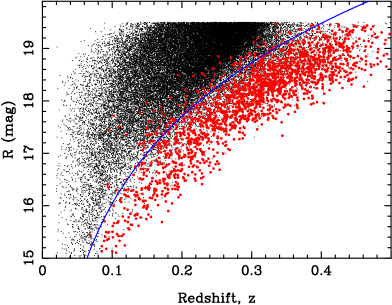
We take the following steps to select red luminous galaxies as being BCG candidates. First of all, BCG candidates must be bright enough to be detected in the 2MASS band and the WISE band, so that the contamination of stars can be minimized by the colour cut of . Secondly, they must be bright in the band of SuperCOSMOS. In general, BCGs have a narrow distribution of absolute magnitude or colour (Sandage, 1972; Postman & Lauer, 1995). The plot for -band magnitude against redshift for galaxies and BCGs of known SDSS clusters (from Wen & Han, 2015) clearly shows in the upper panel of Fig. 2 that about 95% of BCGs have an evolution-corrected absolute magnitude of
| (1) |
or the apparent magnitude of
| (2) |
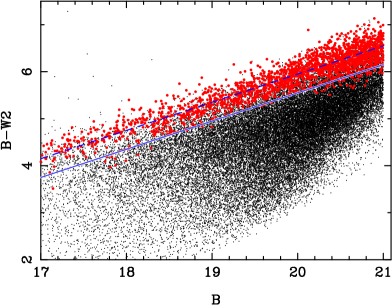
Here is luminosity distance of a galaxy, and and are the terms for evolution-correction and -correction which can be given as at according to the stellar population synthesis model of Bruzual & Charlot (2003). Thirdly, the very red colour of BCGs can be quantified in the colour–magnitude diagram of versus by using the data of SuperCOSMOS and WISE. As shown in the lower panel of Fig. 2, about 95% of the BCGs have the colour cut of
| (3) |
With the criteria of equations (2) and (3), we obtain 0.76 million galaxies as BCG candidates. Their spectroscopic redshifts are taken from the 2MPZ catalogue (Bilicki et al., 2014) if available, otherwise photometric redshifts are used.
3.2 Find out galaxy clusters
Galaxy clusters stand out as the overdensity of galaxies around the BCG candidates. Referring our previous papers (Wen et al., 2009; Wen & Han, 2011), we identify galaxy clusters with the following steps:
1. Get the number count of galaxies around each of the BCG candidates we have selected above. Since the spectroscopic or photometric redshift, , of a BCG candidate is known, we can get the count of galaxies, , within a projected radius of 0.5 Mpc from the BCG candidate in the redshift slice of . Here the radius of 0.5 Mpc is about 2 times of the core size of a rich cluster (Girardi et al., 1995; Adami et al., 1998), and the thickness of redshift slice is 1.5 times of the scatter of the uncertainty of estimated galaxy photometric redshift (Bilicki et al., 2016), so that about 85% of member galaxies of a possible cluster should be included.
2. Estimate the local ‘background’ and ‘fluctuation’ of the number count of galaxies. For each cluster candidate, the average of the local background, , should be subtracted. Here is estimated locally within the same redshift slice of but in an annulus of projected distance between 2–4 Mpc from the BCG candidate. The fluctuation of the number count, , is also estimated as being the deviation of the number count of galaxies at 1000 random positions in the redshift slice.
3. Calculate the ‘signal-to-noise ratio’ to find an overdensity region. The signal-to-noise ratio is defined as being . A larger signal-to-noise ratio means a higher overdensity of galaxies, which is the direct indication of a true cluster. To keep a low false detection rate (5%, see discussions in Section 4.1), we set the threshold as being .
4. Clean the overdensity entries to make a list of galaxy clusters. It is possible that two or more luminous member galaxies in a rich cluster can be recognized as the BCG candidates, so that one cluster can be sort out twice or more times through the above procedures. We therefore perform the friends-of-friends algorithm (Huchra & Geller, 1982) to merge them into one cluster if they have a redshift difference smaller than and a projected distance smaller than 1 Mpc (a typical radius of a cluster). The BCG with the highest is then adopted for such a combined cluster.
| Name | RA | Declination | flagz | Other catalogues | ||||
|---|---|---|---|---|---|---|---|---|
| (1) | (2) | (3) | (4) | (5) | (6) | (7) | (8) | (9) |
| J000000.6321233 | 0.00236 | 0.0913 | 0 | 15.21 | 7.75 | 53.94 | Abell,WHL | |
| J000002.3051718 | 0.00946 | 0.1747 | 0 | 16.45 | 6.08 | 39.37 | WHL | |
| J000003.6314708 | 0.01490 | 0.0933 | 0 | 15.52 | 7.71 | 24.27 | WHL | |
| J000006.6315235 | 0.02761 | 0.2125 | 0 | 17.15 | 4.77 | 32.33 | WHL | |
| J000006.7212400 | 0.02792 | 0.1686 | 0 | 16.07 | 5.36 | 35.79 | Abell | |
| J000007.6155003 | 0.03179 | 0.1528 | 1 | 16.13 | 11.29 | 39.51 | Abell,WHL | |
| J000008.0343316 | 0.03353 | 0.2863 | 0 | 18.04 | 4.76 | 30.28 | WHL | |
| J000009.4211655 | 0.03903 | 0.3026 | 0 | 17.92 | 8.67 | 35.42 | WHL | |
| J000012.6103806 | 0.05232 | 0.1794 | 0 | 16.73 | 6.56 | 51.38 | WHL | |
| J000014.0063329 | 0.05825 | 0.2197 | 0 | 17.59 | 4.51 | 26.45 | WHL |
Note. Column 1: Cluster name with J2000 coordinates of cluster. Column 2: RA (J2000) of cluster BCG (degree). Column 3: Declination (J2000) of cluster BCG (degree). Column 4: cluster redshift, with a flag in Column (5): ‘0’ for photometric redshift and ‘1’ for spectroscopic redshift. Column 6: -band magnitude of BCG. Column 7: of the overdensity for cluster recognition. Column 8: cluster richness. Column 9: other catalogues containing the cluster: Abell (Abell, 1958; Abell et al., 1989), Zwicky (Zwicky et al., 1961), BM78 (Braid & MacGillivray, 1978), GHO (Gunn et al., 1986), EDCC (Lumsden et al., 1992), APM (Dalton et al., 1997), CE (Goto et al., 2002), NSCS (Lopes et al., 2004), C4 (Miller et al., 2005), TES+06 (Tago et al., 2006), maxBCG (Koester et al., 2007), YMV+07 (Yang et al., 2007), NSC (Gal et al., 2009), GMBCG (Hao et al., 2010), AMF (Szabo et al., 2011; Banerjee et al., 2018), MCXC (Piffaretti et al., 2011), GMB+11, (Geach et al., 2011), WH11 (Wen & Han, 2011), WHL (Wen et al., 2012; Wen & Han, 2015), MSPM (Smith et al., 2012), TTL12 (Tempel et al., 2012), RXSC (Chon et al., 2013), redMaPPer (Rykoff et al., 2014, 2016), CAMIRA (Oguri, 2014), SPT (Bleem et al., 2015b), SWXCS (Liu et al., 2015), DAB+15, (Durret et al., 2015), LCS (Bleem et al., 2015a), PSZ2 (Planck Collaboration et al., 2016), TKT16 (Tempel et al., 2016), XLSSC (Pacaud et al., 2016), and KDR2 (Radovich et al., 2017).
(This table is available in its entirety in a machine-readable form.)
| Name | RA | Declination | flagz | ||||
|---|---|---|---|---|---|---|---|
| (1) | (2) | (3) | (4) | (5) | (6) | (7) | (8) |
| WHY J000001.3561854 | 0.00538 | 0.3212 | 0 | 18.43 | 6.85 | 15.74 | |
| WHY J000004.3483442 | 0.01780 | 0.3555 | 0 | 18.08 | 9.17 | 36.05 | |
| WHY J000006.1075319 | 0.02528 | 0.1153 | 0 | 16.21 | 4.80 | 12.27 | |
| WHY J000007.6420725 | 0.03181 | 0.1891 | 0 | 17.32 | 4.26 | 23.34 | |
| WHY J000008.6150422 | 0.03564 | 0.2571 | 0 | 18.04 | 4.79 | 21.69 | |
| WHY J000010.0140805 | 0.04183 | 0.2574 | 0 | 17.59 | 4.11 | 31.40 | |
| WHY J000010.4305008 | 0.04338 | 0.1707 | 0 | 16.62 | 4.18 | 10.52 | |
| WHY J000012.8120153 | 0.05353 | 0.2406 | 1 | 16.74 | 5.91 | 26.41 | |
| WHY J000017.6290246 | 0.07347 | 0.2564 | 0 | 17.88 | 5.87 | 18.93 | |
| WHY J000018.2392145 | 0.07589 | 0.1248 | 0 | 16.04 | 4.42 | 14.02 |
Note. Column 1: Cluster name with J2000 coordinates of cluster. Column 2: RA (J2000) of cluster BCG (degree). Column 3: Declination (J2000) of cluster BCG (degree). Column 4: cluster redshift, with a flag in Column (5): ‘0’ for photometric redshift and ‘1’ for spectroscopic redshift. Column 6: -band magnitude of BCG. Column 7: of the overdensity for cluster recognition. Column 8: cluster richness.
(This table is available in its entirety in a machine-readable form.)
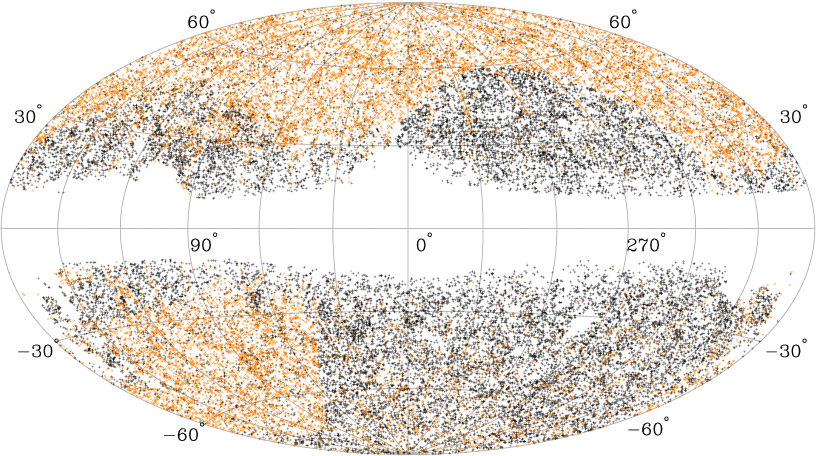
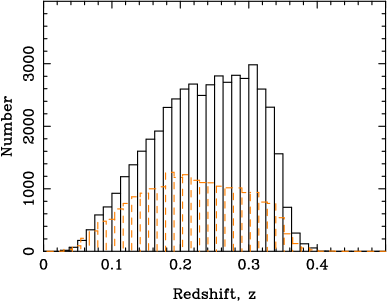
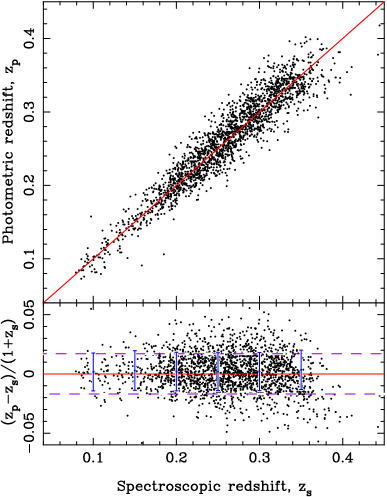
We finally identify 47,600 clusters through the above procedures. Table 1 lists 21,475 previously known clusters (see Section 4.2) and Table 2 lists 26,125 newly identified clusters with a prefix of WHY to indicate their nature of new discovery in this paper. The sky distribution of these galaxy clusters is shown in Fig. 3, which follows the distribution of WISESuperCOSMOS galaxies given by Bilicki et al. (2016). The redshifts of galaxy clusters are mostly within as shown in Fig. 4. By comparing them with the SDSS spectroscopic data (Alam et al., 2015) available for the BCGs of 6030 clusters we identified (see Fig. 5), we find that the accuracy of cluster photometric redshifts is about .


4 Discussions
4.1 Detection rate
Massive clusters with many bright member galaxies can easily be detected through the above cluster identification procedures. To show the dependence of cluster detection rate on redshift and cluster mass, we collect a sample of 1613 massive clusters within the sky area in Fig. 3, which have previously been detected from the ROSAT X-ray survey (Vikhlinin et al., 2009; Mantz et al., 2010; Piffaretti et al., 2011), the XMM–Newton survey (Takey et al., 2011) and the Planck SZ survey (Planck Collaboration et al., 2016). These X-ray and SZ samples are complete either on X-ray flux density or the SZ CMB detection threshold, so that they are independent of optical/infrared cluster identifications. The fraction of these X-ray and SZ clusters detected in our cluster list can be regarded as an indicator for completeness of the identified clusters, as shown by Hao et al. (2010), Rozo & Rykoff (2014) and Oguri (2014), because there is no significant difference on galaxy distributions in the X-ray detected and non-detected clusters (Popesso et al., 2007).
Among the 1613 clusters, we get 1235 (77%) matches within a redshift difference of and a separation of , here is the previously known radius of massive clusters in literature within which the mean density of a cluster is 500 times of the critical density of the universe. Fig. 6 shows the detection rate of these X-ray and SZ clusters as a function of redshift and cluster mass , i.e. the cluster mass within rescaled to those of Vikhlinin et al. (2009) as done by Wen & Han (2015). In the redshift range of , about 90% massive clusters of can be detected, and the detection rate drops quickly down to 50% for clusters with a mass of . Therefore, clusters with a lower mass obviously have a much lower detection rate.
In the above cluster identification procedure, the inherent assumption is that clusters are centred on the potential BCGs. It is possible that the BCGs are not located at cluster centres (Skibba et al., 2011; Hoshino et al., 2015; Oguri et al., 2017). The miscentring can induce the number of discriminated member galaxies and hence the ‘’ underestimated. Rich clusters may have enough member galaxies around the BCGs and still can be identified above the threshold of . Nevertheless, poor clusters may not. To investigate the effect of miscentring on completeness, we carry out a simulation to shift the locations of the BCGs by a projected length of 0.2 Mpc (see Section 4.4) in a random direction and then try to search galaxy clusters with the above procedure with the same threshold. We find that about 22% (10,423 of 47600) of clusters cannot be identified due to a low of .

On the other hand, the projection effect of large scale structure may induce possible false detections of clusters. We estimate the false detection rate by Monte Carlo simulations following many previous authors (e.g., Goto et al., 2002; Koester et al., 2007; Hao et al., 2010; Wen et al., 2012). First, we discard all recognized member galaxy candidates of 47,600 identified clusters from the catalogue of 18.4 million galaxies. Then, ten mock samples of rest galaxies are generated by randomly shuffling the photometric redshifts and magnitudes of all galaxies, so that the two-dimensional distribution of galaxies are kept as the same as the real sample, but the detected clusters have been eliminated. By using these mock samples, we search galaxy clusters with the steps discussed Section 3.2 with the same threshold of . Any detected ‘clusters’ from such mock samples therefore can be regarded as false detections due to projection effect. For each mock sample, a false detection rate is calculated as being the ratio between the number of false detected clusters from the mock data and the number of detected clusters in the real data. To minimize the random noise, we get an average from ten mock samples. The false detection rate is 4.5% for the whole cluster sample, but varies with the ‘’. It increases from nearly 0 at to about 7.5% in the bin of to (see Fig. 7).
4.2 Clusters in previous cluster catalogues
We cross-match the identified galaxy clusters with clusters in previous cluster catalogues to find out how many clusters have been previously known. We work in two regions, the sky region of SDSS coverage and the sky region outside the SDSS.
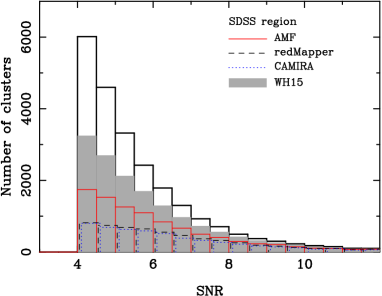
In the sky region of SDSS coverage, we have got 23,366 clusters identified from the 2MASS, WISE and SuperCOSMOS survey data, but a large number of galaxy clusters there have been identified previously from the SDSS photometric data, for example, 13,823 clusters in the maxBCG catalogue (Koester et al., 2007), 39,668 clusters in the WHL09 catalogue (Wen et al., 2009), 55,424 clusters in the GMBCG catalogue (Hao et al., 2010), 69,173 clusters in the AMF catalogue (Szabo et al., 2011) and 46,479 clusters in the updated AMF catalogue (Banerjee et al., 2018), 25,325 clusters in the redMaPPer catalogue (Rykoff et al., 2014) and 26,311 clusters in the updated redMaPPer catalogue (Rykoff et al., 2016), and 71,743 clusters in the CAMIRA catalogue (Oguri, 2014). Cross-matching with the largest catalogue containing 158,103 clusters (WHL, Wen et al., 2012; Wen & Han, 2015) shows that 66% of 23,366 clusters can be matched with the WHL clusters within a redshift difference and a projected separation 1 Mpc (see Fig. 8). By adding not-overlapped clusters in other catalogues such as the GMBCG, AMF, redMaPPer and CAMIRA, we find that in total 18,138 galaxy clusters (78% of 23,366) are previously known, which means that only 5228 clusters () in the SDSS region are newly identified.
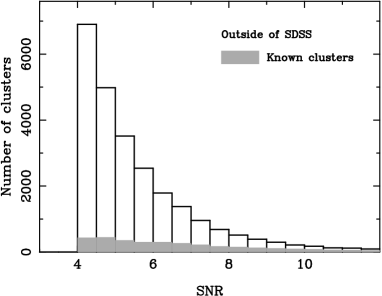
Outside the SDSS region, we have 24,234 galaxy clusters identified from the 2MASS, WISE and SuperCOSMOS survey data. Previously only a small number of galaxy clusters have been identified from either a shallow optical (e.g., Abell et al., 1989) or infrared surveys (Kochanek et al., 2003; Blackburne & Kochanek, 2012), or the full sky X-ray survey (e.g., Piffaretti et al., 2011), or the CMB SZ effect data (Planck Collaboration et al., 2016). After taking out 3337 known clusters in this sky region from previous catalogues (Zwicky et al., 1961; Braid & MacGillivray, 1978; Abell et al., 1989; Lumsden et al., 1992; Dalton et al., 1997; Tago et al., 2006; Piffaretti et al., 2011; Chon et al., 2013; Liu et al., 2015; Bleem et al., 2015b; Bleem et al., 2015a; Tempel et al., 2016; Planck Collaboration et al., 2016; Pacaud et al., 2016), we conclude that 20,897 clusters are recognized for the first time (see Fig. 8).
Therefore, in addition to the 21,475 known clusters, we get in total 26,125 galaxy clusters newly identified from the 2MASS, WISE and SuperCOSMOS survey data (see Fig. 3).
4.3 Richness estimation
Richness is one of basic properties of galaxy clusters, which describes how many member galaxies or how much mass a cluster possesses. Richness is therefore often taken as a mass proxy. For optically identified clusters, richness can be simply defined as the total number of member galaxies brighter than a luminosity threshold or magnitude limit (Koester et al., 2007; Hao et al., 2010; Rykoff et al., 2014) or even the total luminosity of recognized member galaxies (Szabo et al., 2011; Wen et al., 2012; Wen & Han, 2015).
Identified from the flux-limited galaxy sample of WISE and SuperCOSMOS, galaxy clusters at lower redshifts should contain more member galaxies than those at higher redshifts. Therefore, the total numbers of member galaxies or their total luminosities are obviously biased to smaller values at high redshift, so that they cannot directly be taken as a true cluster richness. Here we try to make corrections to the total luminosities according to previously calibrated richness of identified clusters (Xu et al., 2014).
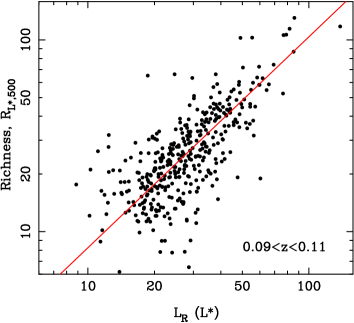
For each cluster, we first calculate the total -band luminosities, , of member galaxies within 1 Mpc and a photometric redshift slice of with a proper background subtraction (Wen et al., 2012). The -band data of galaxies are taken from the SuperCOSMOS survey. We then define the cluster richness, in unit of galaxy characteristic luminosity , as being
| (4) |
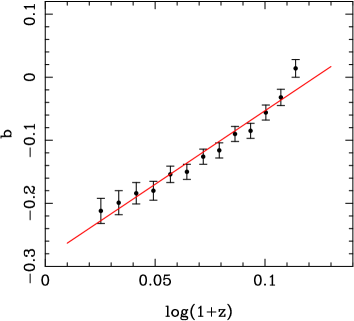
where and are the power indices for luminosities and the corrections of redshift dependence, respectively. To derive the values of and , we get a sample of matched clusters in Table 1 with those in Wen & Han (2015) within a projected separation of 0.5 Mpc and a redshift difference of 0.05. Noticed that the richness given in Wen & Han (2015) has been calibrated with known cluster masses estimated by X-ray or SZ measurements and has no dependence on redshift. For the matched clusters in each of many small redshift ranges, the correlation (such as one in the upper panel of Fig. 9) can be best fitted by a power law
| (5) |
with a slope of and an intersection of that is redshift-dependent: (see the lower panel of Fig. 9). The richness is therefore related to by
| (6) |
Therefore, we simply define the richness of identified clusters in this paper as
| (7) |
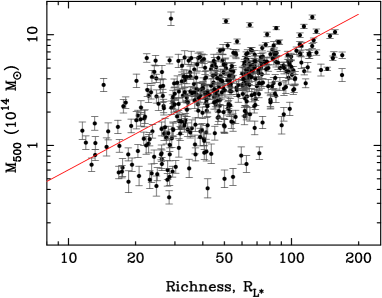
The richness values for all clusters are calculated and listed in Column (8) in Table 1 and Table 2, which are reasonably correlated with cluster masses from X-ray and SZ measurements compiled in Wen & Han (2015), as shown in Fig. 10. Adopting a slope of 1.08 for the richness–mass relation (Wen & Han, 2015), we find that the deviation of logarithmic mass from the best fitting is about 0.25, which is comparable to those for the maxBCG (Koester et al., 2007), GMBCG (Hao et al., 2010) and AMF richnesses (Szabo et al., 2011).
| Cluster name | RA | Declination | Name of X-ray source | Other catalogues | ||||
|---|---|---|---|---|---|---|---|---|
| (1) | (2) | (3) | (4) | (5) | (6) | (7) | (8) | (9) |
| WHY J000108.9123309 | 0.28721 | 0.2451 | 2RXS J000109.9123240 | 0.410 | 0.150 | 0.123 | ||
| J000141.4154045 | 0.42262 | 0.1308 | 2RXS J000140.1154041 | 0.840 | 0.200 | 0.044 | MCXC | |
| J000158.5120358 | 0.49367 | 0.1930 | 2RXS J000155.7120354 | 0.950 | 0.180 | 0.128 | MCXC | |
| J000311.6060531 | 0.79843 | 0.2332 | 2RXS J000311.1060442 | 1.700 | 0.260 | 0.180 | MCXC | |
| J000349.6020359 | 0.95685 | 0.0954 | 2RXS J000350.3020344 | 2.200 | 0.280 | 0.031 | MCXC | |
| J000524.0161309 | 1.34998 | 0.1120 | 2RXS J000521.9161324 | 1.380 | 0.180 | 0.068 | MCXC | |
| J000242.7343935 | 0.67802 | 0.1160 | 3XMM J000243.0343943 | 0.160 | 0.021 | 0.020 | ||
| J000309.4295140 | 0.78896 | 0.0720 | 3XMM J000300.1295149 | 0.005 | 0.001 | 0.164 | ||
| WHY J000647.3344254 | 1.69701 | 0.1917 | 3XMM J000646.6344258 | 0.046 | 0.023 | 0.028 | ||
| WHY J001418.8302125 | 3.57844 | 0.2317 | 3XMM J001419.5302136 | 0.017 | 0.007 | 0.055 | ||
| J002745.8261626 | 6.94081 | 0.3662 | 3XMM J002745.1261616 | 0.392 | 0.049 | 0.071 | MCXC | |
| J004335.1010111 | 10.89621 | 0.1957 | 3XMM J004334.1010107 | 0.004 | 0.003 | 0.049 | 2XMMi-SDSS |
Note. Column (1): Cluster name; Column (2): RA (J2000) of cluster (degree); Column (3): Declination (J2000) of cluster (degree); Column (4): cluster redshift; Column (5): Name of X-ray source with J2000 coordinates; Column (6): X-ray flux ( erg cm-2 s-1) in the 0.1–2.4 keV band for the ROSAT sources and in the 2.0–4.5 keV for the XMM–Newton sources; Column (7): uncertainty of the X-ray flux ( erg cm-2 s-1); Column (8): projected offset between the X-ray source and the cluster (Mpc); and Column (9): previous X-ray cluster catalogue: MCXC (Piffaretti et al., 2011), 2XMMi-SDSS (Takey et al., 2011, 2013, 2014), WYS+14 (Wang et al., 2014), WHL09 (Wen et al., 2009), SWXCS (Liu et al., 2015), and XLSSC (Pacaud et al., 2016). The entries without the prefix of WHY in the column (1) are known clusters in previous optical, SZ or X-ray cluster catalogues (see Table 1).
(This table is available in its entirety in a machine-readable form.)
4.4 X-ray emission of galaxy clusters
Galaxy clusters possess hot intracluster medium and can be detected as extended X-ray sources. Here we check if the identified clusters from the 2MASS, WISE and SuperCOSMOS survey data are X-ray sources by cross-matching them with ROSAT and XMM-Newton X-ray source catalogues.
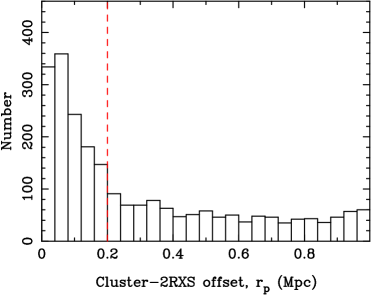
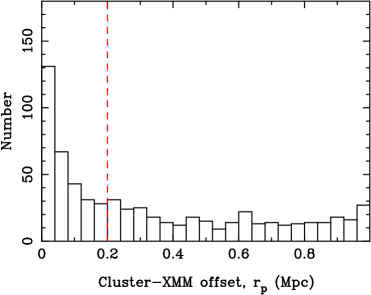
The ROSAT All Sky Survey (RASS) performed imaging observations of the whole sky in the 0.1–2.4 keV energy band (Truemper, 1982). The latest second ROSAT source catalogue (2RXS) contains 135,118 X-ray detections above a likelihood threshold of 6.5 and a flux limit of erg cm-2 s-1 (Boller et al., 2016). More than one thousand X-ray clusters have been identified previously as extended sources in the RASS image data: the Northern ROSAT All Sky (NORAS) cluster catalogue contains 378 clusters (Böhringer et al., 2000); The ROSAT–ESO Flux Limited X-ray (REFLEX) cluster catalogue contains 447 clusters with a flux limit of erg cm-2 s-1 in the Southern sky (Böhringer et al., 2004). Recently, the REFLEX and NORAS cluster samples have been updated, which contain 915 and 860 clusters, respectively (Böhringer et al., 2013; Böhringer et al., 2017, data not public yet). We cross-match galaxy clusters in Table 1 and Table 2 with the all sky ROSAT X-ray sources in Boller et al. (2016) to find new X-ray cluster candidates. As shown in Fig. 11, the distribution of ROSAT X-ray sources around the clusters shows an obvious number excess at the projected offset of Mpc, which suggests the association of these X-ray sources with galaxy clusters. If X-ray sources are randomly distributed without any association, the source count should increase with . From 35,241 X-ray sources with a detection likelihood greater than 10 and with a hardness-ratio in the ranges of and (see Voges et al., 1999), we find that there are ROSAT X-ray sources within a projected offset of Mpc for 1267 clusters. Among them, 600 are known X-ray clusters (Piffaretti et al., 2011; Wang et al., 2014; Liu et al., 2015) or cluster candidates (Wen et al., 2009), and the rest 667 clusters are therefore new X-ray cluster candidates as listed in Table 3.
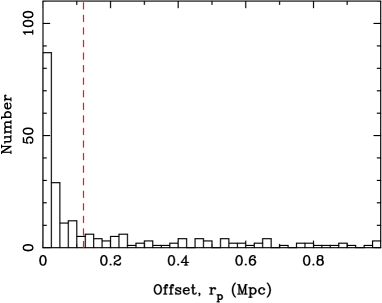
Currently the XMM–Newton is one of the most sensitive X-ray observatories in the energy range of 0.2–12 keV (Jansen et al., 2001) with a large field of view of 30 arcmin (Turner et al., 2001). Individual pointed observations provide serendipitous X-ray surveys of the sky, and about 50–100 X-ray sources can be detected from every single pointing (Watson et al., 2009) with a typical position error of 2 arcsec. We noticed that the latest XMM–Newton X-ray source catalogue, 3XMMI–DR6, lists 486,440 unique X-ray sources down to a flux limit of erg cm-2 s-1 from 9160 XMM-Newton observations (Rosen et al., 2016). Among them, 37746 extended X-ray sources are above a detection likelihood greater than 10 and have a size larger than 6 arcsec. We also cross-match our galaxy clusters with these X-ray sources. We first remove all (either extended or point) X-ray sources within 5 arcsec of WISE objects, which are probably bright stars or active galactic nuclei, and then find out the extended XMM-Newton sources around galaxy clusters listed in Table 1 and Table 2. Extended XMM–Newton X-ray sources are found within Mpc from 376 clusters, as shown in Fig. 11. Among them, 153 sources have already been included in the 2RXS, and another 111 sources come from known X-ray clusters (Piffaretti et al., 2011; Takey et al., 2011, 2013, 2014; Wang et al., 2014; Liu et al., 2015; Pacaud et al., 2016) or X-ray cluster candidates (Wen et al., 2009). The rest 112 extended XMM–Newton X-ray sources are therefore new X-ray cluster candidates as listed in Table 3.
Combining the ROSAT and XMM–Newton sources together, we get 779 new X-ray cluster candidates in total.
Recent studies showed that about 20–40% of BCGs are not central galaxies (Skibba et al., 2011; Hoshino et al., 2015; Oguri et al., 2017). Here we also check if the BCGs of our identified clusters are true central galaxies based on the offsets between BCG locations and the centres in high resolution X-ray images of clusters (see Oguri, 2014; Rozo & Rykoff, 2014; Rykoff et al., 2016). We use three lists of high resolution X-ray data: 239 massive clusters in the ACCEPT catalogue observed by Chandra (Cavagnolo et al., 2009), 94 clusters with high-resolution Chandra follow-up observations among the 238 massive clusters in the Mantz catalogue selected from ROSAT survey (Mantz et al., 2010), and 503 clusters from the XMM–Newton Cluster Survey (Mehrtens et al., 2012). Merging three catalogues gives 478 unique clusters at redshifts , of which 219 clusters are matched by our cluster catalogue. Fig. 12 shows the distribution of projected offset between the BCG locations and X-ray centres. It peaks at the offset of and has a standard deviation of Mpc, suggesting that most BCGs are well centred. We find that 66% (144 of 219) of the BCGs in our catalogue are central galaxies within the offset of 3 Mpc. The offset distribution becomes flat at Mpc, suggesting that these BCGs probably are miscentred.
5 Summary
By using the photometric redshift data for about 18.4 million galaxies of 2MASS, WISE and SuperCOSMOS obtained by Bilicki et al. (2014) and Bilicki et al. (2016), we identify 47,600 galaxy clusters in the sky survey area of 28,000 square degree. The BCG candidates are first selected by using the criteria of galaxy magnitude and colour. Clusters are then identified as the overdensity regions of galaxy counts around the BCG candidates. The detection rate is as high as 90% for massive clusters of in the redshift range of , and drops down to 50% for clusters with a mass of . Among 47,600 galaxy clusters, 26,125 clusters are identified for the first time which are mostly located in the sky outside the SDSS area. Monte Carlo simulations show that the false detection rate is less than 5% in general. By cross-matching with ROSAT and XMM–Newton sources, we find 779 new X-ray cluster candidates.
Acknowledgements
We thank the referee for valuable comments that helped to improve the paper. The authors are supported by the National Natural Science Foundation of China (Grant No. 11473034), the Key Research Program of the Chinese Academy of Sciences (Grant No. QYZDJ-SSW-SLH021) and the Young Researcher Grant of National Astronomical Observatories, Chinese Academy of Sciences. This work makes use the data from the Two Micron All Sky Survey, Wide-field Infrared Survey Explorer, SuperCOSMOS and SDSS.
References
- Abell (1958) Abell G. O., 1958, ApJS, 3, 211
- Abell et al. (1989) Abell G. O., Corwin Jr. H. G., Olowin R. P., 1989, ApJS, 70, 1
- Abramopoulos & Ku (1983) Abramopoulos F., Ku W. H.-M., 1983, ApJ, 271, 446
- Adami et al. (1998) Adami C., Mazure A., Katgert P., Biviano A., 1998, A&A, 336, 63
- Alam et al. (2015) Alam S., et al., 2015, ApJS, 219, 12
- Banerjee et al. (2018) Banerjee P., Szabo T., Pierpaoli E., Franco G., Ortiz M., Oramas A., Tornello B., 2018, New Astron., 58, 61
- Berlind et al. (2006) Berlind A. A., et al., 2006, ApJS, 167, 1
- Bilicki et al. (2014) Bilicki M., Jarrett T. H., Peacock J. A., Cluver M. E., Steward L., 2014, ApJS, 210, 9
- Bilicki et al. (2016) Bilicki M., et al., 2016, ApJS, 225, 5
- Blackburne & Kochanek (2012) Blackburne J. A., Kochanek C. S., 2012, ApJ, 744, 76
- Bleem et al. (2015a) Bleem L. E., Stalder B., Brodwin M., Busha M. T., Gladders M. D., High F. W., Rest A., Wechsler R. H., 2015a, ApJS, 216, 20
- Bleem et al. (2015b) Bleem L. E., et al., 2015b, ApJS, 216, 27
- Böhringer et al. (2000) Böhringer H., et al., 2000, ApJS, 129, 435
- Böhringer et al. (2004) Böhringer H., et al., 2004, A&A, 425, 367
- Böhringer et al. (2013) Böhringer H., Chon G., Collins C. A., Guzzo L., Nowak N., Bobrovskyi S., 2013, A&A, 555, A30
- Böhringer et al. (2017) Böhringer H., Chon G., Retzlaff J., Trümper J., Meisenheimer K., Schartel N., 2017, AJ, 153, 220
- Boller et al. (2016) Boller T., Freyberg M. J., Trümper J., Haberl F., Voges W., Nandra K., 2016, A&A, 588, A103
- Braid & MacGillivray (1978) Braid M. K., MacGillivray H. T., 1978, MNRAS, 182, 241
- Bruzual & Charlot (2003) Bruzual G., Charlot S., 2003, MNRAS, 344, 1000
- Cavagnolo et al. (2009) Cavagnolo K. W., Donahue M., Voit G. M., Sun M., 2009, ApJS, 182, 12
- Chon et al. (2013) Chon G., Böhringer H., Nowak N., 2013, MNRAS, 429, 3272
- Dalton et al. (1997) Dalton G. B., Maddox S. J., Sutherland W. J., Efstathiou G., 1997, MNRAS, 289, 263
- Durret et al. (2015) Durret F., et al., 2015, A&A, 578, A79
- Finoguenov et al. (2015) Finoguenov A., et al., 2015, A&A, 576, A130
- Gal et al. (2009) Gal R. R., Lopes P. A. A., de Carvalho R. R., Kohl-Moreira J. L., Capelato H. V., Djorgovski S. G., 2009, AJ, 137, 2981
- Geach et al. (2011) Geach J. E., Murphy D. N. A., Bower R. G., 2011, MNRAS, 413, 3059
- Girardi et al. (1995) Girardi M., Biviano A., Giuricin G., Mardirossian F., Mezzetti M., 1995, ApJ, 438, 527
- Gladders & Yee (2000) Gladders M. D., Yee H. K. C., 2000, AJ, 120, 2148
- Goto et al. (2002) Goto T., et al., 2002, AJ, 123, 1807
- Gunn et al. (1986) Gunn J. E., Hoessel J. G., Oke J. B., 1986, ApJ, 306, 30
- Hambly et al. (2001) Hambly N. C., Irwin M. J., MacGillivray H. T., 2001, MNRAS, 326, 1295
- Hao et al. (2010) Hao J., et al., 2010, ApJS, 191, 254
- Hasselfield et al. (2013) Hasselfield M., et al., 2013, J. Cosmology Astropart. Phys., 7, 008
- Hoshino et al. (2015) Hoshino H., et al., 2015, MNRAS, 452, 998
- Huchra & Geller (1982) Huchra J. P., Geller M. J., 1982, ApJ, 257, 423
- Jansen et al. (2001) Jansen F., et al., 2001, A&A, 365, L1
- Jarrett et al. (2000) Jarrett T. H., Chester T., Cutri R., Schneider S., Skrutskie M., Huchra J. P., 2000, AJ, 119, 2498
- Kochanek et al. (2003) Kochanek C. S., White M., Huchra J., Macri L., Jarrett T. H., Schneider S. E., Mader J., 2003, ApJ, 585, 161
- Koester et al. (2007) Koester B. P., et al., 2007, ApJ, 660, 239
- Kovács & Szapudi (2015) Kovács A., Szapudi I., 2015, MNRAS, 448, 1305
- Liu et al. (2015) Liu T., et al., 2015, ApJS, 216, 28
- Lopes et al. (2004) Lopes P. A. A., de Carvalho R. R., Gal R. R., Djorgovski S. G., Odewahn S. C., Mahabal A. A., Brunner R. J., 2004, AJ, 128, 1017
- Lumsden et al. (1992) Lumsden S. L., Nichol R. C., Collins C. A., Guzzo L., 1992, MNRAS, 258, 1
- Lupton et al. (2001) Lupton R., Gunn J. E., Ivezić Z., Knapp G. R., Kent S., 2001, in Harnden Jr. F. R., Primini F. A., Payne H. E., eds, Astronomical Society of the Pacific Conference Series Vol. 238, Astronomical Data Analysis Software and Systems X. pp 269–+
- Mantz et al. (2010) Mantz A., Allen S. W., Ebeling H., Rapetti D., Drlica-Wagner A., 2010, MNRAS, 406, 1773
- Marriage et al. (2011) Marriage T. A., et al., 2011, ApJ, 737, 61
- Mehrtens et al. (2012) Mehrtens N., et al., 2012, MNRAS, 423, 1024
- Merchán & Zandivarez (2005) Merchán M. E., Zandivarez A., 2005, ApJ, 630, 759
- Miller et al. (2005) Miller C. J., et al., 2005, AJ, 130, 968
- Oguri (2014) Oguri M., 2014, MNRAS, 444, 147
- Oguri et al. (2017) Oguri M., et al., 2017, preprint, (arXiv:1701.00818)
- Pacaud et al. (2016) Pacaud F., et al., 2016, A&A, 592, A2
- Peacock et al. (2016) Peacock J. A., Hambly N. C., Bilicki M., MacGillivray H. T., Miller L., Read M. A., Tritton S. B., 2016, MNRAS, 462, 2085
- Piffaretti et al. (2011) Piffaretti R., Arnaud M., Pratt G. W., Pointecouteau E., Melin J.-B., 2011, A&A, 534, A109
- Planck Collaboration et al. (2016) Planck Collaboration et al., 2016, A&A, 594, A27
- Popesso et al. (2007) Popesso P., Biviano A., Böhringer H., Romaniello M., 2007, A&A, 461, 397
- Postman & Lauer (1995) Postman M., Lauer T. R., 1995, ApJ, 440, 28
- Radovich et al. (2017) Radovich M., et al., 2017, A&A, 598, A107
- Rosen et al. (2016) Rosen S. R., et al., 2016, A&A, 590, A1
- Rozo & Rykoff (2014) Rozo E., Rykoff E. S., 2014, ApJ, 783, 80
- Rykoff et al. (2014) Rykoff E. S., et al., 2014, ApJ, 785, 104
- Rykoff et al. (2016) Rykoff E. S., et al., 2016, ApJS, 224, 1
- Sandage (1972) Sandage A., 1972, ApJ, 178, 1
- Skibba et al. (2011) Skibba R. A., van den Bosch F. C., Yang X., More S., Mo H., Fontanot F., 2011, MNRAS, 410, 417
- Skrutskie et al. (2006) Skrutskie M. F., et al., 2006, AJ, 131, 1163
- Smith et al. (2012) Smith A. G., Hopkins A. M., Hunstead R. W., Pimbblet K. A., 2012, MNRAS, 422, 25
- Sunyaev & Zeldovich (1972) Sunyaev R. A., Zeldovich Y. B., 1972, Comments on Astrophysics and Space Physics, 4, 173
- Szabo et al. (2011) Szabo T., Pierpaoli E., Dong F., Pipino A., Gunn J., 2011, ApJ, 736, 21
- Tago et al. (2006) Tago E., et al., 2006, Astronomische Nachrichten, 327, 365
- Tago et al. (2008) Tago E., Einasto J., Saar E., Tempel E., Einasto M., Vennik J., Müller V., 2008, A&A, 479, 927
- Tago et al. (2010) Tago E., Saar E., Tempel E., Einasto J., Einasto M., Nurmi P., Heinämäki P., 2010, A&A, 514, A102
- Takey et al. (2011) Takey A., Schwope A., Lamer G., 2011, A&A, 534, A120
- Takey et al. (2013) Takey A., Schwope A., Lamer G., 2013, A&A, 558, A75
- Takey et al. (2014) Takey A., Schwope A., Lamer G., 2014, A&A, 564, A54
- Tempel et al. (2012) Tempel E., Tago E., Liivamägi L. J., 2012, A&A, 540, A106
- Tempel et al. (2014) Tempel E., et al., 2014, A&A, 566, A1
- Tempel et al. (2016) Tempel E., Kipper R., Tamm A., Gramann M., Einasto M., Sepp T., Tuvikene T., 2016, A&A, 588, A14
- Truemper (1982) Truemper J., 1982, Advances in Space Research, 2, 241
- Turner et al. (2001) Turner M. J. L., et al., 2001, A&A, 365, L27
- Vikhlinin et al. (2009) Vikhlinin A., et al., 2009, ApJ, 692, 1033
- Voges et al. (1999) Voges W., et al., 1999, A&A, 349, 389
- Wang et al. (2014) Wang L., et al., 2014, MNRAS, 439, 611
- Watson et al. (2009) Watson M. G., et al., 2009, A&A, 493, 339
- Wen & Han (2011) Wen Z. L., Han J. L., 2011, ApJ, 734, 68
- Wen & Han (2015) Wen Z. L., Han J. L., 2015, ApJ, 807, 178
- Wen et al. (2006) Wen Z.-L., Yang Y.-B., Zhou X., Yuan Q.-R., Ma J., 2006, Chinese J. Astron. Astrophys., 6, 521
- Wen et al. (2009) Wen Z. L., Han J. L., Liu F. S., 2009, ApJS, 183, 197
- Wen et al. (2012) Wen Z. L., Han J. L., Liu F. S., 2012, ApJS, 199, 34
- Wright et al. (2010) Wright E. L., et al., 2010, AJ, 140, 1868
- Xu et al. (2014) Xu W. W., Wen Z. L., Han J. L., 2014, Sci. China Phys. Mech. Astron., 57, 2168
- Yan et al. (2013) Yan L., et al., 2013, AJ, 145, 55
- Yang et al. (2007) Yang X., Mo H. J., van den Bosch F. C., Pasquali A., Li C., Barden M., 2007, ApJ, 671, 153
- York et al. (2000) York D. G., et al., 2000, AJ, 120, 1579
- Zwicky et al. (1961) Zwicky F., Herzog E., Wild P., Karpowicz M., Kowal C. T., 1961, Catalogue of galaxies and of clusters of galaxies, Vol. I. California Institute of Technology (CIT), Pasadena