Superconductivity in the ternary compound SrPt10P4 with complex new structure
Abstract
We report superconductivity at 1.4K in the ternary SrPt10P4 with a complex new structure. SrPt10P4 crystallizes in a monoclinic space-group C2/c (#15) with lattice parameters a= 22.9151(9), b= 13.1664(5), c=13.4131(5), and = 90.0270(5)∘. Bulk superconductivity in the samples has been demonstrated through resistivity, ac susceptibility, and heat capacity measurements. High pressure measurements have shown that the superconducting TC is systematically suppressed upon application of pressure, with a dTC/dP coefficient of -0.016 K/GPa.
pacs:
74.20.Rp, 74.70.Dd, 74.62.Dh, 65.40.BaI Introduction
The discovery of Fe-pnictide superconductors with TC up to 57K1 ; 2 has stimulated many research efforts to search for new superconductors in other transition metal pnictide compounds and in their Fe-based layered analogs with related or unrelated structures. Among different types of Fe-pnictide discovered to date, the so-called ”122” materials3 ; 4 ; 5 with ThCr2Si2-type structures are of particular interest. More than 700 compounds of AM2X2 adopt this structures6 , and a variety of interesting physics, such as valence fluctuations7 ; 8 , heavy fermion behavior9 ; 10 , and magnetic properties11 ; 12 ; 13 , have been discussed before. Questions, therefore, are raised that whether superconductivity could be found in other materials which adopts similar type structures. In fact, many new superconducting compounds with related structures have been discovered, including BaNi2P2 (TC=3K)14 , BaNi2As2 (TC= 0.7K)15 and BaIr2As2 (TC=2.45K)16 , with a ThCr2Si2-type structure, SrPt2As2 (TC=5.2 K)17 and BaPt2Sb2 (TC=1.8K)18 with a CaBe2Ge2-type structure, and SrPtAs (TC=2.4K) with a MgB2-type structure19 . On the other hand, many Pt-based superconductors with unrelated structures have been discovered which include noncentrosymmetric BaPtSi320 , Li2Pt3B21 ; 22 , heavy Fermion CePt3Si23 , and the recently discovered centrosymmetric SrPt3P (TC=8.4 K)24 . SrPt3P crystallizes in an antiperovskite structure that is very similar to that of CePt3Si but displays centrosymmetry. Further calorimetric studies suggested that it is a conventional strong electron-phonon coupling superconductor, but further theoretical calculations have brought a new perspective25 ; 26 , i.e. one may be able to tune the structure from centrosymmetric to noncentrosymmetric through chemical doping or application of pressure25 and to induce possible unconventional superconductivity in this compound. Various experimental efforts27 ; 28 ; 29 have been carried out, but unfortunately have not shown significant change of the structures. In the course of chemical doping studies of SrPt3P, we have discovered several new compounds, namely SrPt6P2 (TC=0.6K)30 and SrPt10P4. SrPt10P4 crystallizes in a very complex structure (with a total of 240 atoms in one unit cell). Resistivity, ac susceptibility, and heat capacity measurements have demonstrated bulk superconductivity at 1.4K in this new compound. High pressure measurements have shown that the superconducting Tc is systematically suppressed upon application of pressure, with a dTC/dP coefficient of -0.016 K/GPa.

| Crystal system: Monoclinic Space group: C2/c(No. 15) Total reflection: 12841 | ||||
| Independent reflection: 4963 Absorption coefficient: 143.456 mm-1 Goodness-of-fit: 1.003 | ||||
| Unit cell parameter: a=22.9151(9), b=13.1664(5), c=13.4131(5), =90.0270∘ | ||||
| Atomic position | ||||
| atom | Wyckoff | x/a | y/b | z/c |
| Pt1 | 8f | 0.0782(1) | 0.2746(1) | 0.0164(1) |
| Pt2 | 8f | 0.3247(1) | -0.0210(1) | 0.5158(1) |
| Pt3 | 8f | 0.2477(1) | -0.0144(1) | 0.3512(1) |
| Pt4 | 8f | 0.1212(1) | 0.1487(1) | 0.3431(1) |
| Pt5 | 8f | 0.1513(1) | 0.0028(1) | 0.4813(1) |
| Pt6 | 8f | 0.1178(1) | 0.1182(1) | 0.1438(1) |
| Pt7 | 8f | 0.1267(1) | 0.1085(1) | 0.6543(1) |
| Pt8 | 8f | 0.0016(1) | 0.2656(1) | -0.1478(1) |
| Pt9 | 8f | 0.0956(1) | 0.2515(1) | 0.5156(1) |
| Pt10 | 8f | 0.1183(1) | 0.3654(1) | -0.1558(1) |
| Pt11 | 8f | 0.2321(1) | -0.0210(1) | 0.6514(1) |
| Pt12 | 8f | 0.3538(1) | 0.1168(1) | 0.3520(1) |
| Pt13 | 8f | 0.1925(1) | 0.2650(1) | -0.0049(1) |
| Pt14 | 8f | 0.1344(1) | 0.3937(1) | 0.1549(1) |
| Pt15 | 8f | 0.3675(1) | 0.1309(1) | 0.6453(1) |
| Pt16 | 8f | 0.0356(1) | 0.0800(1) | 0.4892(1) |
| Pt17 | 8f | 0.0585(1) | 0.4887(1) | -0.0014(1) |
| Pt18 | 8f | 0.1037(1) | 0.1359(1) | -0.1493(1) |
| Pt19 | 8f | 0.2134(1) | 0.1710(1) | 0.5131(1) |
| Pt20 | 8f | -0.0129(1) | 0.2723(1) | 0.1508(1) |
| Sr1 | 4e | 0 | 0.0089(2) | 0.25 |
| Sr2 | 8f | 0.2495(1) | 0.2549(2) | 0.2468(2) |
| Sr3 | 4e | 0 | 0.4958(2) | -0.25 |
| P1 | 8f | 0.3122(2) | 0.1592(4) | 0.5023(5) |
| P2 | 8f | 0.2337(2) | -0.1085(4) | 0.5007(4) |
| P3 | 8f | 0.0620(2) | 0.0934(4) | 0.0016(4) |
| P4 | 8f | 0.0829(2) | 0.2629(4) | 0.2209(5) |
| P5 | 8f | -0.0874(2) | 0.2561(4) | -0.2202(5) |
| P6 | 8f | 0.1569(2) | 0.0014(4) | 0.2791(5) |
| P7 | 8f | 0.3242(2) | -0.0064(4) | 0.7227(5) |
| P8 | 8f | 0.0130(2) | 0.6405(4) | 0.0009(5) |
II Experimental section
The polycrystalline samples were prepared by high temperature reactions of stoichiometric Sr pieces (Alfa Aesar, 99.95), Pt powder (Alfa Aesar, 99.95), and prereacted PtP2 from Pt powder and P powder (Sigma Aldrich, 99.99) within an alumina crucible that was sealed inside a clean and dried quartz tube under vacuum. The tube was placed in a furnace, heated slowly up to 1000∘C overnight, and maintained at 1000∘C for four days before being slowly cooled down to 400∘C with a rate of 0.5∘C/min. The assembly was finally quenched in ice water from 400∘C to avoid the possible formation of white phosphorus caused by any unreacted P. To improve the homogeneity, the sample was reground, pelletized, and reheated following the previously described temperature profile. All synthesis procedures were carried out within a purified Ar-atmosphere glovebox with total O2 and H2O levels 0.1 ppm. Single crystal XRD data was collected using a Bruker SMART APEX diffractometer equipped with 1K CCD area detector using graphite-monochromated Mo Kα radiation. The electrical resistivity (T, H) was measured by employing a standard 4-probe method, and heat capacity data were collected using a relaxation method down to 0.5 K under magnetic field up to 1 T using a 3He-attachment in a Quantum Design Physical Property Measurement System. The ac magnetic susceptibility at 15.9 Hz as a function of temperature, (T), was measured by employing a compensated dual coil for mutual inductance measurement using the Linear Research LR 400 Bridge. High-pressure resistivity measurements up to 18 kbar were conducted using a BeCu piston-cylinder cell with Fluorinert77 as the quasihydrostatic pressure medium. A lead manometer was used to measure the pressure in situ with the LR 400 Inductance Bridge31 ; 32 .
III Results and Discussion
The as-synthesized pellet has a dark grey color, and is stable in air. On its top, many small shiny crystals with metallic luster are found, indicating that the material is a congruently melting compound, and that larger size crystals could be obtained through slow cooling process from melt. Indeed, we obtained large crystals with size up to 0.7 mm (as shown in the inset to Fig. 1), which were subsequently used for electrical resistivity and magnetic susceptibility measurements. X-ray diffraction studies reveal a c-axis preferred orientation, as shown in Fig. 1. The (004) peak is too weak to be observed, consistent with the theoretical pattern generated from crystal structures determined by X-ray single-crystal diffraction. Small blocks of shiny single crystals with a typical size of 0.04 x 0.04 x 0.06 mm3 were isolated for single-crystal X-ray diffraction to determine the crystal structure. The refined composition is SrPt10P4, which is consistent with SEM-WDS results of Sr:Pt:P=1:9.66(1):3.67(2). The compound crystallizes in a monoclinic space-group C2/c (#15) with lattice parameters a= 22.9151(9), b= 13.1664(5), c=13.4131(5), = 90.0270(5)∘ and z=16. It should be noted that we have carried out symmetry tests on all of the refined atom positions by using the program PLATON and concluded that C2/c is the correct space group and that no higher symmetry can be found. Arbitrarily merging data to the orthorhombic Laue group mmm results in an unusually high R(int) = 0.427, as compared to the actual monoclinic Laue group 2/m with R(int) = 0.039. This further confirms that the compound indeed crystallizes in a monoclinic, not orthorhombic, structure. The detailed crystallographic information, including the Wyckoff position of individual atoms, is listed in Table I.
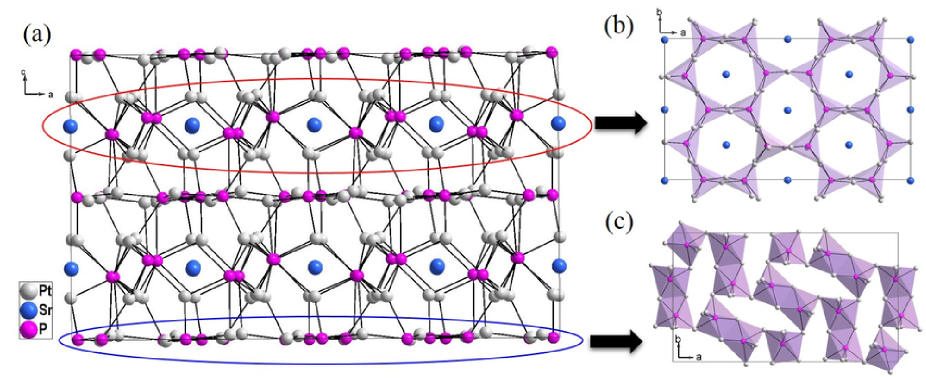
The structure of SrPt10P4 is rather complicated with its unit cell shown in Fig. 2a. The fundamental build unit is a 6-coordinated P-centered highly distorted Pt6P octahedral or trigonal prism, as seen previously in the SrPt3P11 and SrPt6P215 structures. The crystal structure could be considered as two distinct types of layers intertwined with one another, shown in Fig. 2a (projection view along b axis), forming a complex three-dimensional structure. One layer consists of distorted trigonal prismatic Pt6P units that are edge-shared with each other and form a honeycomb-like network as seen in Fig. 2b (projection view along c axis). Sr atoms occupy the centers of the honeycomb-like network (crystallographic 4e site). The other layer is composed of a network of highly distorted Pt6P octahedral building blocks. These Pt6P octahedra are edge-shared first and forms pairs. These pairs of edge-shared octahedra are then corner shared with one another and form a network in which the Pt-Pt distance of neighboring Pt6P octahedra is too short (2.668) to accommodate any Sr atom, as seen in Fig. 2c (projection view along c axis).
The distorted octahedral Pt6P is reminiscent of the distorted anti-perovskite Pt6P building blocks in SrPt3P. In SrPt3P, the Pt6P octahedra are corner-shared, arranged antipolar, and thus formed stoichiometry as ”Pt6/2P=Pt3P”. But in StPt10P4, these Pt6P octahedra are arranged completely differently, where they are edge-shared forming “Pt10P2”, and then corner-shared. To facilitate such an arrangement, the Pt6P octahedr is much more distorted than those in SrPt3P. Similarly, the trigonal prismatic Pt6P building blocks in SrPt10P4 are very similar to those found in SrPt6P2, but less distorted to accommodate the edge-sharing coordination in SrPt10P4, rather than corner-shared feature in SrPt6P2.
The electrical resistivity (T) of SrPt10P4 from 270K down to 0.5K is shown in Fig. 3. The room temperature resistivity of SrPt10P4 is 300cm, smaller than that of SrPt3P and SrPt6P2, and consistent with the expected trend toward increased metallicity with increased Pt:P ratio in the compound. The temperature dependence of the resistivity has a typical metallic behavior, with a much stronger negative curvature in the normal state than is seen in SrPt3P and SrPt6P2, indicating the stronger electron correlations in this material. The relatively high value of residual resistivity ratio (RRR), (270 K)/(1.5 K)=32, suggests that the sample is of high quality. The resistivity drops sharply to zero below 1.4 K at zero field, characteristic of a superconducting transition. The narrow width of the superconducting transition (less than 0.1 K) indicates the high quality of the sample. In the presence of a magnetic field, the superconducting transition is systematically broadened and shifted to lower temperature, and is suppressed to below 0.5K upon the application of a magnetic field of 1T, as shown in the inset to Fig. 3.

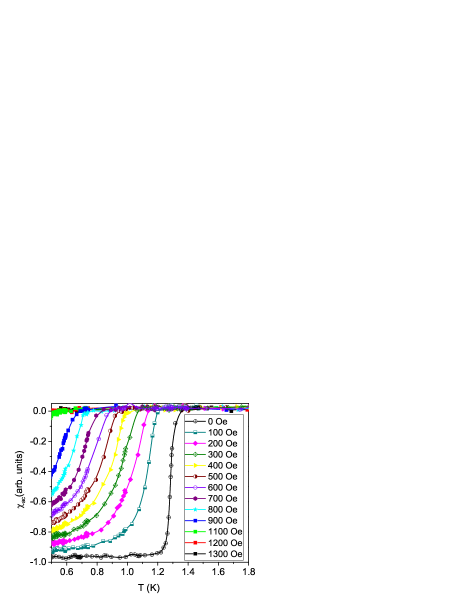
Fig. 4 shows the ac susceptibility data of StPt10P4, where a large and narrow diamagnetic shift starting from 1.4K is clearly visible. This magnetic susceptibility is shifted toward the left upon applying magnetic field as expected, and also reveals the suppression of TC with increasing field.
In order to further verify the bulk nature of the superconductivity in SrPt10P4, we carried out specific heat measurements. Because the mass of the largest crystal we have is 0.1mg, which falls below the critical mass needed for the specific heat measurement, we decided to measure a pure, bulk, polycrystalline sample. Figure 5 (a) shows the raw data of this measurement under different applied magnetic fields up to 4000 Oe. The jump at TC observed in the specific heat data clearly demonstrates the bulk nature of the superconductivity in the sample.
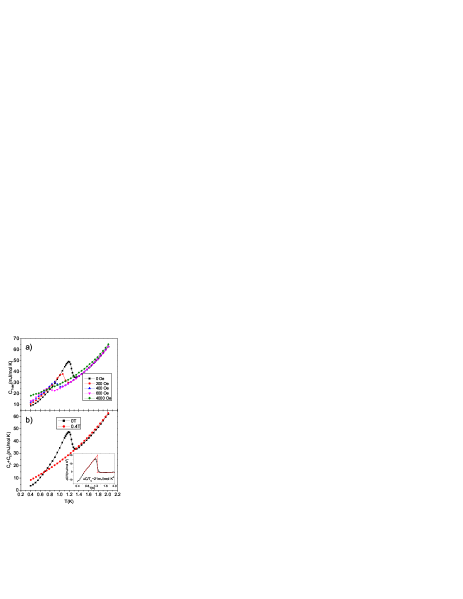
It can also be clearly seen that the superconducting and normal state specific heat data deviate from one another, which may be caused by the Schottky anomaly at low temperature range. Using CTotal=CEl+CP+CSch=T+T3 + nR()2()/(1+())2, where is the energy between two levels by considering spin J=1/233 , we can obtain the contributions of electrons (CEl) and phonons (CP) to the total specific heat (CTotal) by subtracting that associated with the Schottky anomaly (CSch). The normal state electron and phonon contribution (Fig. 5b, line with red circles) was obtained by subtracting CSch(0.4T) from the normal state CTotal(T) at 0.4T. By fitting CTotal(T, 0.4T) through the Debye model, we obtained a Sommerfeld coefficient = 20.6 mJ/mol K2 and = 2.64 mJ/mol K4, which correspond to the electronic and lattice contributions to the specific heat, respectively. The Debye temperature can be deduced from the value through the relationship = (12kBNAZ/5)1/3 and the obtained Debye temperature = 223K. Through a similar approach, we can also obtain the zero field electron and phonon specific heat (Fig. 5b, line with black squares) by subtracting the zero field Schottky contribution CSch(T, 0T). By subtracting the normal state specific heat from the superconducting one, we can get CEl/TC 21 mJ/mol K2, which yields a CEl/TC of about 1.02, as seen in the inset to Fig. 5b. This value is comparable to the 1.2 for SrPt6P234 but much smaller than the 2 for SrPt3P. Such a small value of CEl/TC indicates weak coupling in this compound in comparison with SrPt3P. Our preliminary specific heat fitting and critical field analysis strongly suggest multiple gap superconductivity feature for this compound, which will be addressed separately.

The Kadowaki-Woods ratio RKW=A/ has been used to judge the correlation of a metal where A is the quadratic term of resistivity of a Fermi liquid, and is the Sommerfeld coefficient of the specific heat35 . The RKW is found to be a constant value for transition metals() and heavy fermion compounds()36 . We, therefore, have fitted the low temperature resistivity data using and get A = 0.032 cm /K2. Combined with the value obtained above, the calculated RKW is 7.5*10-5 cm K2 mol2/mJ2, which indicates strong correlation in this material.
To probe the effects of high pressure on SrPt10P4, we applied high physical pressure using a BeCu piston-cylinder type pressure cell. Fig. 6 shows the resistivity data of SrPt10P4 under different applied pressure. The superconducting transition is slightly lower and is relatively broader with the onset of the resistivity drop at 1.33K and zero resistance at 1.25 K. The broader superconducting transition may be related to the polycrystalline nature of the samples used for this measurement (as well as possible sample degradation during the preparation) and grain-grain coherence within the sample. A systematic suppression of the transition temperature with increasing pressure is clearly visible. Taking a 50 drop of resistivity as the criteria of TC, one can obtain a linear fit of TC vs. pressure, shown in the inset to Fig. 6, which yields a pressure coefficient dTC/dP = -0.016 K /GPa. The systematic suppression of TC suggests that there is no significant peak in the density of states near the Fermi level. The relatively small change in TC with pressure is comparable to that of many elemental superconductors, which exhibit a linear suppression of TC with pressure near ambient, and is very close to the value of dTC/dP = -0.02 K/GPa for pure niobium metal37 . The suppression of TC with pressure in SrPt10P4 can therefore be explained as the result of a stiffening of the lattice induced by the pressure, which results in a weakening of the electron-phonon coupling or slightly decreasing of the density of state(DOS) at the Fermi surface.
In summary, a new ternary compound SrPt10P4 with a new structure type is synthesized through high-temperature solid state reactions, and its crystal structure is determined by X-ray single crystal diffraction. The compound crystallizes in a very complex three-dimensional structure that consists of two distinct layers based on P-centered highly distorted Pt6P octahedral or trigonal prismatic building units. We have carried out systematic magnetization, electrical resistivity, and specific heat measurements, and demonstrated the bulk superconductivity with TC at 1.4K in this material. High pressure measurements have shown that the superconducting TC is systematically suppressed upon applying pressure, with a dTC/dP coefficient of -0.016 K/GPa.
Acknowledgements.
The authors would like to thank X. Q. Wang for the help with single crystal diffraction measurement. This work in Houston is supported in part by US Air Force Office of Scientific Research Grant No. FA9550-15-1-0236, the T.L.L. Temple Foundation, the John J. and Rebecca Moores Endowment, and the State of Texas through the Texas Center for Superconductivity at the University of Houston. B. Lv and S. Li also would like to acknowledge the funding support from US Air Force Office of Scientific Research and the Start-Up funds from University of Texas at Dallas.⋆ To whom correspondence should be addressed:
blv@utdallas.edu, cwchu@uh.edu
References
- (1) Y. Kamihara, T. Watanabe, M. Hirano, and H. Hosono, J. Am. Chem. Soc., 130, 3296 (2008).
- (2) Z. Wei, H. Li, W. L. Hong, Z. Lv, H. Wu, X. Guo, and K. Ruan, J. Supercond. Nov. Magn. 21, 213(2008).
- (3) M. Rotter, M. Tegel, and D. Johrendt, Phys. Rev. Lett. 101, 107006 (2008).
- (4) K. Sasmal, B. Lv, B. Lorenz, A. M Guloy, F. Chen, Y. Y. Xue, and C. W. Chu, Phys. Rev. Lett., 101, 107007(2008).
- (5) N. Ni, S. Nandi, A. Kreyssig, A. I. Goldman, E. D. Mun, S. L. Bud’ko, and P. C. Canfield, Phys. Rev. B 78, 014523(2008).
- (6) R. Hoffman, and C. Zheng, J. Phys. Chem., 89, 4175(1985).
- (7) E. R. Bauminger, D. Froindlich, I. Nowik, S. Ofer, I. Felner, and I. Mayer, Phys. Rev. Lett. 30, 1053 (1973).
- (8) J. R. Neilson, T. M. McQueen, A. Llobet, J. Wen, and M. R. Suchomel, Phys. Rev. B 87, 045124 (2013).
- (9) F. Steglich, J. Aarts, C. D. Bredl, W. Lieke, D. Meschede, W. Franz, and H. Schäfer, Phys. Rev. Lett. 43, 1892(1979).
- (10) Z. Hossain, C. Geibel, F. Weickert, T. Radu, Y. Tokiwa, H. Jeevan, P. Gegenwart, and F. Steglich, Phys. Rev. B 72, 094411 (2005).
- (11) U. B. Paramanik, R. Prasad, C. Geibel, Z. Hossain, Phys. Rev. B 89, 144423 (2014).
- (12) V. K. Anand and D. C. Johnston, Phys. Rev. B 91, 184403 (2015).
- (13) M. Imai, C. Michioka, H. Ueda, and K. Yoshimura, Phys. Rev. B 91, 184414 (2015).
- (14) T. Mine, H. Yanagi, T. Kamiya, Y. Kamihara, M. Hirano, and H. Hosono. Solid State Commun. 147, 111(2008).
- (15) F. Ronning, N. Kurita, E. D. Bauer, B. L. Scott, T. Park, T. Klimczuk, R. Movshovich, and J. D. Thompson: J. Phys.: Condens. Matter 20, 342203(2008).
- (16) X. C. Wang, B. B. Ruan, J. Yu, B. J. Pan, Q. G. Mu, T.Liu, G. F. Chen, Z. A. Ren, Supercond. Sci. Technol., 30, 035007(2017).
- (17) K. Kudo, Y. Nishikubo, and M. Nohara: J. Phys. Soc. Jpn. 79, 123710(2010).
- (18) M. Imai, S. Ibuka, N. Kikugawa, T. Terashima, S. Uji, T. Yajima, H. Kageyama, and I. Hase Phys. Rev. B 91, 014513(2015).
- (19) Y. Nishikubo, K. Kudo, M. Nohara, J. Phys. Soc. Jpn. 80, 055002 (2011).
- (20) E. Bauer, R. T. Khan, H. Michor, E. Royanian, A. Grytsiv, N. Melnychenko-Koblyuk, P. Rogl, D. Reith, R. Podloucky, E.-W. Scheidt, W. Wolf, and M. Marsman, Phys. Rev. B 80, 064504 (2009).
- (21) K. Togano, P. Badica, Y. Nakamori, S. Orimo, H. Takeya, and K. Hirata, Phys. Rev. Lett. 93, 247004 (2004).
- (22) P. Badica, T. Kondo, and K. Togano, J. Phys. Soc. Jpn. 74, 1014(2005).
- (23) E. Bauer, G. Hilscher, H. Michor, C. Paul, E. W. Scheidt, A. Gribanov, Y. Seropegin, H. Noel, M. Sigrist, and P. Rogl, Phys. Rev. Lett. 92, 027003 (2004).
- (24) T. Takayama, K. Kuwano, D. Hirai, Y. Katsura, A. Yamamoto, and H. Takagi, Phys. Rev. Lett. 108, 237001 (2012).
- (25) A. Subedi, L. Ortenzi, and L. Boeri, Phys. Rev. B 87, 144504 (2013).
- (26) H. Chen, X. Xu, C. Cao, and J. Dai, Phys. Rev. B 86, 125116 (2012).
- (27) B. I. Jawdat, B. Lv, X. Y. Zhu, Y. Y. Xue, and C. W. Chu, Phys. Rev. B 91, 094514 (2015).
- (28) K. Hu, B. Gao, Q. Ji, Y. Ma, W. Li, X. Xu, H. Zhang, G. Mu, F. Huang, C. Cai, X. Xie, and M. Jiang, Phys. Rev. B 93 214510 (2016).
- (29) K. Hu, B. Gao, Q. Ji, Y. Ma, H. Zhang, G. Mu, F. Huang, C. Cai, and X. Xie, Front. Phys. , 11, 117403 (2016)
- (30) B. Lv. B. I. Jawdat, Z. Wu, M. Sorolla, M. Gooch, K. Zhao, L. Deng, Y. Y. Xue, B. Lorenz. A. M. Guloy, and C. W. Chu, Inorg. Chem, 54, 1049(2015).
- (31) T. F. Smith, C. W. Chu, and M. B. Maple, Cryogenics 9, 53 (1969).
- (32) C. W. Chu, Phys. Rev. Lett. 33, 1283 (1974).
- (33) A. Tari, ”The Specific Heat of Master at Low Temperatures”, Imperial College Press, London, p. 150, (2003).
- (34) B. M. Jawdat, B. Lv, Z. Wu, and C. W. Chu, unpublished data.
- (35) K. Kadowaki, and S. B. Woods, Solid State Commun. 58, 507-509 (1986).
- (36) A. C. Jacko, J. O. Fjærestad, B. J. Powell Nat. Phys. 5, 422-425 (2009).
- (37) T. Smith, Physics Letters 33A, 465 (1970).