Detection of magnetic field in the B2 star Oph A with ESO FORS2. ††thanks: Based on observations collected at the European Organisation for Astronomical Research in the Southern Hemisphere under ESO programmes 099.D-0067(A) and 078.C-0403(A).
Circumstantial evidence suggests that magnetism and enhanced X-ray emission are likely correlated in early B-type stars: similar fractions of them ( 10%) are strong and hard X-ray sources and possess strong magnetic fields. It is also known that some B-type stars have spots on their surface. Yet up to now no X-ray activity associated with spots on early-type stars was detected. In this Letter we report the detection of a magnetic field on the B2V star Oph A. Previously, we assessed that the X-ray activity of this star is associated with a surface spot, herewith we establish its magnetic origin. We analyzed FORS2 ESO VLT spectra of Oph A taken at two epochs and detected a longitudinal component of the magnetic field of order of G in one of the datasets. The detection of the magnetic field only at one epoch can be explained by stellar rotation which is also invoked to explain observed periodic X-ray activity. From archival HARPS ESO VLT high resolution spectra we derived the fundamental stellar parameters of Oph A and further constrained its age. We conclude that Oph A provides strong evidence for the presence of active X-ray emitting regions on young magnetized early type stars.
Key Words.:
Stars: activity – Stars: early-type – Stars: magnetic field – Stars: individual: Rho Ophiuchi A1 Introduction
X-ray emission is a common feature among massive stars of spectral types O through early B (Oskinova 2016). In single O-stars, a soft X-ray emission is thought to be generated by intrinsic shocks in the stellar winds (Owocki et al. 1988; Feldmeier et al. 1997a, b). In binary systems, large-scale shocks associated with wind-wind collisions can manifest themselves in additional X-ray emission (Stevens et al. 1992). In strongly magnetized massive early type stars, winds can be channeled and collide at high Mach numbers generating hard X-ray emission (Babel & Montmerle 1997; ud-Doula & Owocki 2002).
In this framework, the generation of X-rays in stellar winds is less probable in B type stars because of their weaker winds compared to those from O and Wolf-Rayet stars (Prinja 1989). Early B stars mark the transition from strong winds / X-ray emitters to weak winds stars / X-ray dark stars toward the rise of coronal X-rays in late A and F type stars. The rate of detection in X-rays among B stars falls to about 50% (Wolk et al. 2011; Nazé et al. 2011; Berghoefer et al. 1997). Little is known about wind-wind collision in binaries with B-type non-supergiant companions. Recently, Ignace et al. (2017, ApJ submitted) showed that even in close B0V-type binaries the enhanced X-ray emission due to the wind-wind collision is not observed. Only in a a few non super-giant B-stars, hard X-ray emission is detected and represents a signature of strong magnetic fields (Petit et al. 2013). In this context, we report the detection of magnetic field in the B2, X-ray bright star Oph A.
Rho Ophiuchi designates a multiple system of B2 to B5 stars at a distance from the Sun of about 110 pc. In particular, Oph A is a B2 star in a binary system with another B2 star separated by about 300 AU. The age of this star is estimated in the 7-10 Myr range (Pillitteri et al. 2016a), as it is coeval of a group of low mass disk-less stars that surround it. Oph is at the center of a small cluster born from the first burst of star formation in the Rho Ophiuchi cloud. We have observed Oph with the X-ray telescope XMM-Newton in 2013 (50 ks) discovering that it emits X-rays (Pillitteri et al. 2014). In 2016 monitoring observations for another 140 ks (Pillitteri et al. 2017) confirmed that Oph A emits X-rays in a peculiar way not previously seen in any other B-type star. We observed two increases of the X-ray flux, with the second event being the strongest and, likely, a flare. The time elapsed between the two events is approximately 1.2 days; the same interval corresponds to the rotational period of the star, and it allows to phase-fold the data of 2013 and 2016 observations. In Pillitteri et al. (2016b) we hypothisezed that an active spot of magnetic origin is the cause of the periodic increase of X-ray flux. Here we present the detection of magnetic field in Oph A in spectra acquired with FORS2 at ESO-VLT. The structure of the paper is the following: in 2 we present the data, their analysis and our results, in 3 we discuss the results and present our conclusions.
2 Observations, data reduction, and results
The star Oph A (a.k.a. HR 6112) was observed with the FORS2 low-resolution spectropolarimeter (Appenzeller et al. 1998), which is attached to the ESO/VLT UT1 (Antu) of the Paranal Observatory (Chile). The data were taken in two epochs (17th of July and 11th of August 2017), with a slit width of 0.4, and the grism 600B. The grism and slit width lead to a resolving power of approximately 1700 and the spectra cover the 3250–6215 Å, which includes all Balmer lines, except H, and a number of He lines. For each epoch, the star was observed with a sequence of eight spectra obtained by rotating the quarter waveplate alternatively from 45∘ to 45∘ every second exposure (i.e. 45∘, 45∘, 45∘, 45∘, 45∘, 45∘, 45∘, 45∘). The exposure times and obtained signal-to-noise ratios (S/N) per pixel of Stokes calculated around 4950 Å are listed in Table 1.
| Date | HJD | # of | Exp. | S/N |
|---|---|---|---|---|
| 2450000 | frames | time | ||
| 17/07/2017 | 57951.03705 | 8 | 3.0 | 2357 |
| 11/08/2017 | 57976.06673 | 8 | 8.0 | 3094 |
| Date | B | N | B | N |
| Hydrogen | All | |||
| 17/07/2017 | 107(2.6) | 3796(0.4) | 68(1.9) | 562(0.1) |
| 11/08/2017 | 84(5.7) | 4786(0.5) | 40455(7.3) | 3058(0.5) |
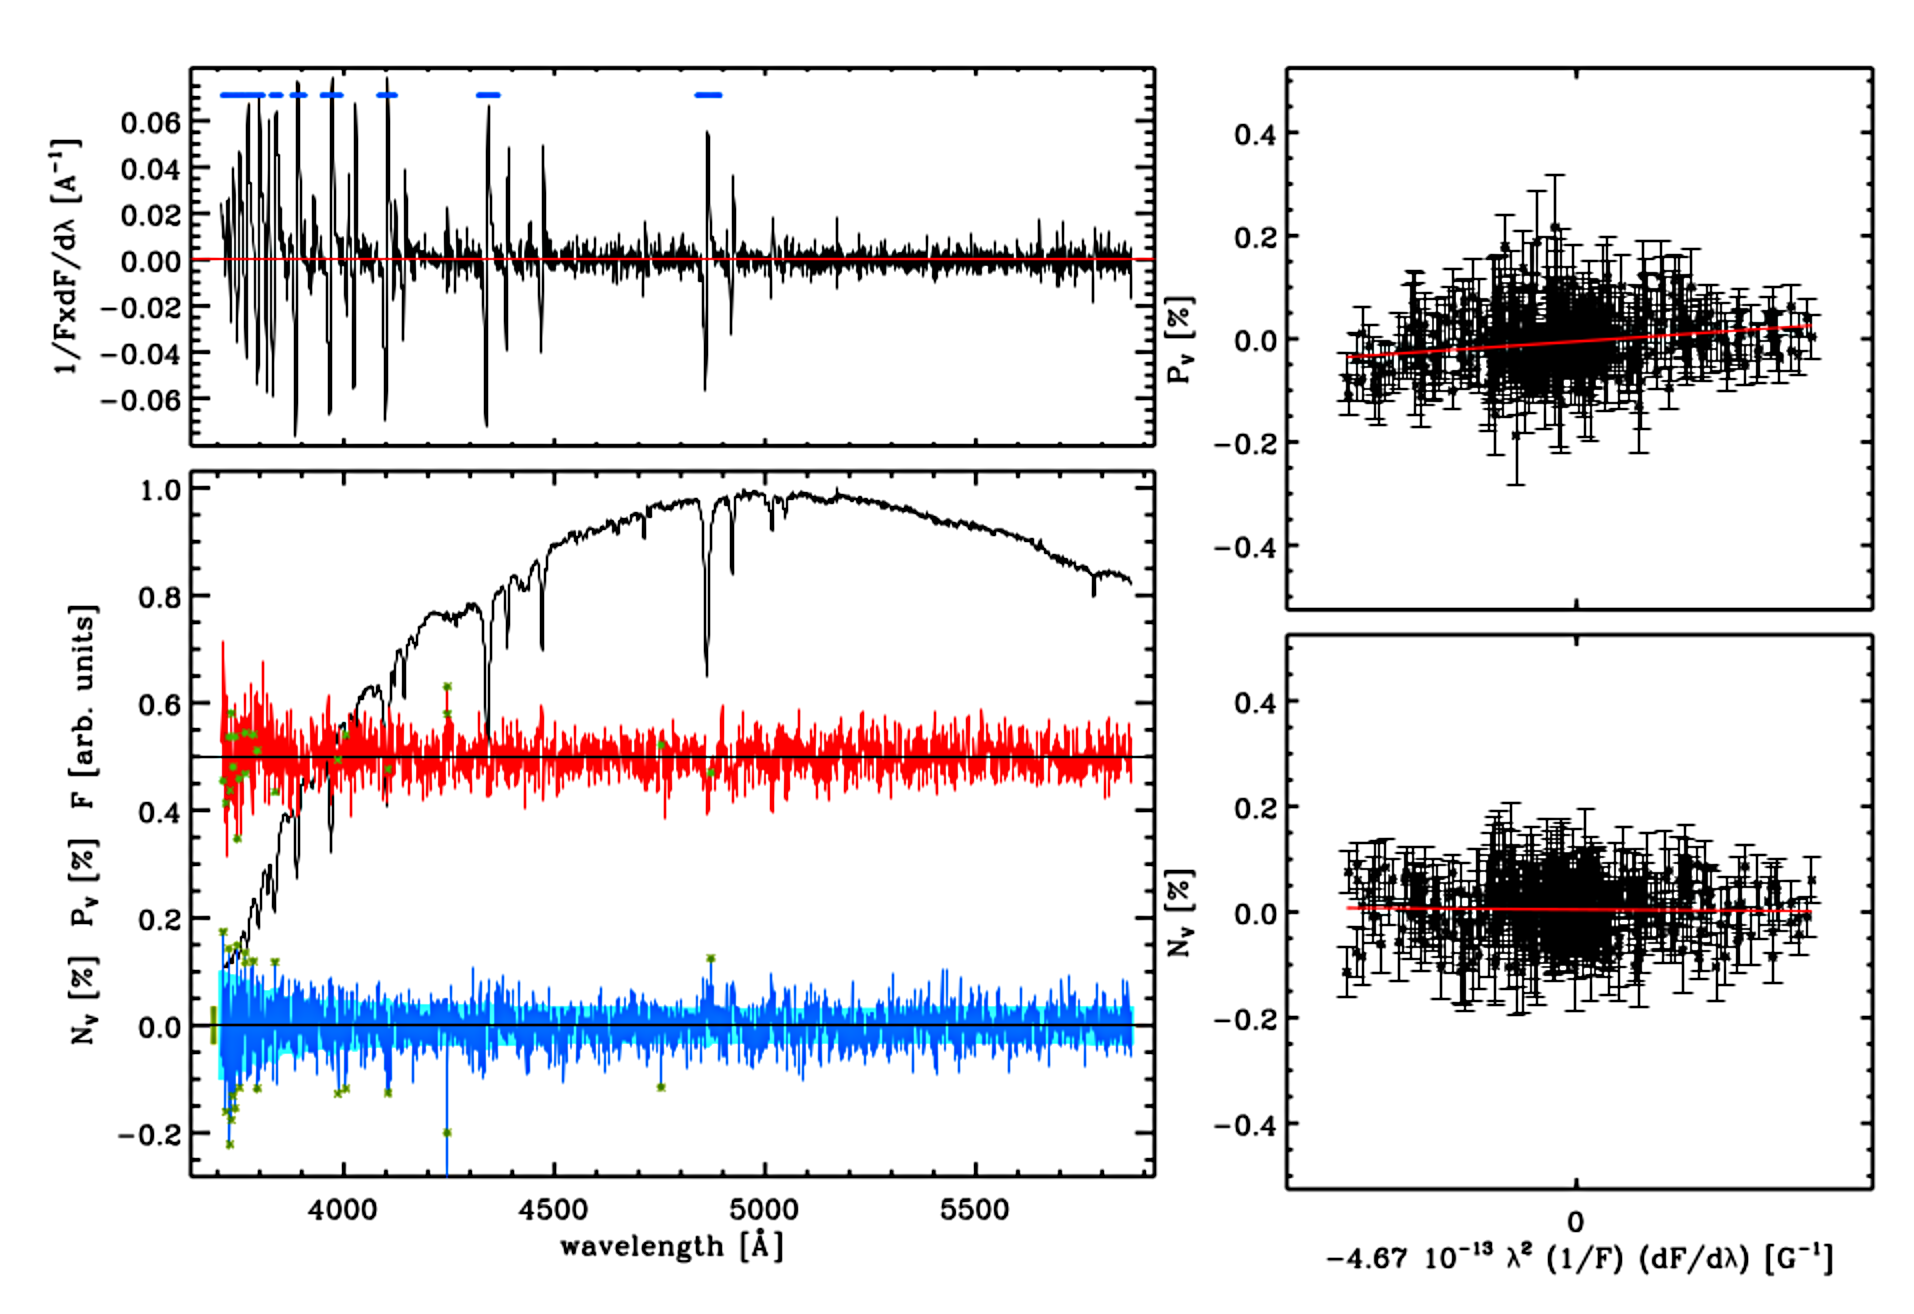
The FORS2 data were reduced and analysed using the pipeline thoroughly described in Fossati et al. (2015), which is based on the algorithms and recommendations given by Bagnulo et al. (2012, 2013). The surface average longitudinal magnetic field B was derived using the method first described in Bagnulo et al. (2002), which is based on extracting the slope of the linear regression of versus the quantity . The quantities and are the Stokes and profiles, respectively, is the effective Landé factor, which was set to 1.25 except for the region of the hydrogen Balmer lines where was set to 1.0 (Bagnulo et al. 2012), and is equal to 4.6710-13 Å-1G-1. We validated the employed effective Landé factor of 1.25 by extracting from the VALD database (Ryabchikova et al. 2015) the information relative to the lines covered by the FORS2 spectrum. We further calculated the diagnosing null profile , and hence N (see Bagnulo et al. 2009). Bagnulo et al. (2012) present a detailed discussion of the physical limitations of this technique. The B and N values were calculated using either the hydrogen lines or the whole spectrum.
Bagnulo et al. (2012) showed that a magnetic field can be considered to be safely detected when B 5 . Table 1 summarizes our results and shows that of the two sets of observations, the one obtained in August 2017 led to a definite magnetic field detection at a significance level . The spectra obtained in July 2017 led to a non-detection of the magnetic field. The reasons of such non-detection are discussed in Sect. 3. The results of the analysis conducted using the hydrogen lines on the second data-set are visually shown in Fig. 1. We consistently found non-detection from the null profile (i.e., N consistent with zero).
| [K] | 220001000 | M [] | 7.70.2 | ||
|---|---|---|---|---|---|
| [cgs] | 4.00.1 | R [] | 7.50.2 | ||
| [] | [Myr] | 8.80.2 | |||
| [] | 7.60.2 | ||||
| [] | 7.40.2 |
We further analysed archival high-resolution (R115000) spectra obtained with the HARPS spectrograph, attached to the ESO 3.6 m telescope in LaSilla, Chile. The star was observed on the 30th of March 2007 when five consecutive spectra were obtained. The spectra have a peak signal-to-noise ratio (S/N) per resolution element of about 300, except for the third spectrum which we discarded because of its significantly lower quality (S/N 90). We retrieved the reduced, not normalised spectra from the ESO archive and, after looking for radial velocity variation, which we did not find, we co-added the four spectra. We finally obtained a spectrum with a peak S/N of about 600.
We derived the stellar atmospheric parameters using a grid of synthetic stellar atmosphere models built using the atmosphere/line formation code fastwind (Santolaya-Rey et al. 1997; Puls et al. 2005; Rivero González et al. 2012). The code takes into account non-local thermo-dynamical equilibrium effects in spherical symmetry with an explicit treatment of the stellar wind. The stellar grid is designed to model late O- and B-type stars with effective temperatures () ranging from 12000 to 34000 K in 1000 K steps and surface gravity () between 2.0 and 4.4 in steps of 0.1 dex. The helium abundance was kept fix to the solar value. Explicit atomic models for H i, He i,ii, N ii,iii, O ii,iii, C ii,iii, Si ii,iii,iv, and Mg ii are included in the determinations of the atmospheric parameters. The other chemical species are treated in an implicit way to account for blanketing/blocking effects.
The analysis is performed in two steps. First several key spectral lines are simultaneously compared with the grid looking for the set of stellar parameters that best reproduces the spectrum following the routines described in Castro et al. (2012) (see also Lefever et al. 2010). In a second step, new synthetic sub-grids are build for the star with chemical abundances spanning 2.00 dex around the cosmic abundance standard in the solar neighborhood (Nieva & Przybilla 2012), in steps of 0.2 dex. The best combination of abundances that reproduces the observations was found through an optimized genetic algorithm. We further inferred the stellar projected rotational velocity through the Fourier transform (FT) + goodness-of-fit (GOF) method applied to the Si iii 4552 line profile using the iacob-broad code (Simón-Díaz & Herrero 2014). We obtain similar using both the Fourier transform (206 km/s) and the GOF (208 km/s) techniques. The large do not allow the GOF to constrain any additional broadening introduced by macro-turbulence. However, the +macro-turbulence degeneration has a secondary role in the stellar atmosphere quantitative analysis since similar profiles will also retrieve a similar match within the synthetic grid of models. The stellar profile seems determined by rotation, and macro-turbulence is not playing any significant role that can be distinguished under the rotation profile. The results of the analysis are listed in Table 2. Although it leads to a slightly worse fit to the data, the code allowed also for a solution with a higher and by 1000 K and 0.1 dex, respectively. A higher and values would lead to a slight increase in the stellar mass and radius and decrease in age, which would then better fit the age of the Oph group. Despite the high data quality, the large abundance uncertainties are due to the difficulty of obtaining a secure normalisation of the spectrum due to the very broad lines. The stellar mass (M), radius (R), luminosity (), and evolutionary age () in Table 2 were derived from comparisons with stellar evolutionary tracks by Brott et al. (2011) using the bonnsai333The BONNSAI web-service is available at www.astro.uni-bonn.de/stars/bonnsai. tool (Schneider et al. 2014, 2017). For these estimations, we employed tracks which account for stellar rotation. We further derived the stellar parameters without considering rotation obtaining results which are within 1 of those listed in Table 2. From the stellar radius and rotation period of 1.2 d, we infer an equatorial rotational velocity of 19025 , which is consistent within 1 with the measured value. This suggests that the star is viewed equator-on, hence the inclination angle of the stellar rotation axis is close to 90∘, rather than 45∘ as inferred in Pillitteri et al. (2017), the difference arising from an assumed radius of 8 R⊙, and based on a rough estimate by van Belle (2012). Following the formalism of Petit et al. (2013), with the stellar parameters listed in Table 2, a rotation period of 1.2 days, and a lower limit on the dipolar magnetic field of 1.5 kG, we derived a Keplerian co-rotation radius of 2.1 stellar radii and a lower limit on the Alfvén radius of 17.6 stellar radii. For these calculations, we further adopted a mass-loss rate of 1.410-10 yr-1 (Krtička 2014) and a terminal velocity of 700 (Prinja 1989; Oskinova et al. 2011). Following the results of Petit et al. (2013), Oph A should host a centrifugal magnetosphere, and the interplay between the stellar magnetic field and rotation rate may be able to sustain a circumstellar disk. At the light of this prediction, we looked for emission in the H line profile, but found no convincing evidence of it.
3 Discussion and conclusions
We have detected magnetism in the B2 star Oph A during one of the two epochs of FORS2 observations. In detail, we estimated that the longitudinal component of the field is about B 80 G. In the other set of observations we do not detect the magnetic field, this does not necessarily implies that the magnetic field is zero. The estimate of the magnetic field are averaged over the full disk of the star and as such it strongly depends on the configuration of the magnetic field and on the rotational phase at which we observe the star. From the variability in X-rays of Oph A, we inferred that a likely value of the stellar rotational period is days (Pillitteri et al. 2017) and that, having measured v km/s from optical spectra, the angle is about . It is likely that the magnetic axis is misaligned with respect to the rotational axis of the star, as commonly found in massive stars. This results in variations of the surface average longitudinal magnetic field B, with a period equal to the rotation period. This would explain why the field was not detected in the first data set. A more specific and systematic monitoring on a time scale of one day is thus needed to measure more precisely the variation of the magnetic field along the stellar rotational phases.
The presence of a magnetic field is in strong agreement with the interpretation of the X-ray light curve of Oph A given in Pillitteri et al. (2017). In particular, an active spot, which is the source of the periodic X-ray brightenings and transits in about 30 ks (8.3 hr), would be created by a strong local magnetic field which average intensity is almost 500 G. Such number is also consistent with the estimate of the minimum magnetic field strength ( G) required to constrain the hot plasma flaring during the second event. The estimate of the magnetic field in the flaring loop was obtained applying the diagnostics of Reale (2007) to the rise and the decay of the temperature and emission measure of flares in stellar coronae. After obtaining ephemeris of the passage of the spot from the X-ray light curve, we checked that during the FORS2 observations the spot was not on view. The interval occurred between the XMM-Newton and FORS2 observations is of order of 500 days. The uncertainty of the ephemeris of the spot is of order of 0.001 days from the X-ray analysis, this uncertainty can result in a transit timing off by about 0.5 day or about in phase. Hence a proper monitoring in optical band and X-rays is needed to better understand any modulation of the magnetic field as a function of the stellar rotation.
Two spotted and magnetic early B stars in the young open cluster of NGC 2264 have been discovered by Fossati et al. (2014), namely HD 47887 and HD 47777. For HD 47887, there is a X-ray detection in Chandra with a flux of erg s-1 cm-2, at a distance of 800 pc this means a X-ray luminosity of erg s-1, which is lower than that observed on average in Oph A. For HD 47777, there are two X-ray detections in two different XMM-Newton observations, both within from the optical position of the star, with X-ray fluxes of erg s-1 cm-2and erg s-1 cm-2, that means X-ray luminosities of erg s-1and erg s-1, respectively. However, Oph A shows the best example of modulated X-ray emission likely due to intrinsic magnetism, with X-ray luminosity varying in the range erg s-1.
To our best knowledge, Oph A offers the first detection of X-ray emission associated with a localized area on the stellar surface of a massive star. Previously, large-amplitude, periodic X-ray emission was reported for some magnetic O type stars, such as Ori C (Gagné et al. 1997) and NGC 1624-2 (Petit et al. 2015). In these large magnetospheres, X-ray variability is likely associated with the axisymmetric distribution of confined stellar wind material. Previous dedicated attempts to detect X-ray variability in B-type stars were not successful. For example, no X-ray variability associated with rotation was detected in the magnetic B-type star Sco (Ignace et al. 2010). It is especially interesting that X-ray observations suggest a flaring activity associated with the magnetic spot. Albeit previously X-ray flares from B-type stars were discussed in the literature (Mullan 2009), Oph A presents an so far a unique case of periodic X-ray activity that might be associated with an active region on the stellar surface. In Pillitteri et al. (2017) we also discuss the hypothesis that a low mass companion is the emitter of X-rays. Such a companion would orbit in 1.2 days and would be partially obscured by the primary. In this case the magnetic field detection would be associated with this object and the strength of the magnetic field would be much higher as the value is an average over the full disk of the primary. The extant optical spectra of Oph A do not present spectral lines associated to such companion. A dedicated spectroscopic monitoring of Oph A is thus needed to detect it (if at all present) from, e.g., RV measurements although the very broad lines of Oph A hamper this search.
Acknowledgements.
IP acknowledges support from INAF, ASI and the ARIEL consortium. LMO acknowledges support by DLR grant 50OR1302 and partial support by the Russian Government Program of Competitive Growth of Kazan Federal University. S.J.W. was supported by NASA contract NAS8-03060 (Chandra X-ray Center)References
- Appenzeller et al. (1998) Appenzeller, I., Fricke, K., Fürtig, W., et al. 1998, The Messenger, 94, 1
- Babel & Montmerle (1997) Babel, J. & Montmerle, T. 1997, ApJ, 485, L29+
- Bagnulo et al. (2013) Bagnulo, S., Fossati, L., Kochukhov, O., & Landstreet, J. D. 2013, A&A, 559, A103
- Bagnulo et al. (2009) Bagnulo, S., Landolfi, M., Landstreet, J. D., et al. 2009, PASP, 121, 993
- Bagnulo et al. (2012) Bagnulo, S., Landstreet, J. D., Fossati, L., & Kochukhov, O. 2012, A&A, 538, A129
- Bagnulo et al. (2002) Bagnulo, S., Szeifert, T., Wade, G. A., Landstreet, J. D., & Mathys, G. 2002, A&A, 389, 191
- Berghoefer et al. (1997) Berghoefer, T. W., Schmitt, J. H. M. M., Danner, R., & Cassinelli, J. P. 1997, A&A, 322, 167
- Brott et al. (2011) Brott, I., de Mink, S. E., Cantiello, M., et al. 2011, A&A, 530, A115
- Castro et al. (2012) Castro, N., Urbaneja, M. A., Herrero, A., et al. 2012, A&A, 542, A79
- Feldmeier et al. (1997a) Feldmeier, A., Kudritzki, R.-P., Palsa, R., Pauldrach, A. W. A., & Puls, J. 1997a, A&A, 320, 899
- Feldmeier et al. (1997b) Feldmeier, A., Puls, J., & Pauldrach, A. W. A. 1997b, A&A, 322, 878
- Fossati et al. (2015) Fossati, L., Castro, N., Schöller, M., et al. 2015, A&A, 582, A45
- Fossati et al. (2014) Fossati, L., Zwintz, K., Castro, N., et al. 2014, A&A, 562, A143
- Gagné et al. (1997) Gagné, M., Caillault, J.-P., Stauffer, J. R., & Linsky, J. L. 1997, ApJ, 478, L87
- Ignace et al. (2010) Ignace, R., Oskinova, L. M., Jardine, M., et al. 2010, ApJ, 721, 1412
- Krtička (2014) Krtička, J. 2014, A&A, 564, A70
- Lefever et al. (2010) Lefever, K., Puls, J., Morel, T., et al. 2010, A&A, 515, A74
- Mullan (2009) Mullan, D. J. 2009, ApJ, 702, 759
- Nazé et al. (2011) Nazé, Y., Broos, P. S., Oskinova, L., et al. 2011, ApJS, 194, 7
- Nieva & Przybilla (2012) Nieva, M.-F. & Przybilla, N. 2012, A&A, 539, A143
- Oskinova (2016) Oskinova, L. M. 2016, Advances in Space Research, 58, 739
- Oskinova et al. (2011) Oskinova, L. M., Todt, H., Ignace, R., et al. 2011, MNRAS, 416, 1456
- Owocki et al. (1988) Owocki, S. P., Castor, J. I., & Rybicki, G. B. 1988, ApJ, 335, 914
- Petit et al. (2015) Petit, V., Cohen, D. H., Wade, G. A., et al. 2015, MNRAS, 453, 3288
- Petit et al. (2013) Petit, V., Owocki, S. P., Wade, G. A., et al. 2013, MNRAS, 429, 398
- Pillitteri et al. (2016a) Pillitteri, I., Wolk, S. J., Chen, H. H., & Goodman, A. 2016a, A&A, 592, A88
- Pillitteri et al. (2014) Pillitteri, I., Wolk, S. J., Goodman, A., & Sciortino, S. 2014, A&A, 567, L4
- Pillitteri et al. (2016b) Pillitteri, I., Wolk, S. J., & Megeath, S. T. 2016b, ApJ, 820, L28
- Pillitteri et al. (2017) Pillitteri, I., Wolk, S. J., Reale, F., & Oskinova, L. 2017, A&A, 602, A92
- Prinja (1989) Prinja, R. K. 1989, MNRAS, 241, 721
- Puls et al. (2005) Puls, J., Urbaneja, M. A., Venero, R., et al. 2005, A&A, 435, 669
- Reale (2007) Reale, F. 2007, A&A, 471, 271
- Rivero González et al. (2012) Rivero González, J. G., Puls, J., Massey, P., & Najarro, F. 2012, A&A, 543, A95
- Ryabchikova et al. (2015) Ryabchikova, T., Piskunov, N., Kurucz, R. L., et al. 2015, Phys. Scr, 90, 054005
- Santolaya-Rey et al. (1997) Santolaya-Rey, A. E., Puls, J., & Herrero, A. 1997, A&A, 323, 488
- Schneider et al. (2017) Schneider, F. R. N., Castro, N., Fossati, L., Langer, N., & de Koter, A. 2017, A&A, 598, A60
- Schneider et al. (2014) Schneider, F. R. N., Langer, N., de Koter, A., et al. 2014, A&A, 570, A66
- Simón-Díaz & Herrero (2014) Simón-Díaz, S. & Herrero, A. 2014, A&A, 562, A135
- Stevens et al. (1992) Stevens, I. R., Blondin, J. M., & Pollock, A. M. T. 1992, ApJ, 386, 265
- ud-Doula & Owocki (2002) ud-Doula, A. & Owocki, S. P. 2002, ApJ, 576, 413
- van Belle (2012) van Belle, G. T. 2012, A&A Rev., 20, 51
- Wolk et al. (2011) Wolk, S. J., Broos, P. S., Getman, K. V., et al. 2011, ApJS, 194, 12