First Principles Phase Diagram Calculation for the 2D TMD system .
Abstract
First principles phase diagram calculations, that included van der Waals interactions, were performed for the bulk transition metal dichalcogenide system . To obtain a converged phase diagram, a series of cluster expansion calculations were performed with increasing numbers of structure-energies, () up to , used to fit the cluster expansion Hamiltonian. All calculated formation energies are positive and all ground-state analyses predict that formation energies for supercells with 16 or fewer anion sites are positive; but when , false ordered ground-states are predicted. With , only a miscibility gap is predicted, but one with dramatic asymmetry opposite to what one expects from size-effect considerations; i.e. the calculations predict more solubility on the small-ion S-rich side of the diagram and less on the large-ion Te-rich side. This occurs because S-rich low-energy metastable ordered configurations have lower energies than their Te-rich counterparts.
keywords:
; First Principles; Phase diagram calculation; van der Waals; transition metal dichalcogenide, TMD.1 Introduction
There is great interest in two-dimensional (2D) transition metal dichalcogenide (TMD) materials , where M = Mo, W, Nb, Re, etc. and X = S, Se, or Te. [1, 2]. Currently, interest is focused on applications such as: band-gap engineering [3, 4]; nano-electronic devices [2, 5, 6, 7]; photovoltaic devices [8, 9]; valleytronics applications [10, 11]; 2D building blocks for electronic heterostructures [12]; and as sensors [13].
The bulk 2H crystal structure ( space group) has AB-stacking of three-atom-thick 2D-layers that are bonded by van der Waals forces. Hence van der Waals forces influence bulk and multilayer phase relations and therefore anion order-disorder and/or phase separation in TMD solid solutions. The results presented below, for bulk , imply that van der Waals interactions may strongly affect phase stabilities, either between adjacent layers in bulk or few-layer samples, or between monolayers and substrates.
Previous work on bulk [14] predicted two entropy stabilized incommensurate phases at , and this work was done to see if a similar prediction applies to the structurally analogous system. In the system, however, only a miscibility gap is predicted, but a very large number of formation energy calculations, , is required to suppress false ground-states (GS). Also, the asymmetry of the calculated phase diagram is the opposite of what one expects from a size-effect argument; typically there is more solubility of the smaller ion in larger-ion-rich solutions (more S-solubility in Te-rich solutions) than vice versa; =1.84 Å; =2.21 Å). [15]
2 Methodology
2.1 Total Energy Calculations
Total structure energies, were calculated for fully relaxed , and for 433 Wm+n(SmTen)2 supercells. The Vienna simulation program (VASP, version 5.3.3 [16, 17]) was used for all density-functional theory (DFT) calculations, with projector augmented waves (PAW) and a generalized gradient approximation (GGA) for exchange energies. Electronic degrees of freedom were optimized with a conjugate gradient algorithm. Valence electron configurations were: W_pv; S_; Te_. Van der Waals interactions modeled with the non-local correlation functional of Klimes [18] A 500 eV cutoff-energy was used in the ”high precision” option, which converges absolute energies to within a few meV/mol (a few tenths of a kJ/mol of exchangeable S- and Te-anions). Precision is at least an order of magnitude better. Residual forces of order 0.02 eV or less were typical.
2.2 The Cluster Expansion Hamiltonian
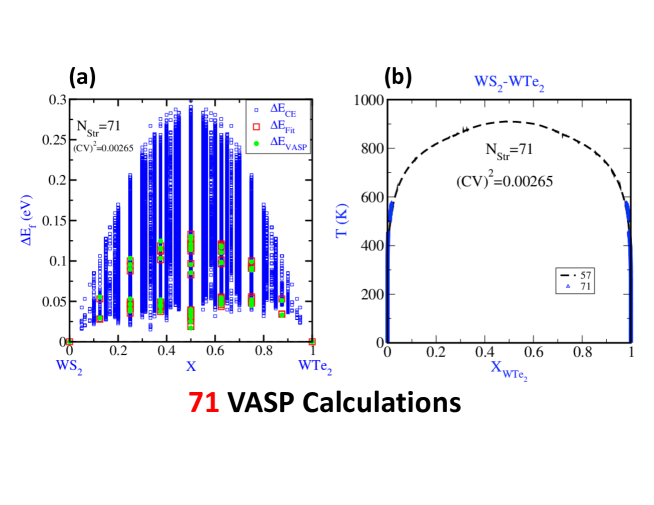
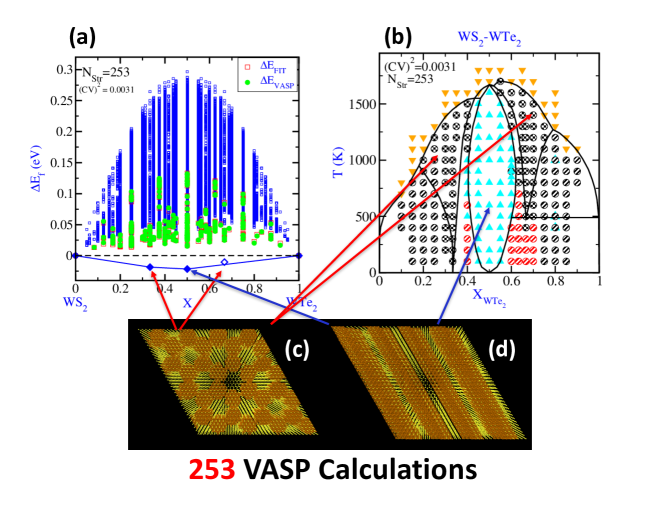
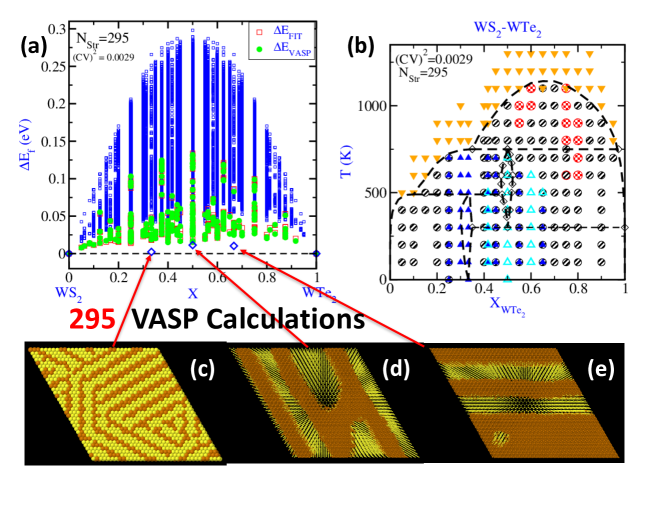
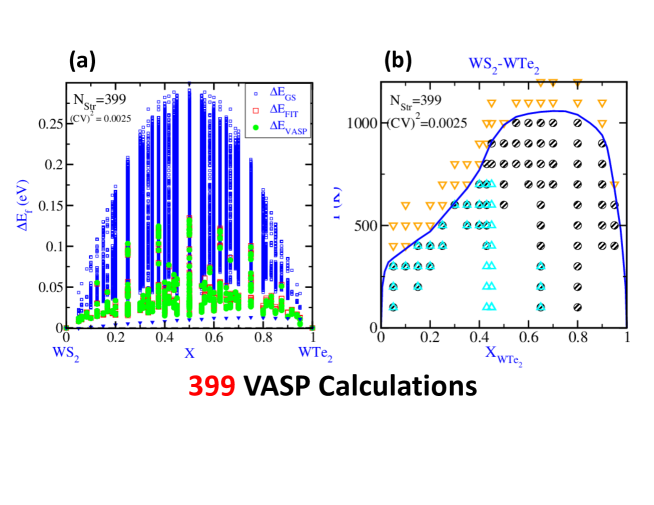
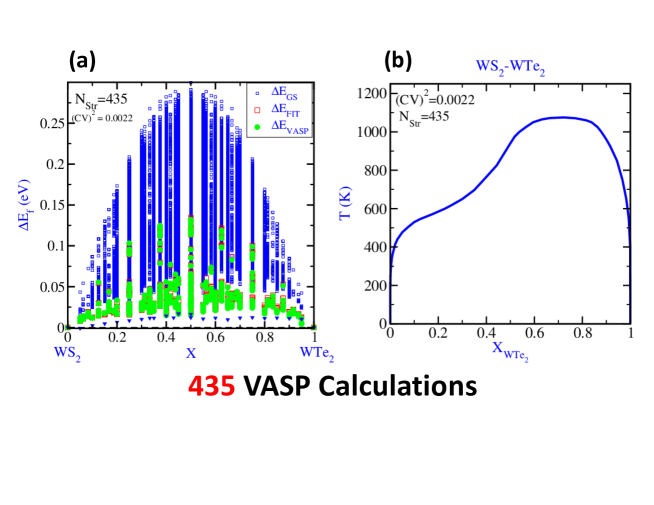
Cluster expansion Hamiltonians (CEH) [19], were fit to sets of 71, 253, 295, 399, and 435 formation energies, , solid dots (green online) in Figs. 1a-5a:
| (1) |
Here: is the total energy of the Wm+n(SmTen)2 supercell; is the energy/mol of WS2; is the energy/mol of WTe2.
3 Results
3.1 Ground-State Analyses
Filled circles (green online) in Figs. 1a - 5a indicate values of that were calculated with the VASP package, i.e. . Large open squares in Figs. 1a - - 5a (red online) indicate the CEH-fit to . Smaller open squares (; blue online) indicate the results of a ground-state (GS) analyses that included all ordered configurations with 16 or fewer anion sites, 151,023 structures. Calculated values for cross validation scores, (CV)2, and the numbers of structures, , are plotted on the figures.
Additional GS analyses were performed by Monte-Carlo (MC) simulations at fixed bulk compositions, via decreasing temperature (T) scans down to T=0. The 0K values from these calculations are plotted as solid- (predicted stable) or open-diamonds (metastable; blue online) in Figs. 2a and 3a; and as small filled down-facing triangles (blue online) in Figs. 4a and 5a. Because the calculated formation energies for the ordered configurations in Figs. 2a and 3a are negative, they constitute (falsely) predicted large-cell ordered-GS. If their formation energies are positive they can be regarded as low-energy microstructures. Note that these formation energies from MC-simulations are always upper bounds, because MC-simulations don’t yield ordered simulation boxes.
3.2 Phase Diagram Calculations
First principles phase diagram calculations that were performed with the ATAT package [20, 21, 22] are plotted in Figs. 1b-5b. Additional symbols on Figs. 2b, 3b, and 4b are used to indicate various phase fields that were identified, by visual inspections of MC-snapshots: large filled down-pointing triangles (orange online) indicate disorder; up-pointing triangles (cyan online) indicate a layer structure (e.g. Fig. 2d); large checkered circles (red online) indicate a honeycomb structure (Fig. 2c); and striped circles (black and red online) indicate two-phase, assemblages, ordered plus disordered or two ordered phases.
4 Discussion
One expects that fitting CEHs to larger and larger sets of ultimately leads to a converged result for the calculated phase diagram. The results presented here indicate that the fits with = 71, 253, 295, and 376 (not shown) are not sufficient because: false GS are predicted, typically at and ; and qualitatively different phase diagrams are predicted with each increase in . Standard ground-state analyses for the sets with = 253, 295, and 376 (not shown) predicted no ordered GS with 16 or fewer anion sites, but MC T-scans down to T=0K, predicted false GS based on unit cells with more than 16 anion sites. The diagrams for = 399 or 435 are essentially identical, and may represent a converged result. One can, however, never rule out the possibility that a fit based on , might yield a different result.
Two generalizations apply to all calculated phase diagrams for models with : (1) When false GS are predicted, they are always in the S-rich bulk composition range ; (2) The range range is dominated by phase separation at T. (1) above indicates that low-energy ordered configurations on the S-rich side of the system drive the asymmetry of phase separation that is noted in (2).
5 Conclusions
A CEH-fit to at least is required to calculate a realistic phase diagram for the TMD system. Low cross-validation scores, and routine GS analyses are not sufficient for systems such as TMDs because very low-energy metastable ordered states imply that an apparently well-fit CEH can predict false GS phases. It is likely that the system has a highly asymmetric miscibility gap as shown in Fig. 5, and that the predicted asymmetry is driven by low-energy metastable ordered states on the S-rich side of the system.
6 ACKNOWLEDGEMENTS
This work was supported by NIST-MGI.
References
- [1] Q.H. Wang, K. Kalantar-Zadeh, A. Kis, J.N. Coleman and M.S. Strano, Nature Nanotech. 7, 699 (2012).
- [2] R. Ganatra and Q. Zhang ACS nano 8(5), 4074 (2014).
- [3] J. Kang, S. Tongay, J. Li and J. Wu, J. Appl. Phys. 113, 143703 (2013).
- [4] A. Kutana, E. S. Penev and B. I. Yakobson, Nanoscale 6, 5820 (2014).
- [5] B. Radisavljevic, A. Radenovic, J. Brivio, V. Giacometti, and A. Kis. Nature nanotechnology, 6(3): 147, (2011).
- [6] S. Das, H.-Y. Chen, A. V. Penumatcha, and J. Appenzeller. Nano Letters, 13(1): 100, (2013).
- [7] H. Wang, L. Yu, Y.-H. Lee, Y. Shi, A. Hsu, M. L. Chin, L.-J. Li, M. Dubey, J. Kong, and T. Palacios. Nano Letters, 12(9):4674, (2012).
- [8] D. Jariwala, V. K. Sangwan, L.J. Lauhon, T. J. Marks, and M. C. Hersam. ACS nano, 8(2): 1102, (2014).
- [9] M. Fontana, T. Deppe, A. K. Boyd, M. Rinzan, A. Y. Liu, M. Paranjape, and P. Barbara. Scientific reports, 3, 1634 (2013).
- [10] H. Zeng, J. Dai, W. Yao, D. Xiao, and X. Cui. Nature nanotechnology, 7(8): 490, (2012).
- [11] K. F. Mak, K. He, J. Shan, and T. F. Heinz. Nature nanotechnology, 7(8): 494, (2012).
- [12] Nature, 499, 419 (2013).
- [13] S.X. Wu, Z.Y. Zeng, Q.Y. He, Z.J. Wang, S.J. Wang, Y.P. Du, et al. Small, 8, 2264 (2012) T.Y. Wang, H.C. Zhu, J.Q. Zhuo, Z.W. Zhu, P. Papakonstantinou, G. Lubarsky, et al. Anal. Chem, 85, 10289 (2013).
- [14] B. P. Burton and A. K. Singh J. Appl. Phys. 120, 155101 (2016); http://dx.doi.org/10.1063/1.4964868
- [15] http://abulafia.mt.ic.ac.uk/shannon/ptable.php
- [16] G. Kresse, and J. Hafner, Phys. Rev. B47: 558 (1993); G. Kresse. Thesis, Technische Universität Wien (1993); Phys. Rev. B49: 14 251 (1994). G. Kresse, and J. Furthmüller, (1996) Comput. Mat. Sci. 6: 15-50; Phys. Rev. B54: 11169 (1996); cf. http://tph.tuwien.ac.at/ vasp/guide/vasp.html.
- [17] Reference to specific software packages does not imply a NIST endorsement.
- [18] J. Klimes, D. R. Bowler, and A. Michaelides, Phys. Rev. B83: 195131 (2011). and J. Phys. Condens. Matter 22: 022201 (2010).
- [19] J.M. Sanchez, F. Ducastelle, and D. Gratias, Physica 128A, 334 (1984).
- [20] A. van de Walle, M. Asta and G. Ceder, CALPHAD Journal 26, 539 (2002).
- [21] A. van de Walle and G. Ceder, Journal of Phase Equilibria, 23, 348 (2002).
- [22] A. van de Walle, and M. Asta, Modelling Simul. Mater. Sci. Eng., 10, 521 (2002).