Discovery of molecular and atomic clouds associated with the gamma-ray supernova remnant Kesteven 79
Abstract
We carried out 12CO( = 1–0) observations of the Galactic gamma-ray supernova remnant (SNR) Kesteven 79 using the Nobeyama Radio Observatory 45 m radio telescope, which has an angular resolution of arcsec. We identified molecular and atomic gas interacting with Kesteven 79 whose radial velocity is km s-1. The interacting molecular and atomic gases show good spatial correspondence with the X-ray and radio shells, which have an expanding motion with an expanding velocity of km s-1. The molecular gas associated with the radio and X-ray peaks also exhibits a high-intensity ratio of CO 3–2/1–0 0.8, suggesting a kinematic temperature of K, owing to heating by the supernova shock. We determined the kinematic distance to the SNR to be kpc and the radius of the SNR to be pc. The average interstellar proton density inside of the SNR is cm-3, of which atomic protons comprise only . Assuming a hadronic origin for the gamma-ray emission, the total cosmic-ray proton energy above 1 GeV is estimated to be erg.
1 Introduction
It has been a longstanding matter of debate as to how cosmic-ray (CR) protons, which are the major components of CRs, are accelerated in the Galaxy. Supernova remnants (SNRs) are the most likely candidates for the acceleration sites of Galactic CRs, the energies of which extend up to eV, the so-called “knee” energy (e.g., Ginzburg & Syrovatskii, 1964; Hayakawa, 1952). Theoretical studies have predicted that CRs can be efficiently accelerated in SNR shockwaves via diffusive shock acceleration (DSA; e.g., Bell, 1978; Blandford & Ostriker, 1978). However, the principal acceleration sites of CR protons still remain elusive because of the paucity of observational evidence.
Gamma-ray bright SNRs hold a key to understanding the origin of CRs. Gamma-rays from SNRs are generally produced by CR protons and electrons through the hadronic or leptonic processes. In hadronic process, interactions between CR protons and interstellar protons create a neutral pion which decays into two gamma-ray photons. On the other hand, CR electrons energize interstellar low-energy photon into gamma-ray via the inverse Compton effect. Moreover, leptonic gamma-rays can be also produced by the non-thermal Bremsstrahlung of CR electrons. In general, it is very difficult to distinguish the hadronic and leptonic processes by the spectral modeling alone (e.g., Inoue et al., 2012).
Recently, investigations of the interstellar medium associated with gamma-ray SNRs have received much attention as a tool for understanding the origins of CRs. Fukui et al. (2012) demonstrated good spatial correspondence between the total column density of interstellar protons (both atomic and molecular components) and TeV gamma rays in the young ( yr) SNR RX J1713.73946. This provides one of the essential conditions for generating hadronic gamma rays via neutral pion decay associated with proton-proton interactions. On the basis of an estimated mean interstellar proton density of cm-3, they concluded that CR protons are accelerated in the SNR and that the total energy in CRs is erg, which corresponds to of the total erg kinematic energy released in the supernova explosion. Subsequent studies showed similar results for other young TeV gamma-ray SNRs (e.g., HESS J1731347, Fukuda et al. 2014; Vela Jr., Fukui et al. 2017). On the other hand, middle aged SNRs ( yr), which are bright in GeV gamma rays, have a total CR proton energy of the order of – erg, based on a mean interstellar proton density of a few hundred to less than 1,000 cm-3 (e.g., W44, Yoshiike et al. 2013). To better understand the origin of CR protons and their energies, we need to have a larger sample of hadronic gamma rays from the SNRs.
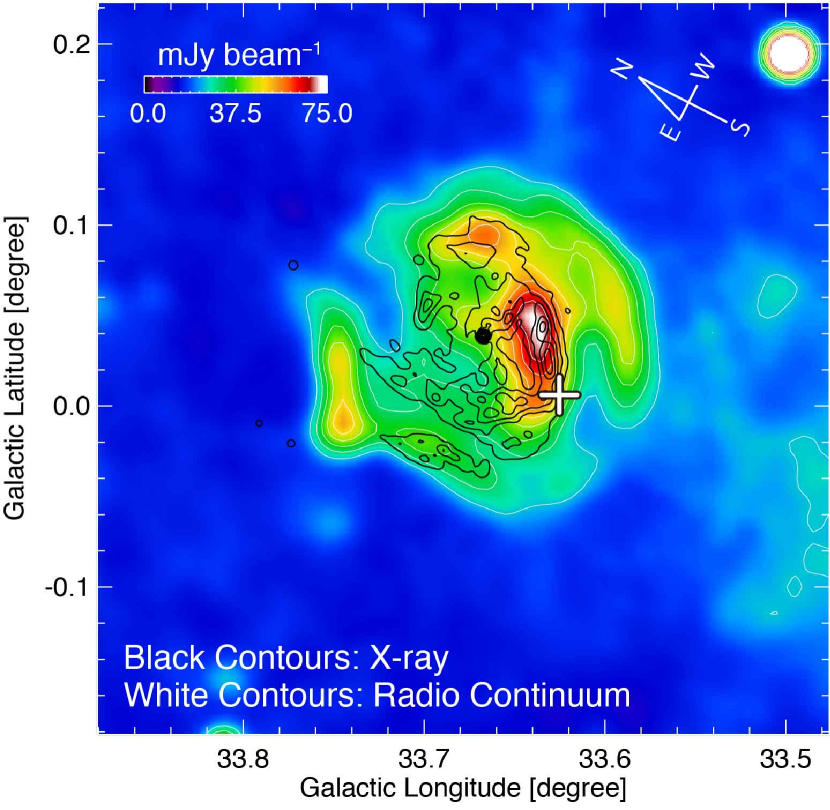
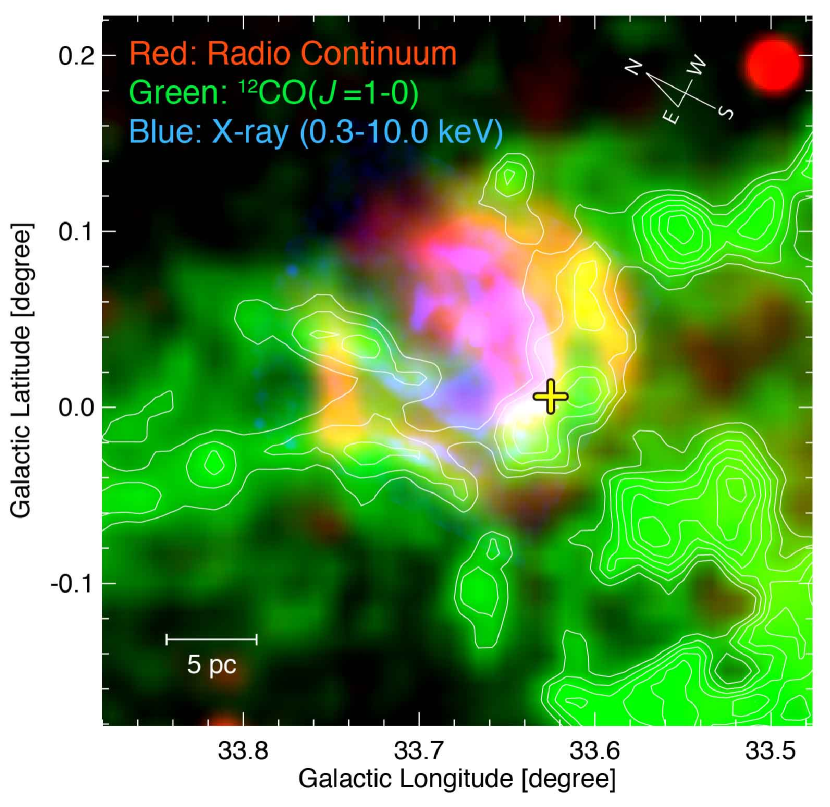
Kesteven 79 (hereafter Kes 79; also known as G33.60.1, 4C00.70, or HC13) is a Galactic SNR located at (, ) (336, 01). It has been well studied at radio continuum and thermal X-ray wavelengths (Caswell et al., 1975, 1981; Dickel & Denoyer, 1975; Becker & Kundu, 1975; Angerhofer et al., 1977; Frail & Clifton, 1989; Velusamy et al., 1991; Kassim, 1992; Seward & Velusamy, 1995; Tsunemi & Enoguchi, 2002; Sun et al., 2004; Giacani et al., 2009; Auchettl et al., 2014; Sato et al., 2016; Zhou et al., 2016). Figure 1 shows the Very Large Array (VLA) radio-continuum image superposed on X-ray contours for the energy band 0.3–10.0 keV. The X-ray emission is bright inside the radio-continuum shell, which has a diameter of arcmin, indicating that it is a mixed-morphology SNR, according to Rho & Petre (1998). The radio-continuum shell appears to consist of two incomplete, concentric shells (e.g., Velusamy et al., 1991). Sun et al. (2004) found that the multiple filaments and the “protrusion” in thermal X-rays obtained by show good spatial correspondence with the radio-continuum shell (e.g., Giacani et al., 2009). Sato et al. (2016) presented the most reliable X-ray spectroscopy for Kes 79 using with a low and stable non-X-ray background and a good spectroscopic resolution. They discovered that the X-rays from this SNR are consistent with a two-temperature model: a collisional ionization equilibrium (CIE) plasma (with keV) and a non-equilibrium ionized (NEI) plasma (with keV). The abundance ratios and the mass of the ejecta are consistent with a core-collapse SNR originating from a progenitor of mass –40 . The dynamical age of Kes 79 was also estimated to be yr, assuming a distance of kpc and the Sedov self-similar solution (Sedov, 1959).
Kes 79 is also known to be associated with a dense molecular cloud. Green & Dewdney (1992) used the 12CO( = 1–0) and HCO+( = 1–0) emission lines obtained with the National Radio Astronomy Observatory 12 m radio telescope to show that a dense molecular cloud with km s-1 exhibits good spatial correspondence with the radio shell of Kes 79. They claimed that the SNR shockwaves interact with this molecular cloud, the kinematic distance to which is kpc. Subsequently, Zhou et al. (2016) confirmed this using the CO( = 1–0, 2–1, 3–2) emission lines obtained with the 13.7 m millimeter-wavelength telescope of the Purple Mountain Observatory, Kölner Observatory for Submillimeter Astronomy, and archival datasets of the James Clerk Maxwell Telescope (JCMT). They found a broad molecular line spanning a velocity range of 20 km s-1 toward the eastern X-ray/radio filaments, indicating that the occurrence of shock-interactions. Kilpatrick et al. (2016) also pointed out a broad molecular line using 12CO( = 2–1) data from the 10 m Submillimeter Telescope. These previous studies showed that the shock-cloud interaction is a feasible scenario to understand qualitatively the physical association between the SNR shells and the associated ISM. To obtain a conclusive piece of evidence for the shock-cloud interaction, we need more detailed quantitative studies of the interstellar medium toward SNRs as follows: (1) shock-excited OH masers (e.g., W44 and W28, Goss, 1968), (2) interstellar expanding shells created by SNR shockwaves and/or stellar winds from the progenitor of the supernova explosion (e.g., RX J1713.73946, Fukui et al. 2012; RCW 86, Sano et al. 2017), or (3) high-temperature gas from more intensive shock heating (e.g., W44 and IC443, Seta et al., 1998). For Kes 79, such detailed studies using CO/Hi datasets are needed to clarify the velocity ranges of interstellar gas associated with the SNR.
Investigating the interstellar gas associated with the SNR Kes 79 is also important for understanding the origin of CR protons. Recently, Auchettl et al. (2014) discovered a GeV gamma-ray excess in the direction of Kes 79 by using the Large Area Telescope (LAT). The region of gamma-ray excess is consistent with the position of the molecular cloud thought to be associated with the SNR (see yellow cross in Figure 1). The gamma-ray spectral index is well described by hadronic scenario, whereas lepton dominant scenarios failed to explain the gamma-ray spectrum with realistic parameters. In addition, there is no evidence in favor of strong gamma-ray contribution from a pulsar wind nebula (Auchettl et al., 2014). Furthermore, Sato et al. (2016) discovered a K-shell line of Fe at 6.4 keV toward the east of Kes 79. They suggest that this line originates from neutral Fe in the molecular cloud within which the SNR is embedded, which is ionized by locally accelerated CR protons with energies of the order of MeV.
In the present paper, we aim to identify the interstellar molecular and atomic gas associated with Kes 79 to determine the CR proton energies in the SNR using new CO( = 1–0) datasets obtained with the Nobeyama Radio Observatory (NRO) 45 m telescope using new receiver named the FOur-beam REceiver System on the 45 m Telescope (FOREST; Minamidani et al., 2016) and from archived Hi/CO datasets. This paper is organized as follows. In Section 2, we describe the CO, X-ray, Hi, and radio-continuum datasets. Section 3 consists of four subsections: Subsection 3.1 gives the distributions of CO, X-rays, and the radio continuum in the direction of Kes 79; Subsection 3.2 gives the expanding shell structures of CO and Hi; Subsection 3.3 presents the maps of the CO = 3–2/1–0 intensity ratio; and Subsection 3.4 gives the physical conditions in the molecular cloud. The discussion and summary are given in Sections 4 and 5, respectively.
2 OBSERVATIONS AND DATA REDUCTION
2.1 CO
We performed 12CO( = 1–0) observations with the NRO 45 m telescope as part of the FOREST Unbiased Galactic Plane Imaging survey with Nobeyama 45 m telescope (FUGIN; Umemoto et al., 2017). The survey was carried out from 2014 to 2017 using the on-the-fly mapping mode (Sawada et al., 2008). It covered a Galactic longitude range from 10∘ to 50∘ and a Galactic latitude range of within in the inner region of our Galaxy. Observations of Kes 79 were conducted in June 2016. The frontend was FOREST, which includes the four beams with dual polarizations, and a two-sideband superconductor-insulator-superconductor receiver (Minamidani et al., 2016). The effective spatial resolution was 20 arcsec, at a frequency of 115 GHz. The typical system temperature was K at 70 deg, including the atmosphere. The spectrometer was equipped with the Spectral Analysis Machine for the 45 m telescope (SAM45; Kuno et al., 2011; Kamazaki et al., 2012), which processes 16 intermediate frequency (IF) signals and outputs 4,096 channels per IF, each of 1 GHz bandwidth. The velocity and frequency resolutions were 1.3 km s-1 ch-1 and 244.14 kHz, respectively. The pointing accuracy was checked every hour by observing SiO maser sources and we achieved the pointing error within arcsec. The main beam efficiency of 0.43 0.02 was applied to convert from the antenna temperature to the brightness temperature . We observed standard sources W51 [ = , = ] (Green, 2014) and Orion KL [ = , = ] (Kraemer et al., 2003) to verify the performance of the telescope. The map we use in this paper covers the region of = 33∘–34∘ and (1), and we reprocessed the data using the NOSTAR software provided by the NRO. The final dataset was smoothed to a pixel size of 30 arcsec, with a typical rms noise level of K at a velocity resolution of 1 km s-1.
To measure the intensity ratio of 12CO = 3–2/1–0, we also used the 12CO( = 3–2) data from the CO High-Resolution Survey (COHRS; Dempsey et al., 2013) obtained with the JCMT. We smoothed the data to a spatial resolution of 20 arcsec, and a velocity resolution of 1 km s-1. We applied the main beam efficiency of 0.61 to convert from the antenna temperature to the brightness temperature . The final rms noise level was K, at a velocity resolution of 1 km s-1.
2.2 Hi
The Hi and 21 cm radio-continuum data are from the VLA Galactic Plane Survey (VGPS; Stil et al., 2006). The spatial and velocity resolutions for Hi are arcmin and km s-1, respectively, and the rms noise is 2 K ch-1. The continuum image without Hi lines has a spatial resolution of 1 arcmin and a typical rms noise level of K.
2.3 X-rays
We used X-ray data taken with from July to August 2001, for which the observation ID is 1982 (PI: Seward, Sun et al., 2004). We used the CIAO software version 4.8.1 with CALDB version 4.7.1 for data reduction and imaging analysis (Fruscione et al., 2006). The dataset was reprocessed using the script “chandra repro.” Combined, energy-filtered, exposure-corrected, and binned images were produced using the scripts “fluximage” and “dmcopy” specifying the energy-band of 0.3–10.0 keV. The total exposure time and effective exposure time were 29.95 and 29.27 ks, respectively.
3 RESULTS
3.1 Overview of CO, X-ray, and radio-continuum distributions
First, we searched for a good spatial correspondence between the X-ray/radio-continuum and CO/Hi intensities over the velocity range from to 120 km s-1 to identify which interstellar gases are associated with the SNR. The method has been applied in several previous investigations (e.g., Moriguchi et al., 2005; Fukui et al., 2012; Sano et al., 2017). We found possible counterparts to the interstellar molecular and atomic gas to lie in the velocity ranges of = 30.5–39.5 km s-1 (hereafter referred to as the “30 km s-1 cloud”), = 82.5–86.5 km s-1 (hereafter referred to as the “80 km s-1 cloud”), and = 99.5–112.5 km s-1 (hereafter referred to as the “100 km s-1 cloud”).
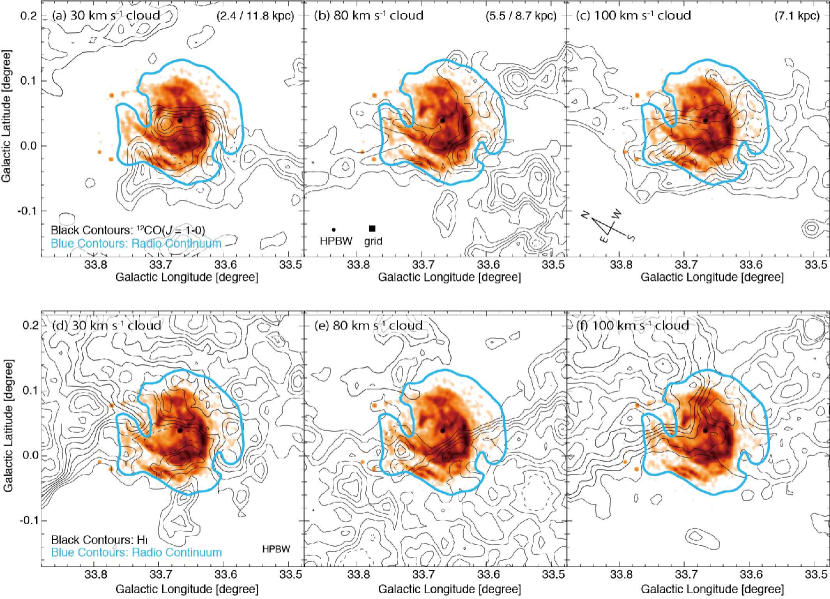
Figures 2a, 2b, and 2c show the 12CO( = 1–0) intensity contours of the 30, 80, and 100 km s-1 clouds superposed on the X-ray image and the radio-continuum boundaries. In Figure 2a, the 30 km s-1 cloud has a shell-like structure near Kes 79. The molecular cloud appears along the X-ray shell and the radio continuum boundary from east to south. By contrast, the northwestern CO cloud lies only across the center of Kes 79, and has no significant spatial correspondence with the X-ray shell. Furthermore, there is no counterpart to the molecular cloud toward the western shells of the X-ray and radio continuum. The kinematic distance to the 30 km s-1 cloud was estimated to be 2.4 kpc (near side) and 11.8 kpc (far side) by adopting the Galactic rotation curve model of Brand & Blitz (1993).
In Figure 2b, the overall distribution of the 80 km s-1 cloud tends to encircle the X-ray shell-like structure. In particular, the southern rim of X-rays show a good spatial anti-correlation with the CO peaks at (, ) (3364, ) and (3361, 001). In addition, two CO filamentary structures at (, ) (3364, ) and (3361, 001) are situated along the outer rims of the X-ray double-shell-like structures. The 80 km s-1 cloud is also embedded along the radio-continuum boundary. The kinematic distance of the 80 km s-1 cloud was estimated to be 5.5 kpc (near side) or 8.7 kpc (far side).
In Figure 2c, the 100 km s-1 cloud has a strong CO peak located at (, ) (3373, ), which corresponds to the region with the X-ray double-shell-like structures mentioned above. The CO cloud is also embedded along with the X-ray and radio boundaries from northeast to southwest. The 100 km s-1 cloud has been considered to be associated with the SNR Kes 79 (Green & Dewdney, 1992; Zhou et al., 2016), and the kinematic distance is 7.1 kpc. We note that the CO intensity of the 100 km s-1 cloud is 3–4 times larger than that of the 30 and 80 km s-1 clouds, indicating that the 30 and 80 km s-1 clouds are more diffuse than the 100 km s-1 cloud.
Figures 2d, 2e, and 2f show the same images as in Figures 2a, 2b, and 2c, but with the black contours now indicating the Hi intensities for each velocity component. For the 30 km s-1 cloud, a shell-like structure of Hi agrees well with the X-ray shell. For the 80 km s-1 cloud, the south and northeast parts of the Hi distribution are nicely associated with the X-ray filaments, whereas the western part of the X-ray shell has no Hi counterpart. For the 100 km s-1 cloud, the Hi surrounds with only the northwestern part of the X-ray shell, which is complementary in spatial coverage to the CO distribution (see also Figure 2c).
3.2 Expanding shell structures of CO and Hi
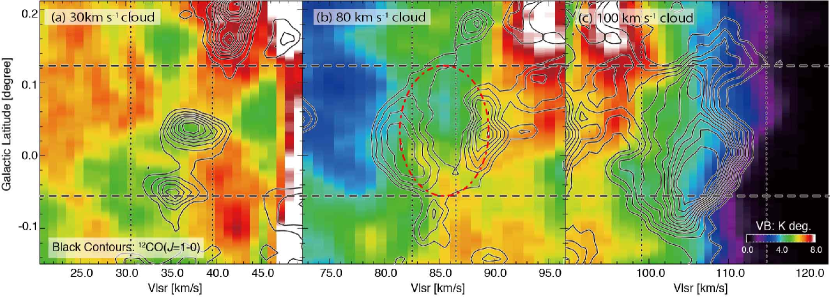
Figures 3a, 3b, and 3c show the velocity-vs.-Galactic latitude diagrams for CO and Hi toward the 30, 80, and 100 km s-1 clouds, respectively. The horizontal dashed lines indicate the apparent diameter of the radio continuum-boundary shown in Figure 2. The 30 and 100 km s-1 clouds have no common structures in CO and Hi. In contrast, the 80 km s-1 cloud shows a cavity-like structure, with intensity peaks at velocities of and km s-1. The size of this cavity in Galactic latitude is roughly consistent with that of the radio-continuum boundary (diameter arcmin); hence, this cavity is probable evidence for expanding gas motions, with an expansion velocity of km s-1.
3.3 CO 3–2/1–0 ratio maps
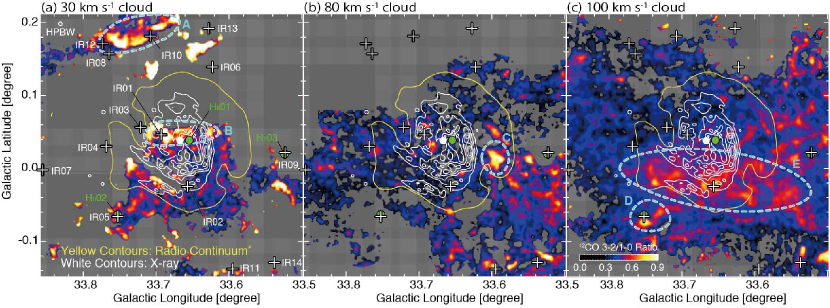
Figures 4a, 4b, and 4c show the intensity ratio 12CO = 3–2/1–0 (hereafter ) toward the 30, 80, and 100 km s-1 clouds, respectively. We find five prominent regions A–E with high intensity ratios of . Regions with are seen toward both the 30 km s-1 (regions A and B) and 80 km s-1 cloud (region C), and regions B and C are located within the radio shell boundary of the SNR. On the other hand, the 100 km s-1 cloud has a region with elongated from the northeast to south of the SNR shell, with a size of 0.25 degrees. We also note that regions A, B, D, and E contain Hii regions or IRAS point sources (see Table 1), indicating the existence of stellar heating.
3.4 Large velocity gradient analysis
We focus here on region C, which has no counterpart among the extra heating sources except for the SNR shockwaves. To investigate the physical properties of the molecular cloud in region C (hereafter referred to as “cloud C”), we preformed a large velocity gradient (LVG, e.g., Goldreich & Kwan, 1974; Scoville & Solomon, 1974) analysis. This model calculates the radiative transfer of molecular emission lines assuming a spherically symmetric cloud with a uniform photon escape probability and radial velocity gradient of , where is the half-width half maximum of CO line width and is the radius of cloud C. We adopt = 1.2 km s-1 / 1.2 pc km s-1 pc-1, assuming the kinematic distance of 5.5 kpc. We also used the abundance ratio of [12CO/H2] = (Blake et al., 1987) and [12CO]/[13CO] = 75 (Güsten & Philipp, 2004). Accordingly, we adopt as (km s-1 pc-1)-1, where is the abundance ratio of [12CO/H2].
| No. (1) | Source Name (2) | (deg) (3) | (deg) (4) | (Jy) (5) | (Jy) (6) | (Jy) (7) | (Jy) (8) | Regions (9) | References (10) |
|---|---|---|---|---|---|---|---|---|---|
| IR01 | IRAS 18501+0038 | 33.69 | 0.05 | 1.5 | 1.4 | 50.5 | 419 | B | [1] |
| IR02 | IRAS 18502+0034 | 33.66 | 0.02 | 2.5 | 20.4 | 158 | 419 | E | [1] |
| IR03 | IRAS 18501+0039 | 33.72 | 0.06 | 2.7 | 3.0 | 50.5 | 295 | B | [1] |
| IR04 | IRAS 18503+0041 | 33.77 | 0.03 | 2.7 | 1.8 | 37.6 | 162 | [1] | |
| IR05 | IRAS 18506+0038 | 33.75 | 0.07 | 2.1 | 10.2 | 82.0 | 122 | D | [1] |
| IR06 | IRAS 18496+0037 | 33.62 | 0.14 | 4.4 | 2.6 | 21.0 | 192 | [1] | |
| IR07 | MSX5C G033.858000.0042 | 33.86 | 0.00 | [2] | |||||
| IR08 | IRAS 18498+0045B | 33.76 | 0.16 | 5.3 | 3.4 | 16.4 | 162 | A | [1] |
| IR09 | IRAS 18498+0028 | 33.52 | 0.02 | 4.1 | 11.3 | 72.9 | 176 | [1] | |
| IR10 | IRAS 18496+0042 | 33.71 | 0.18 | 1.7 | 3.4 | 26.3 | 192 | A | [1] |
| IR11 | [GE91] GGD 30 IRS 8 | 33.59 | 0.14 | [3] | |||||
| IR12 | IRAS 18498+0045A | 33.77 | 0.17 | 2.1 | 3.4 | 16.4 | 141 | A | [1] |
| IR13 | IRAS 18494+0038 | 33.63 | 0.19 | 2.9 | 3.8 | 50.8 | 192 | [1] | |
| IR14 | IRAS 18504+0025 | 33.54 | 0.13 | 2.6 | 5.9 | 98.1 | 305 | [1] | |
| Hii01 | [KC97c] G033.7+00.0 | 33.65 | 0.04 | B | [4] | ||||
| Hii02 | HRDS G033.7530.063 | 33.75 | 0.06 | D | [5] | ||||
| Hii03 | MSX6C G033.5237+00.0198 | 33.52 | 0.02 | [6] |
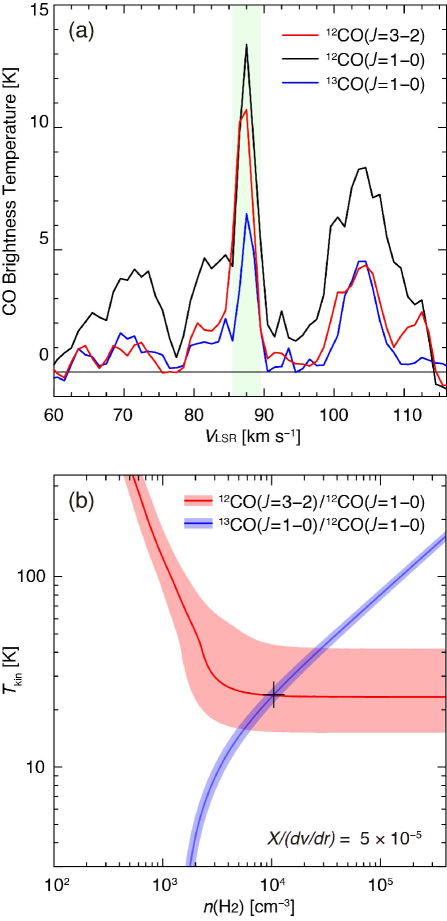
Figure 5a shows the CO spectra toward cloud C. The velocity range used for the LVG analysis is shown shaded. Each spectrum was smoothed to much the FWHM of 12CO( = 1–0) emission line. We obtained the intensity ratios of and 12CO = 1–0 /13CO = 1–0 (hereafter ) .
Figure 5b shows the result of the LVG analysis of cloud C. The red and blue lines indicate and , respectively. The errors (as shown in shaded areas in Figure 5b) are estimated with 1 noise levels for each spectrum, and relative calibration error of 5. Since 12CO( = 1–0) and 13CO( = 1–0) were simultaneously observed using the FOREST, the relative calibration error of 5 is canceled for the case of . We finally obtained the kinematic temperature K (16–42 K) and the number density (H2) cm-3 (6000–30000 cm-3).
4 DISCUSSION
4.1 Molecular and atomic clouds associated with the SNR Kes 79
Previous studies of the interstellar gas toward Kes 79 suggest the 100 km s-1 cloud is associated with the SNR (Green & Dewdney, 1992; Kilpatrick et al., 2016; Zhou et al., 2016). This claim is mainly based on two elements: (1) the 100 km s-1 cloud shows good spatial correspondence with the X-ray/radio-continuum shell and filamentary structures, and (2) the broad molecular line with 20 km s-1 width was possibly created by shock interactions. In this section, we show instead that the 80 km s-1 cloud is the one most likely to be associated with the SNR Kes 79 rather than the 30 or 100 km s-1 clouds.
First, we argue that it is difficult to decide which clouds are truly associated with the SNR Kes 79 from spatial comparisons alone. On the basis of our comparative study of the CO, Hi, radio-continuum, and X-rays data, the 30, 80, and 100 km s-1 clouds all show good spatial correspondence with the X-ray filaments and the radio shell (see Section 3.1). Spatially, the 30 km s-1 cloud has a cavity-like structure in Hi that coincides with the radio shell (Figure 2d). The overall CO distribution of the 80 km s-1 cloud tends to encircle the X-ray filaments and the radio shell (Figure 2b). In the 100 km s-1 cloud, the dense molecular clouds appear to lie along the southeastern shell of the SNR (Figure 2c).
In contrast, the velocity structures of the clouds are more useful for distinguishing which are really associated with the SNR. Expanding shell-like structures of CO and Hi are seen in 80 km s-1 cloud (see Figure 3b), whereas the 30 and 100 km s-1 clouds have no characteristic structures in either the CO or Hi (see Figures 3a and 3c). The 4 km s-1 expanding gas motions in the 80 km s-1 clouds are thought to be created by SNR shockwaves and/or a strong stellar wind from the progenitor of the supernova explosion (Chevalier, 1974). The typical expansion velocity of the molecular and atomic clouds associated with the SNR is to be –13 km s-1 (e.g., Landecker et al., 1989; Yamamoto et al., 2006; Fukui et al., 2012; Sashida et al., 2013; Sano et al., 2017). The expansion velocity of Kes 79 is found to be km s-1, which is similar to previous studies.
The spatial distribution of provides another source of information to help decide which molecular clouds are associated with the SNR. In the direction of Kes 79, we have identified some regions that have high intensity ratios of and have labeled them A–E. The positions of A, B, D, and E in the 30 and 100 km s-1 clouds correspond to IRAS point sources and Hii regions (see Figure 4 and Table 1), which may thus be the sources that have heated these molecular clouds. Furthermore, the existence of Hii regions in the direction of Kes 79 does not exclude the possibility that the broad molecular line in the 100 km s-1 cloud was created by star-formation activity (e.g., by multiple outflows from young stellar objects; Sano et al., 2010). In contrast, region C in the 80 km s-1 cloud has no extra heating sources (e.g., infrared sources or Hii regions), and the kinematic temperature of the region C is K, indicating that shock heating has occurred (e.g., Yoshiike et al., 2013).
A detailed spatial comparison among the radio continuum, CO, X-rays, and gamma-rays provides further evidence for the association of the 80 km-1 cloud with the SNR. Figure 6 shows a three-color image of Kes 79. The molecular cloud at 80 km s-1 delineates the outer boundary of the thermal X-ray shell and is embedded within the radio-continuum shell. We note that the radio-continuum shell is complementary to the two CO peaks in the southwest region, which is a typical signature of a shock-cloud interaction. According to Sano et al. (2017), interactions between shockwaves and inhomogeneous gas clumps enhance the synchrotron radio continuum around the gas clumps via amplifications of turbulence and magnetic fields (c.f., Inoue et al., 2012). Although the angular resolution of LAT is large, we find a good spatial correspondence between the peak positions of the molecular cloud and gamma-rays.
The cavity wall of dense gas surrounding the SNR is also consistent with the thermal X-ray properties of the SNR Kes 79. Sato et al. (2016) discovered that the CIE plasma extends to the outer radio shell, whereas the NEI plasma is spatially concentrated within the inner radio shell. We can interpret the X-ray properties with two scenarios: (1) the CIE plasma in the shock front was produced by the interaction between the forward shock and the dense gas wall, and (2) the reflected shock generated by the shock-cloud interaction thermalized the supernova ejecta inside the radio shell, which is observed as the NEI plasma. Moreover, since the bremsstrahlung X-ray flux is proportional to the square of the ambient gas density, the bright thermal X-rays toward the cloud C gives a further support of the shock-cloud interaction. In light of these considerations, we conclude that the 80 km-1 cloud is the one most likely to be associated with the SNR Kes 79.
4.2 Distance and age
On the basis of the physical association between the SNR shockwaves and the 80 km s-1 cloud, we here discuss the age and distance of Kes 79. In Sections 3.1 and 3.2, we found that the velocity range of the 80 km s-1 cloud extends from to km s-1; this corresponds to a central radial velocity of km s-1 and an expansion velocity of km s-1. By adapting the Galactic rotation curve model of Brand & Blitz (1993), we therefore obtain the kinematic distance of Kes 79 as kpc for the near side and kpc for the far side.
| RX J1713.73946a) | Vela Jr.b) | HESS J1731347c) | Kes 79d) | W44e) | ||
|---|---|---|---|---|---|---|
| Age (yr) | 1600 | 2400 | 4000 | 20000 | ||
| Distance (kpc) | 1 | 0.75 | 5.2 | 5.5 | 3 | |
| Diameter (pc) | 17.4 | 11.8 | 22 | 16 | 25 | |
| Molecular proton mass (104 ) | 0.9 | 0.1 | 5.1 | 1.7 | 40 | |
| Atomic proton mass (104 ) | 1.1 | 2.5 | 1.3 | 0.2 | 6 | |
| Total proton mass (104 ) | 2.0 | 2.6 | 6.4 | 1.9 | 46 | |
| (H2) (cm-3) | 60 | 4 | 64 | 310 | 180 | |
| (Hi) (cm-3) | 70 | 96 | 16 | 50 | 20 | |
| (H2 + Hi) (cm-3) | 130 | 100 | 80 | 360 | 200 | |
| (H2)/(Hi) | 0.9 | 0.04 | 4 | 6 | 9 | |
| Total CR proton energy ( erg) | 0.4† | 0.7 | 5 | 5 | 10 |
Note. — Column (1): numbers in Figure 4. Column (2): name of infrared point sources (IR01–IR14) and Hii regions (Hii01–Hii03) around Kes 79. Columns (3)–(4): source positions in Galactic coordinate. Columns (5)–(8): fluxes of 12, 25, 60, and 100 m. Column (9): region name defined in Section 3.3. Column (10): references, [1] Beichman et al. (1988), [2] Egan et al. (2001), [3] Gomez de Castro & Eiroa (1991), [4] Kuchar & Clark (1997), [5] Anderson et al. (2012), [6] Egan et al. (2003).
It is difficult to distinguish the near and far sides if the two distances are relatively close to each other, but Kes 79 is likely to be located at the near side. Because the absorbing column density toward Kes 79 ( cm-2, Sato et al., 2016) is consistent with the column density of foreground interstellar gas between the Sun and the SNR if it is located at the near side. The foreground interstellar gas on the near side corresponds to the velocity range from 2 to 81.5 km s-1. The column density of foreground interstellar gas is (H2 + Hi) = (H2) + (Hi), where (H2) is the column density of molecular hydrogen and (Hi) is the column density of atomic hydrogen. In this work, we use the relations (H2) = (CO) cm-2 (Okamoto et al., 2017) and (Hi) = (Hi) cm-2 (Dickey & Lockman, 1990), where (CO) and (Hi) are the integrated intensities of CO and Hi, respectively. We thus obtain (H2 + Hi) = cm-2, which is enough to explain the absorbing column density toward Kes 79. On the other hand, (H2 + Hi) for the far side distance is estimated to be cm-2 assuming the velocity range from 2 to 110 km s-1, which is too large as compared with the absorbing column density. It is therefore that the near side distance is more reasonable than the far side distance. To distinguish more accurately between the near and far sides, we need Hi absorption studies using Hi data with a finer angular resolution because of the strong radio continuum from Kes 79. We hereafter use the near-side distance of kpc.
Because the shockwave from Kes 79 interacts strongly with the 80 km s-1 cloud, we can estimate the dynamical age of the SNR assuming that it is in the Sedov-Taylor phase (Sedov, 1959). The dynamical age of the SNR is then given by;
| (1) |
where is the radius of the SNR, and is the shock velocity. We adopt the pc from the 5 arcmin radius of the outer radio shell. According to Sato et al. (2016), the best-fit CIE plasma temperature of is eV. Assuming the electron–ion temperature equilibration, can be described as , where is is Boltzmann’s constant, is mean atomic weight, and is the atomic hydrogen mass. We therefore obtain km s-1 and the dynamical age yr, indicating that the SNR Kes 79 can be categorized as a middle-aged SNR.
4.3 Total CR Protons Energy
Auchettl et al. (2014) discovered a GeV gamma-ray excess in the direction of Kes 79, which is consistent with hadronic gamma rays. To obtain the total CR proton energy, we first need to determine the total interstellar proton density associated with the SNR. The total mass of interstellar gas associated with Kes 79 is within a radius of 8 pc, and the mass of the molecular component is and that of the atomic component is . Here, we adopt the helium abundance of the molecular cloud to be and assume the Hi to be optically thin. Adopting a shell thickness of pc, we find the total interstellar proton density to be cm-3, with the proton density of the molecular component being cm-3, and that of the atomic component being cm-3. Here, we used the relation between (H2) and (CO) for estimating the molecular component; (Hi) and (Hi) for estimating the atomic component.
The total CR proton energy can then be derived by using the equation (e.g., Aharonian et al., 2006);
| (2) |
where (/1 cm-3)-1 is the characteristic cooling time of the protons and is the gamma-ray luminosity. According to Auchettl et al. (2014), (0.1–100 GeV) (/5.5 kpc)2 erg s-1, where is the distance to Kes 79. This values is consistent with a relation between the SNR radius and gamma-ray luminosity (Bamba et al., 2016). The resulting value of (1–1000 GeV) is /5.5 kpc)2 (/1 cm. Adopting the cm-3 and kpc, we finally obtain (1–1000 GeV) erg, corresponding to of the typical erg kinematic energy of supernova explosion.
A comparison between young gamma ray SNRs (RX J1713.73946, Vela Jr., and HESS J1731347) and middle-aged SNRs (Kes 79 and W44) is given in Table 2. The total interstellar proton masses are not much different among the SNRs, except for W44, but the abundance ratios of molecular and atomic protons (H2)/(Hi) are slightly different. We note that both the total CR proton energy and the ratio (H2)/(Hi) increase as an SNR ages. We can easily interpret the total CR proton energy as indicating that the efficiency of CR acceleration may increase in time, as has been previously suggested in some pioneering studies (e.g., Fukui et al., 2012; Yoshiike et al., 2013; Fukuda et al., 2014). As for the ratio (H2)/(Hi), we propose the hypothesis that the degree of shock propagation into a dense molecular cloud may affect the time variation of (H2)/(Hi). Further numerical simulations with three-dimensional magnetohydrodynamics will test this in detail.
To obtain a complete understanding of the total CR protons energy, the role of relativistic particle escape in this system should be considered. According to Uchiyama et al. (2012), the contribution of escaped CR protons in W44 is estimated to be – erg. Kes 79 also has a potential to detect the gamma-rays originated from the escaped CR protons and the total CR proton energy will be increased. Moreover, re-acceleration of pre-existing CR protons by radiative shocks might be an important component to our understanding of the relativistic particle populations in this remnant (e.g., Uchiyama et al., 2010). Further gamma-ray observations with high-spatial resolution and high-sensitivity using the Cherenkov Telescope Array (CTA) will allow us to accurately estimate the total CR proton energy of Kes 79.
5 SUMMARY
We have presented a new combined analysis of both the CO and Hi toward the gamma ray SNR Kes 79. We summarize the findings below:
-
1.
We found three candidates for the molecular/atomic clouds associated with the SNR Kes 79, which lie at radial velocities of , 80, and 100 km s-1. These clouds show good spatial correspondence with the radio and X-ray shells.
-
2.
Expanding gas motions, with km s-1, were obtained in the 80 km s-1 cloud, which were likely created by the SNR shockwaves and/or a strong stellar wind from the progenitor of the supernova explosion. Furthermore, the southern CO clump of the 80 km s-1 cloud–named cloud C–also showed a high-intensity ratio for CO 3–2/1–0, indicating a kinematic temperature of K owing to heating by the shock interaction. We conclude that the 80 km s-1 cloud is the one most likely to be associated with the SNR Kes 79.
-
3.
The kinematic distance of kpc and the dynamical age of yr of Kes 79 were updated using the Galactic rotation curve model of Brand & Blitz (1993) and Sedov’s self-similar solution (Sedov, 1959). The near-side distance of kpc is consistent with the absorbing column density derived by X-ray spectroscopy and the foreground gas density derived from the CO/Hi datasets.
-
4.
We obtained a total CR proton energy of (1– 1000 GeV) erg, which corresponds to 0.5 of the typical erg kinematic energy of a supernova explosion. We note that both the total CR proton energy and the abundance ratios of molecular and atomic protons (H2)/(Hi) increase as the SNR ages. We propose the hypothesis that the degree of shock propagation into a dense molecular cloud may affect both the time variation of (H2)/(Hi) and the efficiency of CR acceleration, both of which may have increased in time.
References
- Aharonian et al. (2006) Aharonian, F., Akhperjanian, A. G., Bazer-Bachi, A. R., et al. 2006, A&A, 449, 223
- Anderson et al. (2012) Anderson, L. D., Zavagno, A., Barlow, M. J., García-Lario, P., & Noriega-Crespo, A. 2012, A&A, 537, A1
- Angerhofer et al. (1977) Angerhofer, P. E., Becker, R. H., & Kundu, M. R. 1977, A&A, 55, 11
- Auchettl et al. (2014) Auchettl, K., Slane, P., & Castro, D. 2014, ApJ, 783, 32
- Bamba et al. (2016) Bamba, A., Sawada, M., Nakano, Y., et al. 2016, PASJ, 68, S5
- Becker & Kundu (1975) Becker, R. H., & Kundu, M. R. 1975, AJ, 80, 679
- Beichman et al. (1988) Beichman, C. A., Neugebauer, G., Habing, H. J., Clegg, P. E., & Chester, T. J. 1988, Infrared astronomical satellite (IRAS) catalogs and atlases. Volume 1: Explanatory supplement, 1,
- Bell (1978) Bell, A. R. 1978, MNRAS, 182, 147
- Blake et al. (1987) Blake, G. A., Sutton, E. C., Masson, C. R., & Phillips, T. G. 1987, ApJ, 315, 621
- Blandford & Ostriker (1978) Blandford, R. D., & Ostriker, J. P. 1978, ApJ, 221, L29
- Brand & Blitz (1993) Brand, J., & Blitz, L. 1993, A&A, 275, 67
- Caswell et al. (1975) Caswell, J. L., Clark, D. H., & Crawford, D. F. 1975, Australian Journal of Physics Astrophysical Supplement, 37, 39
- Caswell et al. (1981) Caswell, J. L., Milne, D. K., & Wellington, K. J. 1981, MNRAS, 195, 89
- Chevalier (1974) Chevalier, R. A. 1974, ApJ, 188, 501
- Dempsey et al. (2013) Dempsey, J. T., Thomas, H. S., & Currie, M. J. 2013, ApJS, 209, 8
- Dickel & Denoyer (1975) Dickel, J. R., & Denoyer, L. K. 1975, AJ, 80, 437
- Dickey & Lockman (1990) Dickey, J. M., & Lockman, F. J. 1990, ARA&A, 28, 215
- Egan et al. (2001) Egan, M. P., Price, S. D., & Gugliotti, G. M. 2001, Bulletin of the American Astronomical Society, 34, 130.10
- Egan et al. (2003) Egan, M. P., Price, S. D., Kraemer, K. E., et al. 2003, VizieR Online Data Catalog, 5114,
- Frail & Clifton (1989) Frail, D. A., & Clifton, T. R. 1989, ApJ, 336, 854
- Fruscione et al. (2006) Fruscione, A., McDowell, J. C., Allen, G. E., et al. 2006, Proc. SPIE, 6270, 62701V
- Fukui et al. (2012) Fukui, Y., Sano, H., Sato, J., et al. 2012, ApJ, 746, 82
- Fukuda et al. (2014) Fukuda, T., Yoshiike, S., Sano, H., et al. 2014, ApJ, 788, 94
- Fukui et al. (2017) Fukui, Y., Sano, H., Sato, J., et al. 2017, ApJ, 850, 71
- Giacani et al. (2009) Giacani, E., Smith, M. J. S., Dubner, G., et al. 2009, A&A, 507, 841
- Ginzburg & Syrovatskii (1964) Ginzburg, V. L., & Syrovatskii, S. I. 1964, Soviet Ast., 8, 342
- Goldreich & Kwan (1974) Goldreich, P., & Kwan, J. 1974, ApJ, 189, 441
- Gomez de Castro & Eiroa (1991) Gomez de Castro, A. I., & Eiroa, C. 1991, A&A, 241, 589
- Goss (1968) Goss, W. M. 1968, ApJS, 15, 131
- Green (2014) Green, D. A. 2014, Bulletin of the Astronomical Society of India, 42, 47
- Green & Dewdney (1992) Green, D. A., & Dewdney, P. E. 1992, MNRAS, 254, 686
- Güsten & Philipp (2004) Güsten, R., & Philipp, S. D. 2004, The Dense Interstellar Medium in Galaxies, 91, 253
- Hayakawa (1952) Hayakawa, S. 1952, Progress of Theoretical Physics, 8, 571
- H. E. S. S. Collaboration et al. (2018) H. E. S. S. Collaboration, Abdalla, H., Abramowski, A., et al. 2018, A&A, 612, A6
- Inoue et al. (2012) Inoue, T., Yamazaki, R., Inutsuka, S.-i., & Fukui, Y. 2012, ApJ, 744, 71
- Kamazaki et al. (2012) Kamazaki, T., Okumura, S. K., Chikada, Y., et al. 2012, PASJ, 64, 29
- Kassim (1992) Kassim, N. E. 1992, AJ, 103, 943
- Kilpatrick et al. (2016) Kilpatrick, C. D., Bieging, J. H., & Rieke, G. H. 2016, ApJ, 816, 1
- Kraemer et al. (2003) Kraemer, K. E., Shipman, R. F., Price, S. D., et al. 2003, AJ, 126, 1423
- Kuchar & Clark (1997) Kuchar, T. A., & Clark, F. O. 1997, ApJ, 488, 224
- Kuno et al. (2011) Kuno, N., Takano, S., Iono, D., et al. 2011, General Assembly and Scientific Symposium, XXXth URSI, 2
- Landecker et al. (1989) Landecker, T. L., Pineault, S., Routledge, D., & Vaneldik, J. F. 1989, MNRAS, 237, 277
- Minamidani et al. (2016) Minamidani, T., Nishimura, A., Miyamoto, Y., et al. 2016, Proc. SPIE, 9914, 99141Z
- Moriguchi et al. (2005) Moriguchi, Y., Tamura, K., Tawara, Y., et al. 2005, ApJ, 631, 947
- Okamoto et al. (2017) Okamoto, R., Yamamoto, H., Tachihara, K., et al. 2017, ApJ, 838, 132
- Rho & Petre (1998) Rho, J., & Petre, R. 1998, ApJ, 503, L167
- Sano et al. (2010) Sano, H., Sato, J., Horachi, H., et al. 2010, ApJ, 724, 59
- Sano et al. (2017) Sano, H., Reynoso, E. M., Mitsuishi, I., et al. 2017, Journal of High Energy Astrophysics, 15, 1
- Sashida et al. (2013) Sashida, T., Oka, T., Tanaka, K., et al. 2013, ApJ, 774, 10
- Sato et al. (2016) Sato, T., Koyama, K., Lee, S.-H., & Takahashi, T. 2016, PASJ, 68, S8
- Sawada et al. (2008) Sawada, T., Ikeda, N., Sunada, K., et al. 2008, PASJ, 60, 445
- Scoville & Solomon (1974) Scoville, N. Z., & Solomon, P. M. 1974, ApJ, 187, L67
- Sedov (1959) Sedov, L. I. 1959, Similarity and Dimensional Methods in Mechanics, New York: Academic Press, 1959,
- Seta et al. (1998) Seta, M., Hasegawa, T., Dame, T. M., et al. 1998, ApJ, 505, 286
- Seward & Velusamy (1995) Seward, F. D., & Velusamy, T. 1995, ApJ, 439, 715
- Stil et al. (2006) Stil, J. M., Taylor, A. R., Dickey, J. M., et al. 2006, AJ, 132, 1158
- Sun et al. (2004) Sun, M., Seward, F. D., Smith, R. K., & Slane, P. O. 2004, ApJ, 605, 742
- Tsunemi & Enoguchi (2002) Tsunemi, H., & Enoguchi, H. 2002, PASJ, 54, 735
- Uchiyama et al. (2010) Uchiyama, Y., Blandford, R. D., Funk, S., Tajima, H., & Tanaka, T. 2010, ApJ, 723, L122
- Uchiyama et al. (2012) Uchiyama, Y., Funk, S., Katagiri, H., et al. 2012, ApJ, 749, L35
- Umemoto et al. (2017) Umemoto, T., Minamidani, T., Kuno, N., et al. 2017, PASJ, 69, 78
- Velusamy et al. (1991) Velusamy, T., Becker, R. H., & Seward, F. D. 1991, AJ, 102, 676
- Yamamoto et al. (2006) Yamamoto, H., Kawamura, A., Tachihara, K., et al. 2006, ApJ, 642, 307
- Yoshiike et al. (2013) Yoshiike, S., Fukuda, T., Sano, H., et al. 2013, ApJ, 768, 179
- Zhou et al. (2016) Zhou, P., Chen, Y., Safi-Harb, S., et al. 2016, ApJ, 831, 192