X-ray line coincidence photopumping in a solar flare
Abstract
Line coincidence photopumping is a process where the electrons of an atomic or molecular species are radiatively excited through the absorption of line emission from another species at a coincident wavelength. There are many instances of line coincidence photopumping in astrophysical sources at optical and ultraviolet wavelengths, with the most famous example being Bowen fluorescence (pumping of O iii 303.80 Å by He ii), but none to our knowledge in X-rays. However, here we report on a scheme where a He-like line of Ne ix at 11.000 Å is photopumped by He-like Na x at 11.003 Å, which predicts significant intensity enhancement in the Ne ix 82.76 Å transition under physical conditions found in solar flare plasmas. A comparison of our theoretical models with published X-ray observations of a solar flare obtained during a rocket flight provides evidence for line enhancement, with the measured degree of enhancement being consistent with that expected from theory, a truly surprising result. Observations of this enhancement during flares on stars other than the Sun would provide a powerful new diagnostic tool for determining the sizes of flare loops in these distant, spatially-unresolved, astronomical sources.
keywords:
sun: corona – sun: flares – stars: coronae – stars: flares1 Introduction
Line coincidence photopumping — the radiative excitation of a transition in an atomic or molecular species due to line emission in another species at a coincident wavelength — was first recognised in astrophysics by Bowen (1934). This process, termed Bowen fluorescence, results from the wavelength coincidence of the 2p2 3P2–2p3d 3P2 transition of O iii at 303.80 Å with the He ii 1s 2S1/2–2p 2P1/2,3/2 resonance lines, with the latter pumping the former, leading to O iii emission features linked to the 2p3d 3P2 level which are much stronger than would be expected in nebular plasmas. Since the seminal paper by Bowen, numerous examples of line coincidence photopumping in astrophysical plasmas have been identified. These include, for example: pumping of O i 2s22p4 3P2–2s22p33d 3D1,2,3 at 1025.76 Å by Lyman-, which following cascades leads to enhanced emission in the O i 2s22p4 3P0,1,2–2s22p33s 3S1 triplet lines at 1304 Å (Skelton & Shine, 1982); the 2s22p 2P3/2–2s2p2 2D5/2 transition of C ii at 1335.71 Å pumping Cl i 3s23p5 2P3/2–3s23p44s 2P1/2, resulting in an increase in intensity in Cl i 3s23p5 2P1/2–3s23p44s 2P1/2 at 1351.66 Å (Shine, 1983); 2p63s 2S1/2–2p63p 2P3/2 of Mg ii at 2795.53 Å pumping Mn i 3d54s2 a6S5/2–3d54s4p y6P7/2, in turn enhancing 3d54s2 a6S5/2–3d54s4p z8P7/2 of Mn i at 5394.67 Å (Doyle et al., 2001). However, the O iii/He ii case remains that at the shortest wavelength (Hartman, 2013).
Although some schemes have been suggested and investigated theoretically (Sako, 2003), there has been no detection to our knowledge of photopumping at X-ray wavelengths in a high temperature (coronal) astrophysical source. Coronal emission is usually driven by collisional excitation, and observing a photopumping scheme in X-rays (which is by definition radiatively excited) would be extremely interesting, especially as this provides an independent pathway to determine plasma parameters in remote, spatially-unresolved, astronomical sources (see Section 3).
In contrast to the astrophysical case, there has been an enormous amount of research on X-ray line coincidence photopumping schemes in laboratory plasmas, due to the possibility of developing X-ray lasers via this technique. Although lasing has not yet been achieved, one experimental setup by Porter et al. (1992) involving the helium-like ions of sodium (Na x) and neon (Ne ix) did demonstrate population inversion, with the potential gain modelled by Nilsen & Chandler (1991). Given the success of this scheme in the laboratory, we have chosen to model it for astrophysical environments. Our plasma models are discussed in detail in Section 2, with the theoretical results and comparison with solar flare observations given in Section 3.
2 Line coincidence photopumping models
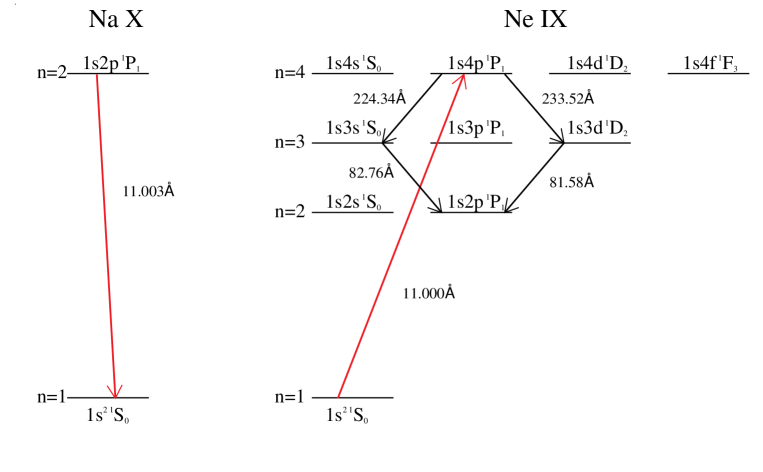
In Fig. 1 we show the the energy level diagram for the Na x/Ne ix photopumping scheme of Porter et al. (1992). The 1s2 1S0–1s2p 1P1 resonance line of Na x at 11.003 Å pumps the Ne ix 1s2 1S0–1s4p 1P1 transition at 11.000 Å. In laboratory plasmas, there is collisional redistribution from the 1s4p 1P1 to other 1s4 ( = s, d, f) levels due to the high electron density, but this does not happen in the lower density astrophysical case. Instead, electrons in 1s4p 1P1 decay to 1s3s 1S0 or 1s3d 1D2, producing emission lines at 224.34 Å and 233.52 Å, respectively. Subsequently, 1s3s 1S0 and 1s3d 1D2 both decay to 1s2p 1P1, producing 82.76 Å and 81.58 Å, respectively.
We have used the GALAXY modelling code of Rose (1995) to calculate the expected enhancements in the above lines of Ne ix due to photopumping, as a function of electron density, Ne, and plasma pathlength, L. Briefly, GALAXY is a time-independent collisional-radiative model that describes the excitation and ionisation within a plasma at a given electron and ion temperature and a given electron number density. It can simulate mixtures of elements through a self-consistent calculation of electron number density. All the atomic data, including energy levels, collisional and radiative excitation and ionisation rates, plus autoionisation and dielectronic recombination rates, are generated internally using simple screened-hydrogenic methods. The description of levels is in the nl-coupled average-of-configuration approximation. We consider a mixture of H, He, Ne and Na, with the solar coronal abundances of Schmelz et al. (2012). Using the nl-coupled configuration average description, GALAXY considers for Ne and Na the fully stripped ions as well as the H-like configurations 1s, 2s, 2p, 3s, 3p, 3d, …, 4d, 4f; the He-like configurations 1s2, 1s2s, 1s2p, 1s3s, 1s3p, 1s3d, …, 1s4d, 1s4f; plus the low-lying Li-like configurations 1s22s, 1s22p. For the elements H and He, the model only includes the fully-stripped ions.
GALAXY is a 0-D model; however, two lengths are considered in the calculation of radiation transfer. The first, y, is the average distance that photons travel to escape, while the second, z, is the length of plasma along a line-of-sight for which a calculation of the emergent intensity in a spectral line is required. In the calculations reported here, y is taken as identical to z.
GALAXY uses a line trapping model to simulate the effect of reabsorption of line radiation. In this case the radiative rate (A-value) is reduced to account for the reabsorption as described by Rose (1995), with the difference that the escape factor now used in GALAXY differs from that reported in Rose by adopting the more accurate description described by Phillips et al. (2008). Line trapping is included on all the electric-dipole allowed transitions from the ground states of H-like and He-like ions.
The line coincidence photopumping is calculated in GALAXY by including radiative excitation and de-excitation rates between the upper level and lower level (R and R, respectively) by
R = Aβ→αnph(/)
R = Aβ→α(1 + nph)
where nph is the radiation modal photon density covering the transition , and and are the degeneracies of levels and , respectively. For the case of interest here involving an internal source of photons where a transition is coincident with and pumps the transition then we make the approximation
nph = 1/([nχ/nδ] – 1)
where nχ and are the ion number density and degeneneracy of level , respectively. This method has been used in previous calculations of line coincidence photopumping, for example by Judge (1988) for the pumping of S i lines by H i Ly- radiation in the chromospheres of giant stars. The use of the above equations is approximate, and requires that the line (in our case the Na x 1s2 1S0–1s2p 1P1 transition) is optically thick and that this opacity-broadened line effectively overlaps the line (in our case Ne ix 1s2 1S0–1s4p 1P1). In the calculations reported here, Na x 1s2 1S0–1s2p 1P1 is optically thick for cases showing a significant line enhancement ratio, and the line centres of the Na x 1s2 1S0–1s2p 1P1 and Ne ix 1s2 1S0–1s4p 1P1 transitions are close to the Doppler width of each line at the electron temperatures considered. Consequently, we consider that our modelling of the line coincidence photopumping is adequate in approximately identifying the effect.
GALAXY calculates the emission intensity integrated over a spectral line along the line-of-sight in the plasma of length z using the expressions given in Rose (1995). We believe that the approximations made in terms of the level of detail in the description of the atomic physics and of the radiation transfer are adequate to provide an indication of the effect of line coincidence photopumping in this situation. However, more accurate calculations would be needed to allow any observed line enhancements to be used reliably to predict plasma properties, which we will report in future publications.
3 Results and discussion
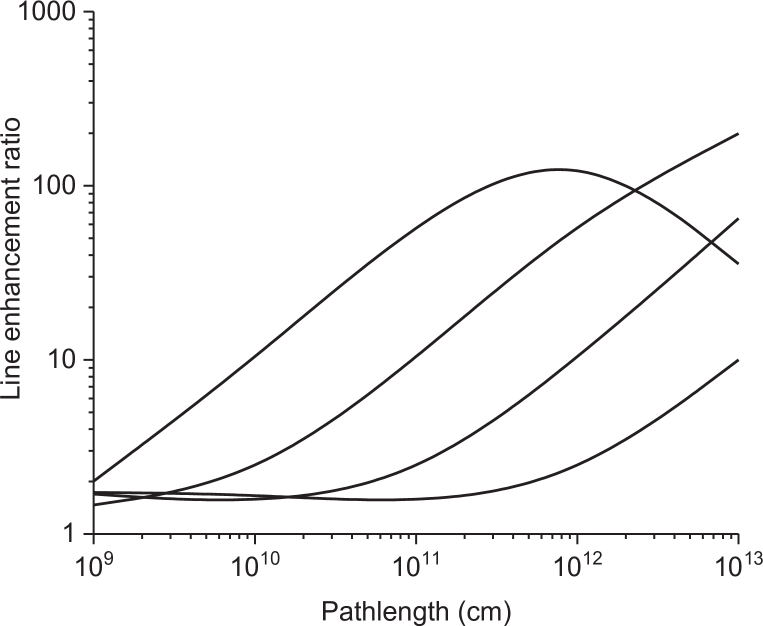
We have calculated the line enhancement factors (i.e. line intensity of the photopumped line divided by that when there is no pumping) for several Ne ix transitions for a range of Ne (= 1010–1013 cm-3) and L (= 109–1013 cm) appropriate to flaring coronal loops in the Sun (Shibata & Magara, 2011) and other active, late-type stars (Mullan et al., 2006). Our results for the 82.76 Å line are shown in Fig. 2. Predicted enhancements in the 224.34 Å and 233.52 Å lines are similar to those for 82.76 Å, while for 81.58 Å they are about a factor of 20 smaller. An inspection of Fig. 2 reveals that the enhancement factor does not depend strongly on the electron density unless Ne 1011 cm-3, but is sensitive to the pathlength for L 1010 cm. We note that the line enhancement factors are not very sensitive to the adopted electron temperature, Te. For example, for a pathlength L = 1011 cm, increasing the temperature from that of maximum Ne ix fractional abundance in ionisation equilibrium, Te = 1.6106 K (Bryans, Landi & Savin, 2009), to 2.3106 K, leads to a change in the line enhancement factor of less than 20 per cent at an electron density of Ne = 1011 cm-3, decreasing to less than 15 per cent at Ne = 1013 cm-3.
In solar and late-type stellar flare spectra, the Ne ix 224.34 Å and 233.52 Å lines are unfortunately blended with the strong Fe xiv 224.35 Å and O iv 233.55 Å features, respectively. A synthetic solar flare spectrum calculated with the latest version (8.0.1) of the CHIANTI database (Dere et al., 1997; Del Zanna et al., 2015) with the coronal abundances of Schmelz et al. (2012) indicates that Ne ix makes a contribution of less than 1 per cent to the total line flux in both instances, while solar flare observations confirm that the features are due to Fe xiv (Bhatia et al., 1994) and O iv (Widing, 1982). In the case of the 81.58 Å transition, the predicted enhancement is too small to detect the feature, even under optimal conditions.
However, the situation is different for the Ne ix 1s2p 1P1–1s3s 1S0 transition at 82.76 Å. Although this lies in a relatively unexplored spectral region, one very interesting dataset is a soft X-ray rocket spectrum of a solar flare between 10 – 95 Å obtained at a high spectral resolution of 0.02 Å by Acton et al. (1985). In particular, Acton et al. note an unidentified emission line at 82.76 Å, which is listed as blended. Assuming an uncertainty of 5 in the digit beyond the last significant figure in the National Institute of Standards and Technology (NIST) Atomic Spectra Database (Kramida et al., 2016), one obtains a value 82.760 0.001 Å for the wavelength of the 1s2p 1P1–1s3s 1S0 transition of Ne ix. However, we have undertaken new relativistic many-body calculations, including the Breit interaction and radiative corrections (Chen, Cheng & Johnson, 1993, 2001; Cheng et al., 1994) but with more basis functions, which lead to a value of 82.762 0.001 Å. Averaging these two results gives a final predicted wavelength of 82.761 0.001 Å, confirming the NIST listing.
The CHIANTI synthetic flare spectrum (Dere et al., 1997; Del Zanna et al., 2015) indicates that, even in the absence of photopumping, the Ne ix 82.76 Å transition should dominate the emission feature observed by Acton et al. (1985), contributing at least 50 per cent to the total line flux, with Fe xx and Fe xxii providing the main blending transitions. Furthermore, the Acton et al. flare spectrum also contains the Ne ix 1s2 1S0–1s2p 1P1 resonance line at 13.45 Å and 1s2 1S0–1s2s 3S1 forbidden line at 13.70 Å. The electron density of the flare is Ne 1011 cm-3 (Brown et al., 1986), for which CHIANTI predicts line intensity ratios (in photon units) of 82.76/13.45 = 0.019 and 82.76/13.70 = 0.020, compared to experimental values of 0.20 and 0.24, respectively. We note that the measured 13.45/13.70 line intensity ratio and the theoretical estimate from CHIANTI are both 1.2, indicating no blending in these features. Hence, assuming that Ne ix is responsible for 50 per cent of the 82.76 Å line intensity, both the 82.76/13.45 and 82.76/13.70 ratios indicate that 82.76 Å is enhanced by a factor of 5. The maximum flare loop length for the Sun is observed to be L 1010 cm (Shibata & Magara, 2011), which from Fig. 2 at Ne = 1011 cm-3 indicates an expected enhancement of a factor of 2, not too different from the measured value.
Although the above solar flare results are very encouraging, providing to our knowledge the first evidence for X-ray line coincidence photopumping in an astrophysical source, they must be treated with some caution. The flare spectrum of Acton et al. (1985), recorded on photographic film, is no longer accessible and hence the quality of the 82.76 Å line measurement (and indeed those of other transitions) cannot be confirmed. In addition, the 13.45 + 13.70 Å and 82.76 Å features lie close to opposite ends of the flare wavelength coverage (10 – 95 Å), so that instrumental sensitivity calibration may be an issue.
Clearly, further observations of the Ne ix 13.45, 13.70 and 82.76 Å lines are desirable to unreservedly confirm our findings. Ideally, this would be for flare plasmas with larger values of electron density and pathlength than the solar case, as Fig. 2 indicates these would show even greater enhancement factors. Such plasmas are provided by, for example, late-type stellar coronal sources, many of which are believed to have high density (Ne 1011 cm-3), large pathlength (L 1010–1012 cm) flaring loops (Mullan et al., 2006). Detection of 82.76 Å line enhancement in these sources, as well as being an extremely interesting plasma effect, would also have a profound astrophysical application. The electron density of a flare plasma is relatively straightforward to determine from spectra in the 13–83 Å range covering the Ne ix features, due to the presence of numerous Ne-diagnostic emission lines (Brown et al., 1986). By contrast, the methods developed for determining stellar flare loop pathlengths L require various assumptions to be made. For example, that of Haisch (1983) assumes no additional flare heating during flare decay, while the method of Shibata & Yokoyama (2002) requires an assumption of the value for the magnetic field strength (see Mullan et al. 2006 for more details on these and other methods). A comparison of the 82.76 Å line enhancement factor and flare electron density measured from an X-ray spectrum with the results in Fig. 2 will give an independent determination of L, and in particular will yield values for high L stellar coronal plasmas, as the enhancement factor is predicted to become very sensitive to L under such conditions. These measurements of L may be compared with those derived using other methods, to determine the reliability of the latter and the assumptions made. Indeed, in principle the enhancement effect could provide a very powerful diagnostic tool for determining plasma pathlengths in any remote, spatially-unresolved, astrophysical source which shows similar values of Ne and L to the late-type stellar cases, such as the coronal regions of active galactic nuclei (Reeves et al., 2016).
Unfortunately, the full wavelength range covering the Ne ix 13.45, 13.70 and 82.76 Å lines is not accessible with most operating telescopes. The only currently operational instrument covering this range is the Chandra LETG spectrograph in conjunction with the HRC-S detector (Brinkman et al., 2000). However, while its spectral resolution is sufficiently high to separate the Ne ix lines at 13.45 and 13.70 Å, it cannot resolve blends of these with surrounding Fe xix lines in flare observations (Ness et al., 2003). Future X-ray observatories may provide better opportunities to study the Ne ix photopumping scheme in astrophysical sources; a spectral resolution of better than 0.02 Å and a high throughput will be required to determine the behaviour of the Ne ix 13.45, 13.70 and 82.76 Å features in a time-resolved manner during stellar flares. While the planned capabilities for Athena+ include high resolution spectral capabilities only at wavelengths below Ne ix 82.76 Å (Nandra et al., 2013), other missions which are yet to be proposed, such as LynX/X-ray Surveyor (Gaskin et al., 2015), may be able to provide the necessary observational features.
Acknowledgements
FPK, KP and MM are grateful to the Science and Technology Facilities Council for financial support. The research leading to these results has received funding from the European Community’s Seventh Framework Programme (FP7/2007–2013) under grant agreement no. 606862 (F-CHROMA). The work of JN was performed under the auspices of the US Department of Energy by Lawrence Livermore National Laboratory under Contract DE-AC52-07NA27344. We thank K. T. Cheng for providing valuable advice concerning the atomic physics calculations. CHIANTI is a collaborative project involving George Mason University, the University of Michigan (USA) and the University of Cambridge (UK).
References
- Acton et al. (1985) Acton L. W., Bruner M. E., Brown W. A., Fawcett B. C., Schweizer W., Speer R. J., 1985, ApJ, 291, 865
- Bhatia et al. (1994) Bhatia A. K., Kastner S. O., Keenan F. P., Conlon E. S., Widing K. G., 1994, ApJ, 427, 497
- Bowen (1934) Bowen I. S., 1934, PASP, 46, 146
- Brinkman et al. (2000) Brinkman A. C. et al., 2000, ApJ, 530, L111
- Brown et al. (1986) Brown W. A., Bruner M. E., Acton L. W., Mason H. E., 1986, ApJ, 301, 981
- Bryans, Landi & Savin (2009) Bryans P., Landi E., Savin D. W., 2009, ApJ, 691, 1540
- Chen, Cheng & Johnson (1993) Chen M. H., Cheng K. T., Johnson W. R., 1993, Phys. Rev. A, 47, 3692
- Chen, Cheng & Johnson (2001) Chen M. H., Cheng K. T., Johnson W. R., 2001, Phys. Rev. A, 64, 042507
- Cheng et al. (1994) Cheng K. T., Chen M. H., Johnson W. R., Sapirstein J., 1994, Phys. Rev. A, 50, 247
- Del Zanna et al. (2015) Del Zanna G., Dere K. P., Young P. R., Landi E., Mason H. E., 2015, A&A, 582, A56
- Dere et al. (1997) Dere K. P., Landi E., Mason H. E., Monsignori-Fossi B. C., Young, P. R., 1997, A&AS, 125, 149
- Doyle et al. (2001) Doyle J. G., Jevremović D., Short C. I., Hauschildt P. H., Livingston W., Vince I., 2001, A&A, 369, L13
- Gaskin et al. (2015) Gaskin J. A. et al., 2015, Proc. SPIE, 9601, 96010J
- Haisch (1983) Haisch B. M., 1983, IAU Colloq., 71, 255
- Hartman (2013) Hartman H., 2013, Springer Series on Atomic, Optical and Plasma Physics, 76, 189
- Judge (1988) Judge P. G., 1988, MNRAS, 231, 419
- Kramida et al. (2016) Kramida A., Ralchenko Y., Reader J., NIST ASD Team, 2016, National Institute of Standards and Technology Atomic Spectra Database Version 5.4. Available online at: http://physics.nist.gov/asd
- Mullan et al. (2006) Mullan D. J., Mathioudakis M., Bloomfield D. S., Christian D. J., 2006, ApJS, 164, 173
- Nandra et al. (2013) Nandra K. et al., 2013, The hot and energetic Universe: A white paper presenting the science theme motivating the Athena+ mission. Paper available at: https://arxiv.org/abs/1306.2307
- Ness et al. (2003) Ness J.-W., Brickhouse N. S., Drake J. J., Huenemoerder D. P., 2003, ApJ, 598, 1277
- Nilsen & Chandler (1991) Nilsen J., Chandler E., 1991, Phys. Rev. A, 44, 4591
- Phillips et al. (2008) Phillips G. J., Wark J. S., Kerr F. M., Rose S. J., Lee R. W., 2008, High Energy Density Phys., 4, 18
- Porter et al. (1992) Porter J. L. et al., 1992, Phys. Rev. Lett., 68, 796
- Reeves et al. (2016) Reeves J. N., Porquet D., Braito V., Nardini E., Lobban A., Turner T. J., 2016, ApJ, 828, 98
- Rose (1995) Rose S. J., 1995, J. Quant. Spectrosc. Radiative Transfer, 54, 333.
- Sako (2003) Sako M., 2003, ApJ, 594, 1108
- Schmelz et al. (2012) Schmelz J. T., Reames D. V., von Steiger R., Basu S., 2012, ApJ, 755, 33
- Shibata & Magara (2011) Shibata K., Magara T., 2011, Living Rev. Sol. Phys., 8, 6
- Shibata & Yokoyama (2002) Shibata K., Yokoyama T., 2002, ApJ, 577, 422
- Shine (1983) Shine R. A., 1983, ApJ, 266, 882
- Skelton & Shine (1982) Skelton D. L., Shine R. A., 1982, ApJ, 259, 869
- Widing (1982) Widing K. G., 1982, ApJ, 258, 835