Unmixing the Galactic Halo with RR Lyrae tagging
Abstract
We show that tagging RR Lyrae stars according to their location in the period-amplitude diagram can be used to shed light on the genesis of the Galactic stellar halo. The mixture of RR Lyrae of ab type, separated into classes along the lines suggested by Oosterhoff, displays a strong and coherent evolution with Galactocentric radius. The change in the RR Lyrae composition appears to coincide with the break in the halo’s radial density profile at 25 kpc. Using simple models of the stellar halo, we establish that at least three different types of accretion events are necessary to explain the observed RRab behavior. Given that there exists a correlation between the RRab class fraction and the total stellar content of a dwarf satellite, we hypothesize that the field halo RRab composition is controlled by the mass of the progenitor contributing the bulk of the stellar debris at the given radius. This idea is tested against a suite of cosmological zoom-in simulations of Milky Way-like stellar halo formation. Finally, we study some of the most prominent stellar streams in the Milky Way halo and demonstrate that their RRab class fractions follow the trends established previously.
keywords:
Milky Way – galaxies: dwarf – galaxies: structure – Local Group – stars: variables: RR Lyrae1 Introduction
“Chemical tagging” postulates the existence of a stellar fingerprint — a unique pattern of elemental abundances — that each star carries and that can be used to trace it back to its location of origin (Freeman & Bland-Hawthorn, 2002). This hypothesis has motivated many spectroscopic surveys (Gilmore et al., 2012; Allende Prieto et al., 2008; Majewski et al., 2017; De Silva et al., 2015; Cui et al., 2012) and has kick-started a number of observational (e.g. Helmi et al., 2006; Majewski et al., 2012; Blanco-Cuaresma et al., 2015) and theoretical (e.g. Font et al., 2006; Roškar et al., 2008; Bland-Hawthorn et al., 2010) investigations, opening a new field of astrophysical enquiry — Galactic chemo-dynamics (see e.g. Schönrich & Binney, 2009; Minchev et al., 2013, 2014). The application of the “chemical tagging” idea to the studies of the Galactic disc has enjoyed plenty of success (e.g. De Silva et al., 2007; Bensby et al., 2014; Bovy, 2016), yet inevitably, has uncovered a number of stumbling blocks too (see e.g. Mitschang et al., 2014; Ting et al., 2015; Ness et al., 2017).
In the Milky Way’s halo, progress has so far been much slower, mainly because acquiring a large number of high resolution spectra of stars across a range of halo locations remains prohibitively arduous. For example, the most recent attempt to survey the halo at high resolution beyond the Solar neighborhood (see Battaglia et al., 2017) includes only 28 stars, whose heliocentric distances are mostly limited to within 30 kpc. Note, however, that while the field halo remains poorly explored (in terms of precision chemistry), there exists a large amount of spectroscopic data on the surviving satellites. Curiously, while similar in concept, the genealogy of the disc and the halo differ substantially in practice. In the disc, chemo-dynamicists attempt to rewind the stars back to the low-mass star clusters they were born in. In the halo, a much richer variety of progenitors are available: stellar systems with masses from that of a giant molecular cloud to that of the Large Magellanic Cloud (LMC) could have all contributed to the halo formation.
For example, by comparing the abundance trends in the globular clusters (GCs) and the local halo stars, several authors claim that as much as of the stellar halo could have originated in GCs (Carretta et al., 2010; Martell & Grebel, 2010; Martell et al., 2011). The above calculation relies heavily on the theory that the GCs were 10-20 times more massive in their youth and have experienced prolific mass loss since — the argument put in place to explain the ratios between the second and first generations of their member stars (see Gratton et al., 2012, for a review). However, the study of Deason et al. (2015) argues against the stellar halo creation through GC disruption. They base their argument on the measurements of the ratio of the number of Blue Horizontal Branch stars to that of Blue Stragglers. Bear in mind though that, as Chung et al. (2016) show, this constraint may perhaps be circumvented by invoking the loss of most of the first generation stars early in a cluster’s life.
At the other end of the mass spectrum, observational evidence is mounting for the most massive dwarf galaxies to contribute a significant fraction of the stellar halo. First, according to the -elements to iron abundance ratio (as gleaned both from low and high resolution spectroscopy), the local stellar halo appears similar to galaxies like the LMC and Sgr (see e.g. Venn et al., 2004; Tolstoy et al., 2009; de Boer et al., 2014). Additionally, the Milky Way (MW) halo’s radial density profile shows a break at around 25 kpc (Watkins et al., 2009; Deason et al., 2011; Sesar et al., 2011), which according to Deason et al. (2013) could be best explained with an early accretion of a massive stellar system. The final clue can be found in the study of the make-up of the RR Lyrae population of the Galactic halo. For example, Fiorentino et al. (2015) demonstrate that high amplitude short period (HASP) RRab stars can be used to decipher the relative contributions of the GCs, Ultra-Faint dwarfs (UFDs), classical dwarf spheroidals (dSph) and massive systems such as the LMC and the SMC. They point out that while the HASP RR Lyrae are a common denizen of the halo, these stars are completely lacking in most surviving dwarfs (including all UFDs), except for the Sagittarius (Sgr) and the Magellanic Clouds. In GCs, as Fiorentino et al. (2015) show, only the metal-rich systems have sizeable HASP populations. Thus the only pathway to HASP creation is via a massive system with rapid metal enrichment. This picture is in full agreement with the earlier analysis of the period-amplitude distribution (known as the Bailey diagram) of the RRLs in the halo and the MW satellites (see e.g. Catelan, 2009; Zinn et al., 2014).
Note that the hypothesis of the stellar halo creation by way of a massive dwarf galaxy disruption does not directly contradict the evidence for a substantial GC contribution. Incontrovertibly, GCs do not form on their own but always require a host, an unlucky galaxy destined to be tidally destroyed (see e.g. Kruijssen, 2015; Bekki & Tsujimoto, 2016; Boylan-Kolchin, 2017; Renaud et al., 2017). Note that these models also allow formation of some of the metal-rich clusters in-situ (also see formation scenarios discussed in Carretta et al., 2010). However, it seems likely that an in-situ stellar halo would possess some residual spin still observable at the present day. Indeed, in the MW, there have been some claims of a detection of an in-situ halo population (see e.g Carollo et al., 2007, 2010). However, given that no substantial rotation has been reported for the Galactic metal-poor halo tracers (see Deason et al., 2017), it is safe to assume that the in-situ contribution to the MW old halo at high Galactic is minimal.
Importantly, given that the debris mixing times are a strong function of Galactocentric radius and that the dynamical friction depends strongly on the satellite’s mass and its orbital parameters, it is naïve to expect the properties of the stellar halo to be the same across the Galaxy. Unfortunately, the exploration of the evolution in the stellar halo’s make-up has been hindered by the excessive cost of running a spectroscopic survey of such an enormous volume at such a low target density. In this Paper, we propose to decipher the fractional contributions of stellar systems of different masses by mapping out the change in the mixture of pulsating RR Lyrae variables.
Our proposed tagging scheme relies on the ideas of Peter Oosterhoff (see Oosterhoff, 1939, 1944) who pointed out striking differences in the period distributions of the RRab stars in GCs. Clusters appear to be separable into two classes, one with a mean period of 0.55 days and another with a period of 0.65 days. The exact explanation of this so-called “Oosterhoff dichotomy” remains to be found (but see Stellingwerf, 1975; Lee et al., 1990; Bono et al., 1997; Clement & Shelton, 1999; Jurcsik et al., 2003; Gratton et al., 2010; Sollima et al., 2014). It has been demonstrated, however, that the stars in the two groups show small but significant differences in pulsation amplitude, color and metallicity, which are related to differences in their masses, luminosities, effective temperatures and iron and helium abundances (see van Albada & Baker, 1973; Sandage, 2004). Based on the holistic examination of the properties of GCs falling into two Oosterhoff groups, the consensus appears to be that the period dichotomy in clusters reflects the difference in their age — e.g. Oosterhoff I objects appear on average younger compared to those of Oo II type (see van den Bergh, 1993c, 2011) — and metallicity (e.g. Sandage, 1993) and thus, most likely, differences in their birth environment (see e.g. Lee & Carney, 1999). Lending further support to the hypothesis of a possible correlation between the Oosterhoff type and the object’s origin is the lack of RR Lyrae belonging to either of the classes in the surviving dSph satellites of the MW. Although it has recently been suggested that internal helium abundance variations brought about by the presence of multiple populations can also play a role in explaining the phenomenon (see e.g. Jang & Lee, 2015; VandenBerg et al., 2016, and references therein). As displayed in e.g. Catelan (2009), (see also Catelan & Smith, 2015, for a more recent discussion), dwarfs appear to be mostly Oosterhoff-intermediate, i.e. falling in-between the two classes as gleaned from the GC analysis.
Presented with the distinct behaviour of RR Lyrae in the period-amplitude space as described above, we put forward a simple observational diagnostic for the genesis of the Galactic field halo population. We propose to shed light onto the likely halo progenitors by mapping out the fraction of the pulsators occupying different locations in the Bailey diagram. This analysis is contingent on the fact that the MW satellites do not contain RRab stars of a particular Oosterhoff type, but rather host mixtures of these (Catelan, 2009). Here, we concentrate in particular on the difference in the 3D distribution of the RRab stars that fall approximately into the Oosterhoff I and II groups (see Section 2 for details). Moreover, motivated by the results presented in Fiorentino et al. (2015), we compare the behavior of these two classes with the spatial evolution of the fraction of the HASP variables. Note that compared to the multitude of the in-depth studies of the Oosterhoff dichotomy in the surviving satellites of the Galaxy, little has been done so far with regards to the field RR Lyrae population. This is not an omission but a delay due to the lack (until recently) of large all-sky RR Lyrae samples.
While precious few in number, several previous studies of the period-amplitude make-up of the MW field population exist. For example, the Oosterhoff dichotomy in the Galactic halo RRab stars is studied in Miceli et al. (2008), who find that within 20-30 kpc from the Galactic center, the Oosterhoff II RRabs follow a steeper radial density law compared to those belonging to the Oosterhoff I group. Zinn et al. (2014) explore not only the field halo but also the prominent halo sub-structures crossing the field-of-view of their deg2 survey, such as the Sgr stream and the Virgo Stellar Stream (VSS). They measure the shape of the stellar halo and see a clear break (see the discussion above) in the radial density law at 25 kpc. While Zinn et al. (2014) detect no noticeable change in the Oosterhoff mixture across the break, they caution that this could simply be due to the small RRL sample size available to them. Concentrating on the Sgr stream, they notice that the stream contains a smaller fraction of short period pulsators (compared to the remnant) and link this to the chemical abundance gradients in the progenitor. Most importantly, they point out a great level of similarity between the period-amplitude distribution in the field halo and in the large sub-structures such the Sgr stream and the VSS. Moving closer to the center of the Galaxy, Kunder & Chaboyer (2009) scrutinize the bulge RR Lyrae population and notice an apparent difference between the period-amplitude distribution of the bulge RR Lyrae and of those elsewhere in the MW. More precisely, they observe a much higher fraction of shorter period objects (at fixed amplitude), which they link to an enhanced metal enrichment, (also see Kunder et al., 2013; Pietrukowicz et al., 2015, for an updated analysis). Based on the observed difference, Kunder & Chaboyer (2009) conjecture that the progenitor of the Galactic bulge ought to be distinct from the halo parent system(s).
This Paper is structured as follows. In Section 2, we describe the sources of the RR Lyrae data used here as well as the selection boundaries in the period-amplitude space. We show how the mixture of RRab stars from different portions of the Bailey diagram evolves with Galactocentric radius in Section 3. The Oosterhoff dichotomy in the currently known most prominent stellar streams is discussed in Section 4. We also look at the amount of small-scale clustering of RRab stars in the halo as a function of their period-luminosity location in Section 4.2. Finally, we provide the summary and the context for this study in Section 5.
2 RR Lyrae data
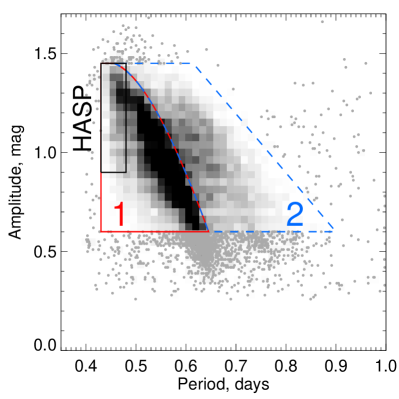
This works relies, in part, on the all-sky RR Lyrae data recently made publicly available by the Catalina Rapid Transient Survey (CRTS). The CRTS sample was released in several installments; we use the two largest subsets, namely the Northern sky as reported in Drake et al. (2013) and the complementary Southern portion analysed in Torrealba et al. (2015). After the cross-match of the two catalogs, 22,700 unique RR Lyrae survive. The distribution of their periods and amplitudes is shown in Figure 1. Note that in this analysis, the CRTS amplitudes are corrected by 0.15 mag as explained in Drake et al. (2013). Here, we use the RR Lyrae distances as published in the above catalogs. To convert to the Galactocentric, we assume a solar radius of 8 kpc. Only RRab stars are considered in this work. These are selected according to the following Period (P) and Amplitude (Amp) criteria:
| (1) |
This first cut ensures that, compared to the bulk of the RRab stars, possible contaminating variables with shorter (a minuscule contamination from RRc stars at short periods and small amplitude is still possible) or longer periods are excluded. Note that we have checked that the results presented below do not change significantly if the lower amplitude boundary is increased. The second cut attempts to minimise the effects of the CRTS selection efficiency related to the pulsation amplitude. Only stars with Amp0.6 are detected out to 50 kpc without a significant loss in completeness. There are RRab stars available after this selection. The Oosterhoff Type I and Type II stars are demarcated by the line given in Equation 11 of Zorotovic et al. (2010) but offset by +0.15 in amplitude, namely
| (2) |
As evidenced by Figure 1, this selection boundary wraps tightly around the over-density of Oosterhoff I stars. Note that according to the above definition, the Class 2 will include both Oosterhoff II and Intermediate objects. From here onwards, we refer to the RRab stars falling within these selection boxes as Type (or Class) 1 and 2 stars.
Finally, we select High Amplitude Short Period (HASP) RR Lyrae according to the following conditions:
| (3) |
We complement the CRTS data with a sample of RR Lyrae stars in globular cluster (GC) and dwarf spheroidal (dSph) satellites of the MW. The GC RR Lyrae are taken from the updated version (see Clement, 2017) of the catalog presented by Clement et al. (2001). Finally, we also use the following catalogues of RR Lyrae stars in the MW dSphs: in Cetus and Tucana by Bernard et al. (2009), in Draco by Kinemuchi et al. (2008), in Fornax by Greco et al. (2009), in Leo 1 by Stetson et al. (2014), in Sculptor by Kaluzny et al. (1995), in the LMC by Soszynski et al. (2003) and in the SMC by Kapakos et al. (2011). For the Sgr dwarf, we use the catalogue of Soszyński et al. (2014) and extract all RR Lyrae within 10 degrees from the center of the dwarf and located between 22 and 31 kpc from the Sun.
3 RRab mixture evolution with Galactocentric radius
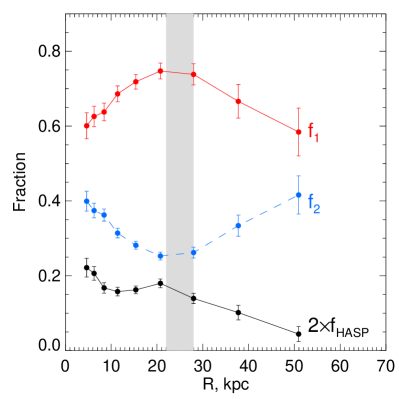
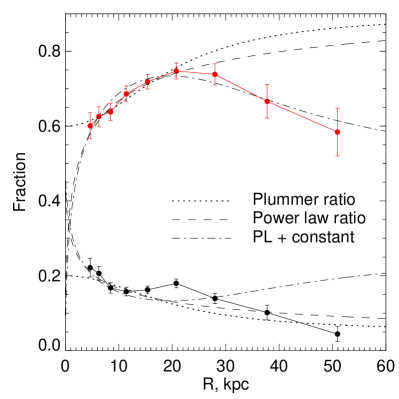
Figure 2 displays the change in the fraction of Type 1 (red) RR Lyrae with respect to all stars selected using Equations 1, e.g. , as a function of Galactocentric radius. By design, , thus . All type fraction come with their associated uncertainties, which are computed by propagating the Poisson errors. Note that for this and other Figures showing the change in the RR Lyrae composition with radius, we apply additional cuts in Galactic height and extinction:
| (4) |
We also exclude the most significant halo sub-structure, i.e. the Sgr Stream (see Figure caption for details). After the three extra cuts, we are left with RRab stars, of these are Type 1, are Type 2 and are HASP. Also shown in Figure 2 is the fraction of Type 2 (HASP) objects in blue (black). While the CRTS completeness is a strong function of magnitude and to lesser extent of position on the sky, we believe that the selection biases affect in equal measure the stars in the three groups considered. This, of course, assumes that there are no dramatic differences in the amplitude distributions of the two classes. However, based on our experiments with the sample selection boundaries, we believe that the fraction curves displayed indicate the actual change in the RR Lyrae mixture throughout the Galaxy. Across the distance range allowed by the data (5-50 kpc), the Type 1 objects dominate, comprising approximately two thirds of the overall RR Lyrae population, in accordance with previous studies (see Miceli et al., 2008; Abbas et al., 2014; Zinn et al., 2014). As the Figure evidently demonstrates, this fraction also varies significantly with radius: drops near the Galactic center, and beyond 30 kpc. The peak in fraction, somewhere between 20 and 30 kpc, appears to match the location of the break in the stellar halo’s radial density profile (see Watkins et al., 2009; Sesar et al., 2011; Deason et al., 2011).
Evidently more dramatic is the change in the HASP fraction. The proportion of the HASP RR Lyrae changes by a factor 5 from 10 around the Galactic center to 2 in the outer halo. Intriguingly, the behavior does not match fully the evolution of : while, similar to Type 1 objects, the proportion of HASP RR Lyrae peaks around 25 kpc, there is an even stronger increase towards low , in the range where keeps declining.
To illustrate the differences in the behavior of Type 1/Type 2/HASP RR Lyrae with radius, Figure 3 presents simple toy models of the fraction evolution: a ratio of power-law (Plummer) density profiles in dashed (dotted) black curves. For the power-law density, we use the indices measured by Miceli et al. (2008), and given in their Equations 28-29, namely, for Class 1 and for Class 2. The density profiles suggested by Miceli et al. (2008) appear to give a reasonable description of the behavior within the distance range probed by their data. Beyond 30 kpc, however, this model does not agree with the CRTS data: it predicts a continuing increase in the fraction of Type 1 stars, while a clear drop is registered. Using a ratio of two Plummer models with scale radii 30 kpc (21 kpc) for Class 1 (2) achieves a marginal improvement, in particular in the very inner portions of the halo, from 5 to 15 kpc.
Given the behaviour out to 30 kpc — as shown in Figures 2 and 3 — one simple explanation of the change in the Galactic RRab mixture is to invoke two types of progenitors. In this scenario, a stellar system with a higher fraction of Type 1 RR Lyrae (Component 1) deposits tidal debris which then relaxes into a distribution with a flatter density profile as compared to the stars left behind by the progenitor(s) with a higher fraction of Type 2 RRab stars (Component 2). Please note that the models shown in Figure 3 assume an extreme case where one type of progenitor contributes all RR Lyrae of a particular type. However, from our experiments with these simple models, it is clear that more realistic values would also hold well against the data. This simple picture gives a convincing explanation of the fractional increase in Type 2 objects at small distances, but seemingly breaks down at large Galactocentric distances, where the is observed to drop again.
Such a drop in fraction (or, equivalently, increase in ) beyond the break radius could possibly be accounted for with an addition of a third progenitor type - that with an extremely flat radial density distribution, as illustrated by the dash-dotted line in Figure 3. This model has an additional component whose density is constant with radius. As evident in the Figure, the contribution of the third component appears to be enough to explain the turnover in the curve beyond 30 kpc. There is perhaps a more prosaic explanation for the peak and the turnover of the curve. Rather than requiring an additional component, such behavior could probably be the result of the difference in sphericity between the Component 1 and 2 debris. The change in the stellar halo flattening with Galactocentric radius has recently been reported in a number of studies (see Xue et al., 2015; Das et al., 2016; Iorio et al., 2017). Quite simply, a significant vertical (with respect to the Galactic disc) flattening of the Component 1 debris would likely result in a decrease of at large radii. Finally, if, as argued by Deason et al. (2013), the break in the stellar halo density is created by the accretion of one massive stellar system, the Component 1 might not be extending much beyond the apo-centre of the host satellite, thus yielding a sharp truncation at around the break and subsequent drop in . This scenario, of course, works very well in conjunction with the previous hypothesis, i.e that of a difference in the component flattening.
The evolution of the fraction of Type 1 RRab stars can be contrasted with the change in the fraction of HASP pulsators, shown as a black solid line in Figures 2 and 3. The HASP fraction evolves in the opposite sense to and out to 15 kpc follows the trend in fraction. Beyond that, it switches from following and starts to track . Apart from a bump in the profile at 20 kpc, it continues to fall precipitously as one moves into the outer halo. In summary, given this distinct evolution, changes in cannot be described by the simple two-component model proposed above. Nonetheless, to illustrate the differences and commonalities between , and , Figure 3 shows the inverted versions of the power law and the Plummer models described above. Clearly, both power-law density ratio and Plummer density ratio can explain crudely the global shape of curve. However, the rise of the HASP fraction at 20 kpc remains unaccounted for. Alternatively, a three component model can match the rise at the halo break radius, but does not have the subsequent fall-off in the outer halo. Also note that the rise and the fall in fraction happens much faster compared to the evolution of and .
3.1 RRab mixture in Galactic satellites
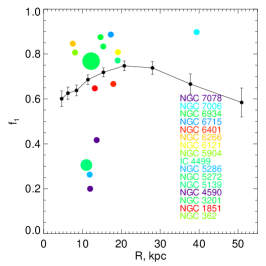
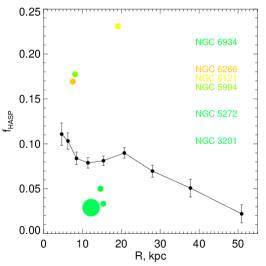
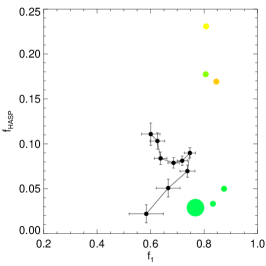
It is instructive to compare the mixture of the field halo RRab with that found in Galactic satellites, such as GCs and dSph galaxies. Figure 4 compares (left panel) and (middle panel) curves for the field halo (as described above) with the corresponding fractions in the GCs at the corresponding distance. The color of the filled circle indicates the metallicity of the cluster, with blue (red) corresponding to low (high) values of [Fe/H]. The size of the circle is proportional to the number of RR Lyrae in the cluster. As described in a number of previous studies , the GCs display a clear Oosterhoff dichotomy: fractions are clustered around 0.3 and 0.8, with few examples of intermediate values. The halo, on the other hand, occupies exactly the range avoided by the GCs, i.e. . Unfortunately, there are not many RR Lyrae-rich GCs in the outer halo - most have extreme HB morphologies, either too red or too blue to produce significant numbers of RR Lyrae. Thus, it is not possible to track the behaviour of cluster with Galactocentric radius, with the majority of the datapoints lying within 20 kpc. With regard to , most GCs do not host as many HASP RRab stars as the field halo at this radius. For a small number of clusters that have more than 1 HASP star, a dichotomy similar to that of Type 1/2 is observed. Note, however, that the cluster data agrees well with the outer halo fraction. Finally, the right panel of Figure 4 gives the track of the field halo in the space spanned by and . Once again, this plot emphasizes the lack of GCs with intermediate (0.5-0.6) values of and (simultaneously) high (0.1) values of .
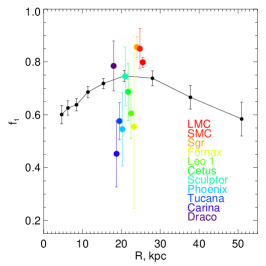
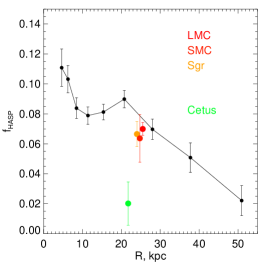
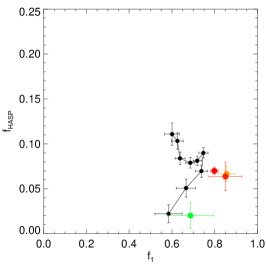
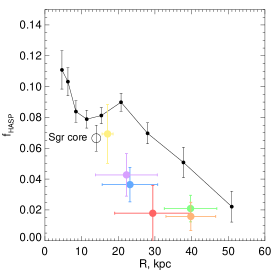
As pointed out in many previous studies, the fraction in dSphs as shown in Figure 5 matches well the range of values in the field halo (left panel). This is the well-known flip-side of the Oosterhoff dichotomy. In the left and right panels, the dSph fractions are not shown at the satellites’ distance but instead are grouped around the fiducial location of 20 kpc. The color of the symbol indicates the total stellar mass of the satellite, with low-mass systems (like Draco and Carina) shown in purple and blue and the largest galaxies (such as the Sgr dwarf and the Clouds) are shown in orange and red. A clear correlation between the stellar mass and the fraction is visible (hints of this correlation are discussed in e.g. Stetson et al., 2014; Fiorentino et al., 2015). Also note that only the most massive systems host enough Type 1 RRab stars (with the exception of Draco) to match the peak in the field halo at 0.75 at 25 kpc. In terms of the HASP population (middle panel), none of the dwarfs can attain observed in the field halo near the Galactic center and at 20 kpc. In fact, only three satellites, namely the Sgr, the SMC and the LMC have enough of the HASP stars to warrant a believable measurement. Curiously, in terms of both and the values, the Sgr dwarf appears to sit around the top of the distribution, thus indirectly confirming that the progenitor system was one of the most massive satellites of the MW in accord with the studies of Niederste-Ostholt et al. (2010) and Gibbons et al. (2017). Finally, as the right panel of Figure 5 illustrates, the values of in the top three most massive dwarfs around the MW are too high while, at the same time, fractions are too low in comparison to the field halo. These results are in good agreement with the earlier measurements by Fiorentino et al. (2015).
4 Halo sub-structure
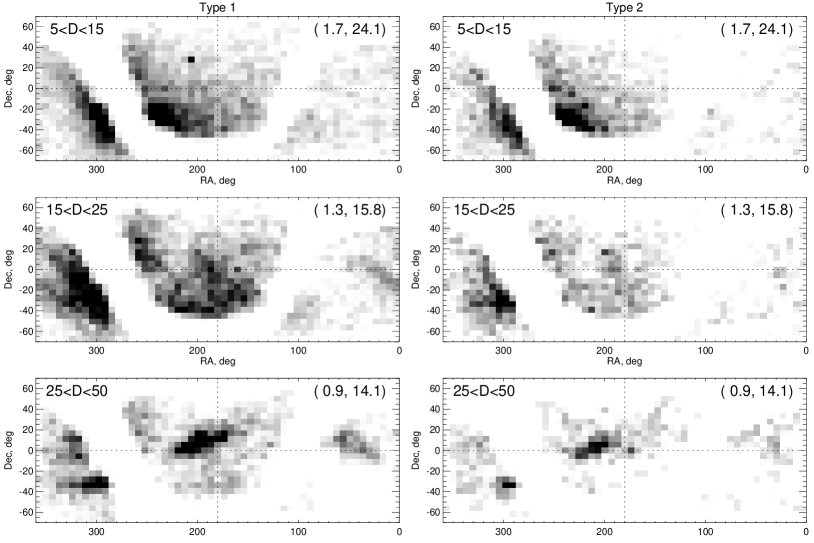
Figure 6 compares density distributions of Type 1 and 2 RR Lyrae at three different heliocentric distances. At each distance, the halo looks remarkably different depending on the RRab type used. The choice between Type 1 and 2 affects the appearance of both the smooth component as well as the sub-structure. The largest streams such as Sgr (see e.g. Majewski et al., 2003; Belokurov et al., 2006) and VSS (see Duffau et al., 2006; Newberg et al., 2007; Duffau et al., 2014) are seen predominantly in the left column, while the narrower/colder Orphan (Belokurov et al., 2007; Grillmair, 2006) is clearly discernible only on the right. Moreover, splitting the halo RRab population according to the position in the Bailey diagrams helps to clarify the sub-structure’s 3D behavior. For example, the Sgr trailing stream separates cleanly into the faint and the bright components (see Koposov et al., 2012) when Type 1 objects are considered. As evidenced by the middle left and bottom left panels of the Figure, these two branches are not only off-set on the sky but also are located at slightly different distances, in agreement with previous measurements (see Slater et al., 2013).
4.1 Stellar Streams
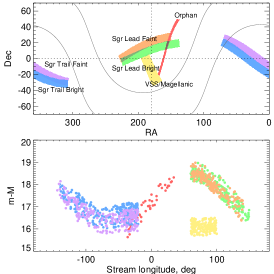
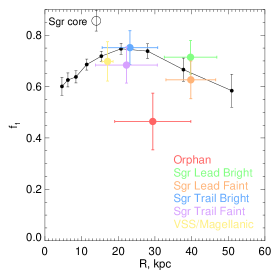
To further study the mixture of RR Lyrae stars in previously identified halo-substructures, we select likely members of the three stellar streams: Sgr, VSS and Orphan. Additionally, we split the Sgr stream into four portions: the trailing and leading tails are each divided into a bright and faint component. The RA, Dec selection boundaries for each stream are shown in the top left panel of Figure 7. These regions are chosen to follow the great circles that approximately match the average stream track on the sky. We aid the 2D selection with a cut on heliocentric distance as illustrated in the bottom left panel of the Figure. The resulting measurements of () fractions are given in the middle (right) panel of the Figure. Note that, even though the selection is performed in 3D, the samples of likely stream members do suffer from field halo contamination. Thus the type fraction estimate are biased towards the typical field value at the corresponding position, in contrast with the measurements in the Galactic satellites where the contamination is essentially negligible.
As the middle and the right panels of Figure 7 demonstrate, even in the presence of some field contamination, a diversity of RRab mixtures is observed in the Galactic stellar streams. The Sgr stream and the VSS possess the highest values of . For Sgr, this is another indication of the high original mass and the relatively fast enrichment history of the progenitor galaxy (see also de Boer et al., 2014, 2015). Additionally, a small but noticeable difference exists between the leading and trailing tails as well as between their bright and faint branches. More precisely, the RRab in the leading tail have slightly lower values of and . Similarly, the faint components have a marginally higher fraction of Type 2 RRab stars. As analysed here, the leading debris is further away from the progenitor compared to the trailing material, and, accordingly, is dynamically older, i.e. stripped earlier. Thus, the difference in the RRab mixture between the leading and trailing tails is in agreement with the metallicity gradients observed previously along the stream (see Monaco et al., 2007; Chou et al., 2010; Hyde et al., 2015). The difference in between the bright and faint branches, if significant, may help to shed light onto the creation of the so-called stream bifurcation (see Belokurov et al., 2006; Koposov et al., 2012). Currently, three models have been put forward to explain the split in the Sgr tails (Fellhauer et al., 2006; Peñarrubia et al., 2010; Gibbons et al., 2016). In all three scenarios, the dynamical age of the debris in the two branches is different, which can be exploited to link back to the stellar populations gradients in the progenitor before the in-fall. Superficially, the slightly lower values of for the faint branch debris are consistent with the previous constraints on the difference in metal-enrichment history of the parts of the bifurcation (Koposov et al., 2012; de Boer et al., 2015).
For the VSS, the elevated fractions and may signify much higher levels of contamination, which is not surprising given that this is the “fluffiest” structure of the ones considered here. Alternatively, this could be a clue that the VSS originated in a massive accretion event. For example, Boubert et al. (2017) have recently extended the view of the stream further below the celestial equator and pointed out that the VSS is perfectly aligned with the Magellanic Stream (MS), thus speculating that the structure is nothing else but the leading arm of the disrupting MCs. Note that in all simulations of the MS, the stream is produced by stripping the SMC rather than the LMC. Therefore, to test the hypothesis of the VSS origin, one ought to compare the stellar populations in the stream to those reported for the SMC. According to the studies of Duffau et al. (2006) and Duffau et al. (2014), the mean metallicity of the RR Lyrae in the VSS is , which agrees well with the measurement of [Fe/H] for the RR Lyrae in the SMC (see Haschke et al., 2012). Intriguingly, a stream-like alignment of several GCs coincident with the VSS was reported by Yoon & Lee (2002). However, unlike the stellar component of the VSS, the GCs in the alleged stream represent a metal-poor sub-group of the Oosterhoff II objects.
4.2 Clustering properties
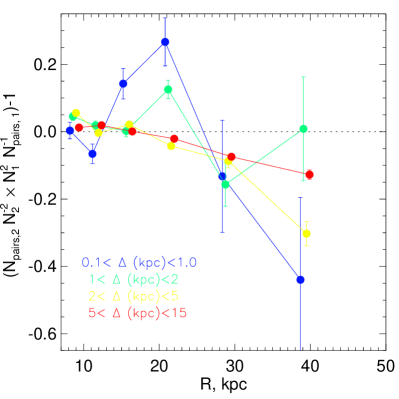
Given the correlation of the fraction of Type 1 and 2 RRab stars with the stellar mass in both the surviving dwarfs and the remnant streams (see Section 4.1), it is plausible that the clustering properties of the smooth, i.e. well-mixed, stellar halo also depend on the . To this end, Figure 8 gives the ratio of the number of pairs of RRab stars of Type 2 to Type 1 as a function of radius for four different 3D separation scales. In other words, we consider all combinations of two stars that fall in the same radial bin and have 3D separation less than the given scale. RR Lyrae of both types are affected by the CRTS selection biases. However, as we take a ratio of the pair numbers, most of the effects due to efficiency variations should cancel out. Note that for this calculation at each galacto-centric radius, the number of observed pairs is scaled by the square of the total number of stars in order to take into account the differences in the density distributions of the RRab stars of the two types. Furthermore, it is possible that there exist significant differences in the large-scale on-sky distributions of the RR Lyrae in some radial ranges. These - if indeed present - can then bias our estimates of the relative clustering properties.
As the Figure demonstrates, three distinct regimes may exist in the Galactic stellar halo. In the inner 10-15 kpc, the clustering properties of Type 1 and 2 are approximately equal. This is followed by an excess in Type 2 pair numbers out to 25-30 kpc. Beyond that, the Type 1 appears relatively more clustered on all scales from sub-kpc to 10 kpc. On the scales of 1-2 kpc and smaller, an excess of clustering exists in the distribution of Type 2 RRab stars compared to that of Type 1, at the Galactocentric distances between 15 and 30 kpc. The elevated number of Type 2 pairs in this radial range can be interpreted as an increase in clumping of these RR Lyrae. However, taking into account the behavior of and fractions (see Figure 2), it is more likely caused by a reduction in clustering of Type 1 stars, thus implying that this portion of the Galactic halo is dominated by the debris from a relatively massive progenitor system.
5 Discussion and Conclusions
This Paper demonstrates that in the MW field halo, there exists a strong evolution of the mixture of RRab stars as a function of Galactocentric radius. More precisely, the fraction of Type 1 (approximately corresponding to Oosterhoff Type I) stars changes from 60 in the inner 10-15 kpc to 75 at 25 kpc, falling back to 60 beyond 40 kpc. There is a remarkable agreement between the location of the bump in the fraction and the break in the radial density of the stellar halo (see Watkins et al., 2009; Deason et al., 2011; Sesar et al., 2011). As such, our results are in direct contradiction with those presented in Zinn et al. (2014), but we attribute the disagreement to the differences in the size of RR Lyrae samples used. The behavior can be compared to the change in the fraction of HASP RRab variables. The ratio also shows an increase at around 20 kpc and an even steeper fall-off beyond 30 kpc, where the HASP fraction drops by a factor of 5. Unlike the Type 1 RRab profile, however, there appears to be an excess of HASP RR Lyrae close to the Galactic centre, i.e. within 10 kpc or so. Using simple toy models of the stellar halo, we show that the contribution from at least three different accretion components is required to explain the patterns in the and fractions. As we elucidate in Section 3, one plausible interpretation of the peak in both and fractions at 25 kpc is a combination of i) different flattening of the RR Lyrae with shorter period and ii) a sharp truncation of the distribution of the RR Lyrae with short periods. Both of these conditions may be accommodated in a scenario with an early accretion of a single massive system (see Deason et al., 2013).
To help calibrate the and estimates, we also analyze the mixture of RRab stars in the surviving MW satellites, such as GCs and dwarfs spheroidals (see Figures 4 and 5). As noted previously by many authors, the GCs show a clear dichotomy, with some preferring low values of and some high. The dSphs, on the other hand, tend to have intermediate values of . While many of the GCs lie either too low or too high compared to the in the field halo, dSphs appear to match the range of the observed halo Type 1 fraction much better. We register a correlation between the dwarf’s stellar mass and , with the three most massive satellites, namely Sgr, the SMC and the LMC, reaching , slightly above the halo peak of . Even though there exist objects amongst both the GCs and the dSphs with sufficiently high values, neither of the two satellite classes contains fractions of HASP RR Lyrae similar to the halo. The bulk of the GCs and the dSphs (including the most massive ones) contain a factor of two lower numbers of HASP variables. There is a small number of GCs with fractions a factor of 1.5 higher compared to the peak of the field halo. However, as the right panel of Figure 4 illustrates, the exact combination of intermediate and elevated is not realised in any of the surviving satellites, be it a GC or a dSph.
Stepping aside from studying the average properties of the RR Lyrae mixture in the field, maps of the RRab density shown in Figure 6 reveal striking differences in the properties of the stellar halo depending on the Type of the pulsator used. We choose three well-known halo sub-structures whose 3D properties have been mapped out previously, namely the Sgr Stream, the Virgo Stellar Stream and the Orphan Stream. We detect hints of evolution of along the Sgr tails, as well as subtle differences between the bright and the faint branches of the stream. We hypothesize that our measurements are consistent with chemical abundances gradients in the progenitor. If confirmed, these ought to help elucidate the models of the Sgr dwarf disruption and the genesis of the stream bifurcation. Surprisingly, we find that the VSS possesses high values of both and , which would imply its origin in a massive galaxy, perhaps similar to the SMC. If not a result of a field halo contamination our measurement lends support to the recent discovery of Boubert et al. (2017), who point out a close connection between the extended view of the VSS they uncover and the Magellanic Clouds. Finally, the Orphan Stream contains the lowest fraction of the Type 1 RR Lyrae, , which, given a likely non-zero contamination is only an upper bound on its true . Our measurement of for the Orphan Stream has two important consequences. First, it hints at the possibility of extending the -mass relationship to lower mass objects, such as ultra-faint dwarfs. Second, it shows that the search for low-mass sub-structure in the halo can be significantly improved by using a particular sub-set of RRab stars, more precisely those with lower values of .
What is the most straightforward interpretation of the radial evolution of fraction as shown in Figure 2? Given the correlation between the stellar mass and the fraction exhibited by the dSphs currently on orbit around the MW, the Galactic profile may simply be a reflection of the change in the fractional contribution of the halo progenitors of different masses. In other words, at distances below 15 kpc and beyond 40 kpc where is at its lowest, an enhanced contribution from lower mass systems is expected. Between 15 and 30 kpc, where the peaks in both and are observed, the stellar halo is dominated by the debris from a massive progenitor — a hypothesis similar to the halo break theory put forward by Deason et al. (2013). To test this conjecture, we analyse a suite of Cosmological zoom-in simulations of MW halo formation. The details of the simulations can be found in Jethwa et al. (2016). In essence, the six simulated stellar halos considered here sample a range of MW masses and capture some of the effects induced by the baryons present in the real Galaxy, i.e. the action of the disc. The baryonic disc is implemented parametrically and is grown adiabatically between redshifts 3 and 1. To create the stellar halo, the most bound dark matter particles in each in-falling sub-halo are tagged as stars. This is done by determining when each subhalo reaches its peak mass and then assigning it a stellar mass of
| (5) |
similar to the approach in De Lucia & Helmi (2008); Bailin et al. (2014). In order to only sample the stellar halo, stars within 2 tidal radii of the remaining subhaloes at are excluded.
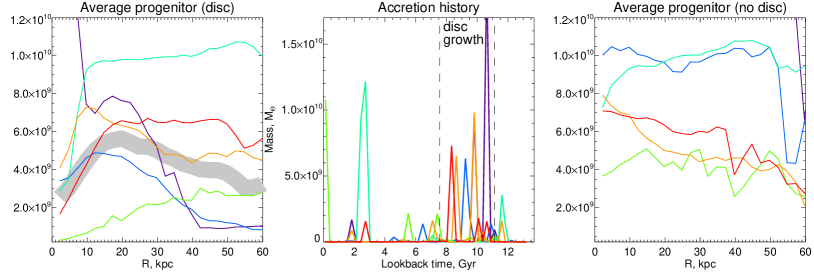
The left panel of Figure 9 presents the average progenitor stellar mass as a function of Galactocentric radius in the six simulated halos whose accretion histories are displayed in the middle panel. All (but one) halos display a drop in the average progenitor mass at small distances from the halo’s center. The fake MWs with extended or recent accretion (shades of green) display a flat mass profile across the range of distances considered here, i.e. between 20 and 70 kpc. Those halos whose accretion history peaked early, i.e. those colored purple, blue, orange and red all show a drop in the average progenitor mass beyond 30-60 kpc. Clearly, the exact shape of the mean progenitor mass profile is very sensitive to the details of the host accretion history, which cannot be exhaustively sampled with a small number of simulations presented here. For illustration purposes, we also show a combination of the two mean mass profiles (for the halos shown in red and blue) as a thick grey line. As demonstrated in the Figure, MWs with an accretion history peaking between 8 and 10 Gyr ago can indeed possess a stellar halo with a characteristic bump in the mean progenitor mass profile, i.e. very similar to the one implied by the RRab studies presented here. Curiously, as shown in the right panel of Figure 9, the corresponding zoom-in simulations without a disc do not show any of the trends discussed above. Regardless of the accretion history, between 5 and 50 kpc, the mean progenitor mass profiles appear rather flat. We therefore conclude that the changes in the mean mass profile as seen in the left panel of the Figure are put in place by the action of the disc. As the disc grows from 11 to 8 Gyr ago, it helps to migrate the stellar debris accumulated so far from the outer parts of the halo into the inner regions. Around the Galactic enter, this “debris sorting” induced by the disc growth creates an excess of the material accreted the earliest (11-13 Gyr) — and thus mostly contributed by the lower mass objects (as bigger dwarfs require some time to grow before falling into the MW). The stars stripped from the larger systems later on (8-11 Gyr) are moved closer to the Galactic center but can not be packed as tightly hence resulting in over-density at intermediate radii (20-30 kpc). Therefore, the three stellar halo components required by the RR Lyrae mixture changes could be i) the debris from low-mass objects accreted early (10-13 Gyr) and contributing to the inner region of the halo today (15 kpc), ii) material from a massive system merging with the MW between 8 and 11 Gyr ago and dominating the halo at the distances between 10 and 30 kpc and iii) the stars from the rest of the unlucky Galactic satellites fallen into the MW during its lifetime.
To summarize, the changes in the RRab mixture with radius can be explained with the evolution of the relative contribution of progenitors of different masses. Given the behavior of , the field halo at low and high Galactocentric distances may be dominated by debris from systems not unlike a typical dSph observed around the MW today. The intermediate distances in the Galaxy appear to have an increased contribution from the most massive systems, perhaps as massive as Sgr/SMC/LMC. However, the exact nature of such a “giant dwarf” progenitor is unclear as the halo’s fraction at these distances is almost twice that of the most massive surviving dwarf (LMC). Of course, such an ancient progenitor system could not necessarily be a replica of the LMC. Note that the LMC had had a prolonged period of inactivity, restarting star-formation in earnest only 5 Gyrs ago (see Harris & Zaritsky, 2009). The hypothesised halo progenitor, on the other hand, evolved much closer to the MW, and thus likely had a different — probably, faster — enrichment history. If a large portion of Type 1 RR Lyrae stars around the 15-30 kpc has indeed been contributed via an early merger with a massive system, it may be possible to pick up tracers of this accretion event in the kinematics of stars in the future Gaia data releases. Note that many Oosterhoff I GCs tend to prefer retrograde orbits according to van den Bergh (1993b, a) who suggested the merger of a massive ancestral object(s) on a retrograde orbit as the origin of the MW’s OoI component. With regards to the short period RRab stars, it appears rather plausible that the sharp rise in near the Galactic center is due to the bulge, in agreement with the earlier studies of Kunder & Chaboyer (2009). Finally, our hypothesis of the strong evolution in the mass of the “typical” contributing progenitor as a function of Galactocentric radius appears to be supported by the tentative results of the clustering analysis of the RRab stars presented in Section 4.2 and by the comparison to the Cosmological zoom-in simulations of the MW halo formation in the presence of a baryonic disc.
The ideas discussed here are complementary to the analysis of the stellar population mixture as encoded in colour-magnitude space (see e.g. de Jong et al., 2010) and has many similarities with other studies of variations in the ratio of distinct halo tracers (see Bell et al., 2010; Deason et al., 2015; Price-Whelan et al., 2015). Given the diversity of the behaviour of the simple test statistics proposed here, such as and fractions, we surmise that the distribution of RR Lyrae in the period-amplitude space appears to be unique enough to be used as a progenitor fingerprint. In particular, it may be possible to use it to tease out signatures of the accretion of low-mass satellites. There is also an added value in being able to leverage the unique properties of the RR Lyrae as standard candles to disentangle the hotchpotch of the stellar halo in 3D. All in all, in the view of the imminent Gaia DR2 release, unmixing the Galactic halo with RR Lyrae tagging should become feasible in the near future.
Acknowledgments
The authors wish to thank Kathryn Johnston and Douglas Boubert for stimulating discussions that helped to improve this paper. VB is grateful to Natàlia Mora-Sitjà for the careful proof-reading of the manuscript.
The research leading to these results has received funding from the European Research Council under the European Union’s Seventh Framework Programme (FP/2007-2013) / ERC Grant Agreement n. 308024. A.D. is supported by a Royal Society University Research Fellowship. A.D. also acknowledges support from the STFC grant ST/P000451/1. NWE thanks the Center for Computational Astrophysics for hospitality during a working visit.
The authors gratefully acknowledge support by CONICYT/RCUK’s PCI program through grant DPI20140066 (“Newton Funds”). M.C. is additionally supported by the Ministry for the Economy, Development, and Tourism’s Millennium Science Initiative through grant IC 120009, awarded to the Millennium Institute of Astrophysics (MAS); by Proyecto Basal PFB-06/2007; and by FONDECYT grant #1171273.
References
- Abbas et al. (2014) Abbas M. A., Grebel E. K., Martin N. F., Burgett W. S., Flewelling H., Wainscoat R. J., 2014, MNRAS, 441, 1230
- Allende Prieto et al. (2008) Allende Prieto C., et al., 2008, Astronomische Nachrichten, 329, 1018
- Bailin et al. (2014) Bailin J., Bell E. F., Valluri M., Stinson G. S., Debattista V. P., Couchman H. M. P., Wadsley J., 2014, ApJ, 783, 95
- Battaglia et al. (2017) Battaglia G., North P., Jablonka P., Shetrone M., Minniti D., Díaz M., Starkenburg E., Savoy M., 2017, preprint, (arXiv:1710.01320)
- Bekki & Tsujimoto (2016) Bekki K., Tsujimoto T., 2016, ApJ, 831, 70
- Bell et al. (2010) Bell E. F., Xue X. X., Rix H.-W., Ruhland C., Hogg D. W., 2010, AJ, 140, 1850
- Belokurov et al. (2006) Belokurov V., et al., 2006, ApJ, 642, L137
- Belokurov et al. (2007) Belokurov V., et al., 2007, ApJ, 658, 337
- Bensby et al. (2014) Bensby T., Feltzing S., Oey M. S., 2014, A&A, 562, A71
- Bernard et al. (2009) Bernard E. J., et al., 2009, ApJ, 699, 1742
- Blanco-Cuaresma et al. (2015) Blanco-Cuaresma S., et al., 2015, A&A, 577, A47
- Bland-Hawthorn et al. (2010) Bland-Hawthorn J., Krumholz M. R., Freeman K., 2010, ApJ, 713, 166
- Bono et al. (1997) Bono G., Caputo F., Castellani V., Marconi M., 1997, A&AS, 121, 327
- Boubert et al. (2017) Boubert D., Belokurov V., Erkal D., Iorio G., 2017, preprint, (arXiv:1707.03833)
- Bovy (2016) Bovy J., 2016, ApJ, 817, 49
- Boylan-Kolchin (2017) Boylan-Kolchin M., 2017, MNRAS, 472, 3120
- Carollo et al. (2007) Carollo D., et al., 2007, Nature, 450, 1020
- Carollo et al. (2010) Carollo D., et al., 2010, ApJ, 712, 692
- Carretta et al. (2010) Carretta E., Bragaglia A., Gratton R. G., Recio-Blanco A., Lucatello S., D’Orazi V., Cassisi S., 2010, A&A, 516, A55
- Catelan (2009) Catelan M., 2009, Ap&SS, 320, 261
- Catelan & Smith (2015) Catelan M., Smith H. A., 2015, Pulsating Stars
- Chou et al. (2010) Chou M.-Y., Cunha K., Majewski S. R., Smith V. V., Patterson R. J., Martínez-Delgado D., Geisler D., 2010, ApJ, 708, 1290
- Chung et al. (2016) Chung C., Lee Y.-W., Pasquato M., 2016, MNRAS, 456, L1
- Clement (2017) Clement C. M., 2017, VizieR Online Data Catalog, 5150
- Clement & Shelton (1999) Clement C. M., Shelton I., 1999, ApJ, 515, L85
- Clement et al. (2001) Clement C. M., et al., 2001, AJ, 122, 2587
- Cui et al. (2012) Cui X.-Q., et al., 2012, Research in Astronomy and Astrophysics, 12, 1197
- Das et al. (2016) Das P., Williams A., Binney J., 2016, MNRAS, 463, 3169
- De Lucia & Helmi (2008) De Lucia G., Helmi A., 2008, MNRAS, 391, 14
- De Silva et al. (2007) De Silva G. M., Freeman K. C., Asplund M., Bland-Hawthorn J., Bessell M. S., Collet R., 2007, AJ, 133, 1161
- De Silva et al. (2015) De Silva G. M., et al., 2015, MNRAS, 449, 2604
- Deason et al. (2011) Deason A. J., Belokurov V., Evans N. W., 2011, MNRAS, 416, 2903
- Deason et al. (2013) Deason A. J., Belokurov V., Evans N. W., Johnston K. V., 2013, ApJ, 763, 113
- Deason et al. (2015) Deason A. J., Belokurov V., Weisz D. R., 2015, MNRAS, 448, L77
- Deason et al. (2017) Deason A. J., Belokurov V., Koposov S. E., Gómez F. A., Grand R. J., Marinacci F., Pakmor R., 2017, MNRAS, 470, 1259
- Drake et al. (2013) Drake A. J., et al., 2013, ApJ, 763, 32
- Duffau et al. (2006) Duffau S., Zinn R., Vivas A. K., Carraro G., Méndez R. A., Winnick R., Gallart C., 2006, ApJ, 636, L97
- Duffau et al. (2014) Duffau S., Vivas A. K., Zinn R., Méndez R. A., Ruiz M. T., 2014, A&A, 566, A118
- Fellhauer et al. (2006) Fellhauer M., et al., 2006, ApJ, 651, 167
- Fiorentino et al. (2015) Fiorentino G., et al., 2015, ApJ, 798, L12
- Font et al. (2006) Font A. S., Johnston K. V., Bullock J. S., Robertson B. E., 2006, ApJ, 638, 585
- Freeman & Bland-Hawthorn (2002) Freeman K., Bland-Hawthorn J., 2002, ARA&A, 40, 487
- Gibbons et al. (2016) Gibbons S. L. J., Belokurov V., Erkal D., Evans N. W., 2016, MNRAS, 458, L64
- Gibbons et al. (2017) Gibbons S. L. J., Belokurov V., Evans N. W., 2017, MNRAS, 464, 794
- Gilmore et al. (2012) Gilmore G., et al., 2012, The Messenger, 147, 25
- Gratton et al. (2010) Gratton R. G., Carretta E., Bragaglia A., Lucatello S., D’Orazi V., 2010, A&A, 517, A81
- Gratton et al. (2012) Gratton R. G., Carretta E., Bragaglia A., 2012, A&ARv, 20, 50
- Greco et al. (2009) Greco C., et al., 2009, ApJ, 701, 1323
- Grillmair (2006) Grillmair C. J., 2006, ApJ, 645, L37
- Harris & Zaritsky (2009) Harris J., Zaritsky D., 2009, AJ, 138, 1243
- Haschke et al. (2012) Haschke R., Grebel E. K., Duffau S., Jin S., 2012, AJ, 143, 48
- Helmi et al. (2006) Helmi A., Navarro J. F., Nordström B., Holmberg J., Abadi M. G., Steinmetz M., 2006, MNRAS, 365, 1309
- Hyde et al. (2015) Hyde E. A., et al., 2015, ApJ, 805, 189
- Iorio et al. (2017) Iorio G., Belokurov V., Erkal D., Koposov S. E., Nipoti C., Fraternali F., 2017, preprint, (arXiv:1707.03833)
- Jang & Lee (2015) Jang S., Lee Y.-W., 2015, ApJS, 218, 31
- Jethwa et al. (2016) Jethwa P., Belokurov V., Erkal D., 2016, preprint, (arXiv:1612.07834)
- Jurcsik et al. (2003) Jurcsik J., Benkő J. M., Bakos G. Á., Szeidl B., Szabó R., 2003, ApJ, 597, L49
- Kaluzny et al. (1995) Kaluzny J., Kubiak M., Szymanski M., Udalski A., Krzeminski W., Mateo M., 1995, A&AS, 112, 407
- Kapakos et al. (2011) Kapakos E., Hatzidimitriou D., Soszyński I., 2011, MNRAS, 415, 1366
- Kinemuchi et al. (2008) Kinemuchi K., Harris H. C., Smith H. A., Silbermann N. A., Snyder L. A., La Cluyzé A. P., Clark C. L., 2008, AJ, 136, 1921
- Koposov et al. (2012) Koposov S. E., et al., 2012, ApJ, 750, 80
- Kruijssen (2015) Kruijssen J. M. D., 2015, MNRAS, 454, 1658
- Kunder & Chaboyer (2009) Kunder A., Chaboyer B., 2009, AJ, 138, 1284
- Kunder et al. (2013) Kunder A., Stetson P. B., Catelan M., Walker A. R., Amigo P., 2013, AJ, 145, 33
- Lee & Carney (1999) Lee J.-W., Carney B. W., 1999, AJ, 118, 1373
- Lee et al. (1990) Lee Y.-W., Demarque P., Zinn R., 1990, ApJ, 350, 155
- Majewski et al. (2003) Majewski S. R., Skrutskie M. F., Weinberg M. D., Ostheimer J. C., 2003, ApJ, 599, 1082
- Majewski et al. (2012) Majewski S. R., Nidever D. L., Smith V. V., Damke G. J., Kunkel W. E., Patterson R. J., Bizyaev D., García Pérez A. E., 2012, ApJ, 747, L37
- Majewski et al. (2017) Majewski S. R., et al., 2017, AJ, 154, 94
- Martell & Grebel (2010) Martell S. L., Grebel E. K., 2010, A&A, 519, A14
- Martell et al. (2011) Martell S. L., Smolinski J. P., Beers T. C., Grebel E. K., 2011, A&A, 534, A136
- Miceli et al. (2008) Miceli A., et al., 2008, ApJ, 678, 865
- Minchev et al. (2013) Minchev I., Chiappini C., Martig M., 2013, A&A, 558, A9
- Minchev et al. (2014) Minchev I., Chiappini C., Martig M., 2014, A&A, 572, A92
- Mitschang et al. (2014) Mitschang A. W., De Silva G., Zucker D. B., Anguiano B., Bensby T., Feltzing S., 2014, MNRAS, 438, 2753
- Monaco et al. (2007) Monaco L., Bellazzini M., Bonifacio P., Buzzoni A., Ferraro F. R., Marconi G., Sbordone L., Zaggia S., 2007, A&A, 464, 201
- Ness et al. (2017) Ness M., et al., 2017, preprint, (arXiv:1701.07829)
- Newberg et al. (2007) Newberg H. J., Yanny B., Cole N., Beers T. C., Re Fiorentin P., Schneider D. P., Wilhelm R., 2007, ApJ, 668, 221
- Niederste-Ostholt et al. (2010) Niederste-Ostholt M., Belokurov V., Evans N. W., Peñarrubia J., 2010, ApJ, 712, 516
- Oosterhoff (1939) Oosterhoff P. T., 1939, The Observatory, 62, 104
- Oosterhoff (1944) Oosterhoff P. T., 1944, Bull. Astron. Inst. Netherlands, 10, 55
- Peñarrubia et al. (2010) Peñarrubia J., Belokurov V., Evans N. W., Martínez-Delgado D., Gilmore G., Irwin M., Niederste-Ostholt M., Zucker D. B., 2010, MNRAS, 408, L26
- Pietrukowicz et al. (2015) Pietrukowicz P., et al., 2015, ApJ, 811, 113
- Price-Whelan et al. (2015) Price-Whelan A. M., Johnston K. V., Sheffield A. A., Laporte C. F. P., Sesar B., 2015, MNRAS, 452, 676
- Renaud et al. (2017) Renaud F., Agertz O., Gieles M., 2017, MNRAS, 465, 3622
- Roškar et al. (2008) Roškar R., Debattista V. P., Quinn T. R., Stinson G. S., Wadsley J., 2008, ApJ, 684, L79
- Sandage (1993) Sandage A., 1993, AJ, 106, 687
- Sandage (2004) Sandage A., 2004, AJ, 128, 858
- Schönrich & Binney (2009) Schönrich R., Binney J., 2009, MNRAS, 396, 203
- Sesar et al. (2011) Sesar B., Jurić M., Ivezić Ž., 2011, ApJ, 731, 4
- Slater et al. (2013) Slater C. T., et al., 2013, ApJ, 762, 6
- Sollima et al. (2014) Sollima A., Cassisi S., Fiorentino G., Gratton R. G., 2014, MNRAS, 444, 1862
- Soszynski et al. (2003) Soszynski I., et al., 2003, Acta Astron., 53, 93
- Soszyński et al. (2014) Soszyński I., et al., 2014, Acta Astron., 64, 177
- Stellingwerf (1975) Stellingwerf R. F., 1975, ApJ, 195, 441
- Stetson et al. (2014) Stetson P. B., Fiorentino G., Bono G., Bernard E. J., Monelli M., Iannicola G., Gallart C., Ferraro I., 2014, PASP, 126, 616
- Ting et al. (2015) Ting Y.-S., Conroy C., Goodman A., 2015, ApJ, 807, 104
- Tolstoy et al. (2009) Tolstoy E., Hill V., Tosi M., 2009, ARA&A, 47, 371
- Torrealba et al. (2015) Torrealba G., et al., 2015, MNRAS, 446, 2251
- VandenBerg et al. (2016) VandenBerg D. A., Denissenkov P. A., Catelan M., 2016, ApJ, 827, 2
- Venn et al. (2004) Venn K. A., Irwin M., Shetrone M. D., Tout C. A., Hill V., Tolstoy E., 2004, AJ, 128, 1177
- Watkins et al. (2009) Watkins L. L., et al., 2009, MNRAS, 398, 1757
- Xue et al. (2015) Xue X.-X., Rix H.-W., Ma Z., Morrison H., Bovy J., Sesar B., Janesh W., 2015, ApJ, 809, 144
- Yoon & Lee (2002) Yoon S.-J., Lee Y.-W., 2002, Science, 297, 578
- Zinn et al. (2014) Zinn R., Horowitz B., Vivas A. K., Baltay C., Ellman N., Hadjiyska E., Rabinowitz D., Miller L., 2014, ApJ, 781, 22
- Zorotovic et al. (2010) Zorotovic M., et al., 2010, AJ, 139, 357
- de Boer et al. (2014) de Boer T. J. L., Belokurov V., Beers T. C., Lee Y. S., 2014, MNRAS, 443, 658
- de Boer et al. (2015) de Boer T. J. L., Belokurov V., Koposov S., 2015, MNRAS, 451, 3489
- de Jong et al. (2010) de Jong J. T. A., Yanny B., Rix H.-W., Dolphin A. E., Martin N. F., Beers T. C., 2010, ApJ, 714, 663
- van Albada & Baker (1973) van Albada T. S., Baker N., 1973, ApJ, 185, 477
- van den Bergh (1993a) van den Bergh S., 1993a, AJ, 105, 971
- van den Bergh (1993b) van den Bergh S., 1993b, MNRAS, 262, 588
- van den Bergh (1993c) van den Bergh S., 1993c, ApJ, 411, 178
- van den Bergh (2011) van den Bergh S., 2011, PASP, 123, 1044