e-mail matthias.schrade@smn.uio.no
Using the Callaway model to deduce relevant phonon scattering processes: The importance of phonon dispersion
Abstract
The thermal conductivity of a material is an important parameter in many different applications. Optimization strategies of often require insight into the dominant phonon scattering processes of the material under study. The Callaway model is widely used as an experimentalist’s tool to analyze the lattice part of the thermal conductivity, . Here, we investigate how deviations from the implicitly assumed linear phonon dispersion relation affect and in turn conclusions regarding the relevant phonon scattering processes. As an example, we show for the half-Heusler system (Hf,Zr,Ti)NiSn, that relying on the Callaway model in its simplest form has earlier resulted in a misinterpretation of experimental values by assigning the low measured with unphysically strong phonon scattering in these materials. Instead, we propose an implementation of more realistic phonon dispersion curves, combined with empirical expressions for typical phonon scattering processes, which leads to far better quantitative agreement with both theoretical and experimental values. This method can easily be extended to other materials with known phonon dispersion relations.
1 Introduction
The thermal conductivity is an important material property in many applications operating at room temperature or above, including for example heat management in integrated circuit design [1], protective coatings [2], and thermoelectrics [3]. usually has contributions from electronic charge carriers, , and lattice vibrations, . For a given material, can be modified by microstructural engineering and the control of phonon scattering centers, while is rigidly connected to the electrical conductivity via the Wiedemann-Franz law. For applications, where both the thermal and electrical conductivity are important for the optimization of performance, only can be independently optimized, and thus can become of prime importance for optimizing the thermal conductivity [4, 5]. Deducing the relevant microscopic phonon scattering processes from the experimentally measured, macroscopic is often challenging, but required in order to develop efficient strategies to optimize for the given application.
Density functional theory (DFT) based ab initio methods scale unfavorably with the system size, due to the need for higher order perturbation terms, and therefore require high, cost-intensive computational power. Despite enormous progress during the last years [6, 7, 8, 9, 10, 11, 12, 13, 14, 15], these methods are still mainly used to describe specific, well defined material systems, so that fast, routine analysis of experimental data is not feasible at the moment. Therefore, experimental data is still often analyzed using simplified models developed decades ago.
A much used simplified model is the "Callaway model", which is based on the Debye treatment of phonons and calculates the lattice thermal conductivity of a material via an effective phonon relaxation time [16].111Here, we study at temperatures equal or larger than the Debye temperature, where are considered to dominate over processes. We therefore neglect processes in the present paper. In its common form, the Callaway model is implicitly assuming a linear phonon dispersion throughout the 1 Brillouin zone (1.BZ). Under this assumption, the group velocity, , is constant and identical to the phase velocity, , and sound velocity, .
However, real materials all show deviations from the simple idealized dispersion, and the goal of the present paper is to demonstrate the errors introduced in the calculated lattice thermal conductivity by using the standard Callaway model. By implementing a simple phonon dispersion into the model, we show that it gives a significantly better agreement with results obtained by experimental and higher-level theoretical methods. This generalization can easily be extended to other material systems, to deduce the relevant phonon scattering processes from experimental data, without the computational cost of an ab initio based theoretical analysis.
2 Calculation of thermal conductivity
Within the limits of the relaxation time approximation and neglecting the small influence of -processes at elevated temperatures, of the -th acoustic phonon mode is generally given as [17]
| (1) |
where is the spectral specific heat, the relaxation time, and the group velocity of this mode. All phonons up to a maximum cut-off frequency are considered in the integral. The total lattice thermal conductivity is then obtained as a sum over the contributions from the two transversal and the one longitudinal acoustic modes.[18, 19] As many parameters entering the calculations are only reported in the literature as an average over the three acoustic modes, we here use these average values instead to ease comparison with reported results. For example, the average sound velocity is related to the velocity of the longitudinal, and tranversal modes, via [20]. Adding the contributions of the three acoustic phonon branches, using the Debye expression for the specific heat, and , Eq. (1) can be rewritten as [21, 18]
| (2) |
When further assuming a linear dispersion, i.e. , Eq. (2) simplifies to the commonly used "Callaway expression" [22]
| (3) |
As a model system, we choose here the half-Heusler NiSn, (), which has attracted considerable interest due to the combination of environmental abundance, non-toxicity, and promising thermoelectric properties [24]. In order to decrease the high of these alloys, mass disorder on the site has been widely investigated [25, 26, 27, 28, 29]. Xie et al. concluded on a dominating role of electron-phonon scattering in a wide phonon frequency range to describe the experimentally obtained of these materials [29]. Their analysis was based on Eq. 3 in combination with empirical expressions for the scattering times of the individual scattering processes. However, the scattering rate for electron-phonon scattering should scale with the concentration of free electrons in the system. If electron-phonon scattering was a dominant contribution to the total of NiSn, one should observe a significant reduction of with increasing charge carrier concentration. However, in systematic doping studies, shows no clear trend with varying carrier concentration [25, 30, 31]. On the contrary, we have recently reported the good agreement of experimental values of for NiSn and ab initio DFT calculations, without taking into account electron-phonon scattering [32]. In the following, we will therefore use those reported DFT values [33] as an experimentally confirmed reference for the analysis in the present paper.
In order to calculate the lattice thermal conductivity via Eq. (2), one needs (a) a cut-off frequency as an integration limit, (b) an expression for the specific form of the phonon dispersion relation , and (c) an expression for the spectral phonon relaxation time .
An obvious shortcoming of the frequently used Eq. (3) is the assumed linear phonon dispersion throughout the 1. BZ. This was originally justified, as Callaway’s model was intended to describe at low temperatures, where most phonons populate states in the linear regime of the dispersion curves around the center of the 1.BZ, [16]. However, at elevated temperatures, also phonon modes outside the linear regime of the dispersion relation contribute to the thermal conduction. Estimating the integration cut-off by extrapolating the linear region of the phonon dispersion curves to the boundary of the 1.BZ will thus generally result in too high and thus too high . Instead, it was suggested to use the phonon frequency at the zone boundary as a cut-off in Eq. (3), which can be obtained by, for example, inelastic neutron diffraction experiments or computational studies [18, 34].
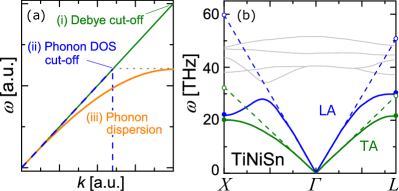
As a second requirement to calculate by Eq. (2), one has to assume a certain shape of the phonon dispersion relation, providing expressions for and . Here, we calculate by three different methods, schematically shown in Fig. 1 (a):
-
(i)
The "Debye cut-off" model, i.e. using linear phonon dispersion throughout the Brillouin zone, with .
-
(ii)
The "Phonon DOS cut-off" model: As in (i), but limiting the integral to frequencies below the phonon frequency at the Brillouin zone boundary, , as obtained from computational phonon dispersion curves. Note that this approach still assumes the identity of sound, group, and phase velocity for all phonon modes considered in the integral.
-
(iii)
The "Phonon dispersion" model, which approximates the average phonon dispersion by a simple polynomial, . The coefficients and for the different compositions NiSn are obtained from the condition and . From the approximated , the frequency dependent and in Eq. (2) can be easily obtained.
Lastly, in order to calculate the thermal conductivity for the three different models using Eq. (2), information on the frequency dependent relaxation time is needed. According to Matthiessen’s rule, the total relaxation time is related to the relaxation time of the -th scattering process via . In the present calculation, we consider three different phonon scattering mechanisms: Umklapp , mass disorder, and grain boundary scattering. Importantly, this is the same set of phonon relaxation processes contributing to the total relaxation time as used in earlier DFT calculations with good agreement with experimental values [33, 32]. For the relaxation times of the different processes, we adapt commonly used empirical expressions, summarized in Table 1. There, , , , , , , and are the Grüneisen parameter, the frequency cut-off, the average grain size, the average atomic mass on the -sublattice, the average mass of all atoms, the relative concentration of Hf, Zr, or Ti, and their atomic mass, respectively. is related to the anharmonicity of the chemical bonds of the structure. Reported values of for NiSn vary in the range from depending on the employed method [35, 20, 36], but do not show a significant variation with using the same methodology [37]. Here, we use for all compositions, but our results are not very dependent on this particular choice. For point-defect scattering, we also neglect the contribution due to strain variations, as it has been shown to be a minor contribution to for NiSn [27].
We note that, in contrast to many previous studies [38, 39], where the scattering strength of the individual mechanisms is obtained via fitting of experimental data, is here obtained from independent, tabulated material properties.
| Scattering Process | Scattering rate | Reference |
|---|---|---|
| Umklapp | Ref. [40] | |
| Point defect | Refs. [41, 42, 39] | |
| Grain boundary | Ref. [43] |
| [ms-1] | [THz] | ||||
|---|---|---|---|---|---|
| Ti | 2991 | 5513 | 3337 | 50.3 | 30.0 |
| Zr | 2878 | 5437 | 3217 | 47.0 | 30.6 |
| Hf | 2575 | 4793 | 2875 | 42.2 | 27.4 |
3 Results and discussion
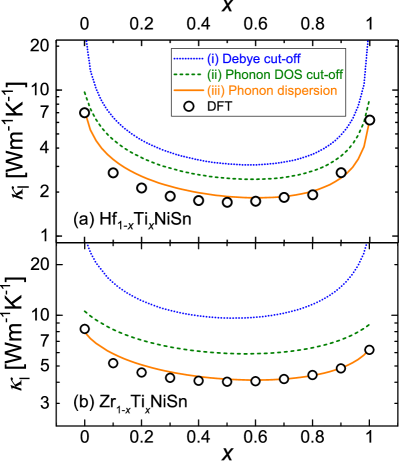
From the available DFT-based phonon dispersion curves, Fig. 1 (b), for the three unmixed compounds, () [44, 33], we obtained the sound velocity from a linear fit around the -point, as shown in Table 2. From the calculated dispersion curves, we can then quantify the overestimation of the cut-off frequency in Eq. (2), when erroneously using the linear phonon dispersion throughout the 1.BZ, instead of the real phonon frequency at the zone boundary. Extrapolating the linear region of all phonon branches of TiNiSn leads to much higher phonon frequencies at the Brillouin zone boundary, , than the frequencies obtained by DFT. This is most pronounced for the LA branch, but also extrapolating the TA branches results in an overestimation of the maximum frequency of around 40 %. Averaging over the three acoustic phonon branches and the different space directions, the average frequency at the zone boundary, , fairly independent of the composition , cf. Table 2.
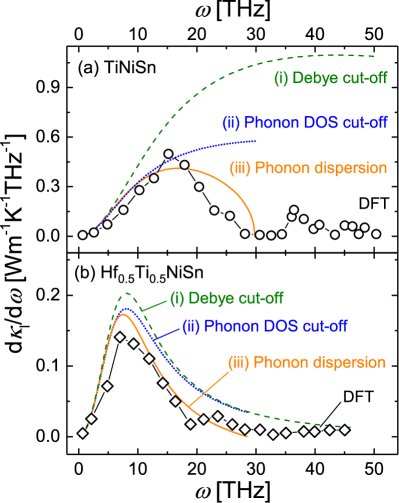
Fig. 2 compares calculated from the different models for different compositions . As expected, in all models is strongly reduced when introducing mass disorder on the site. However, both the "Debye cut-off" (i) and "Phonon DOS cut-off" (ii) model predict significantly higher values than the DFT reference data set, in particular for the unmixed compositions. In contrast, values calculated using the "Phonon dispersion" model (iii) are very similar to the DFT results for all compositions. To understand these findings on a microscopic level, it is instructive to examine the spectral thermal conductivity , instead of the integrated value [45]. While the spectral thermal conductivity is easily obtained from computational studies, experimental access is very challenging [46, 47], making it difficult to directly compare the modeled predictions with experimental reality. However, it is intuitively clear that phonons with do not contribute to , in particular that . The spectral thermal conductivity for and at 400 K and for an average grain size of 100 nm is shown in Fig. 3. For the DFT results, the dominant contribution to is – as expected – for phonon frequencies of the acoustic branches with . In model (i), the cut-off frequency is significantly overestimated and, in the absence of point-defect scattering, high frequency phonons contribute significantly to the calculated , Fig. 3 (a). Reducing the cut-off frequency improves the agreement with the DFT result (ii), but for both (i) and (ii) , as a consequence of the constant group velocity assumed in these models. Best qualitative and quantitative agreement is achieved for the simple phonon dispersion model (iii). For , Fig. 3 (b), the large mass-disorder on the site brings down the contribution of high frequency phonons for all models, but implementing model (iii) still leads to a significant better agreement with the DFT reference data. All three variations of the Callaway model investigated here ignore the contribution of optical phonon modes to . This is usually acceptable for most semiconductors, due to the relatively simple crystal structure and a small of the optical modes compared to the acoustic branches [22]. However, for materials with many atoms in the primitive unit cell, the high number of optical modes can compensate for the low , so that these modes may carry a significant part of the heat flux in the material. In the case of those materials, we emphasize that one a priori cannot simply express the contribution of the optical modes like in Eq. (1) and add them to the acoustic . The empirical scattering rates , as summarized in Table 1, have been developed only taking into account acoustic modes, so that some influence of the optical branches, like scattering from or into these modes, might effectively already be incorporated in the expression of . For NiSn, the contribution of optical modes to the total as obtained from the full dispersion DFT calculation is below 10 %, Fig. 3, i.e. below typical accuracies of a Callaway-type analysis.
Our results emphasize that the linear dispersion relation as assumed in Eq. (3) predicts a , which is much larger than values typically measured experimentally. To make values of calculated by the Debye-Callaway model similar to experimental ones, different approaches have been reported in the literature. These include introducing additional phonon relaxation processes, such as electron-phonon scattering, reducing the effective relaxation time for low and medium frequency phonons [20, 28], or using an empirical expression for , with , , and being adjustable parameters [27, 48]. In the latter approach, determining , , and may well reproduce the experimentally measured , but the physical meaning of these parameters can be unclear. More severely, adding additional phonon scattering processes to the analysis changes the physical interpretation of the obtained results.
In addition, both these modifications only target the integrated , while the spectral would show finite values up to the Debye cut-off , in disagreement with physical intuition and DFT results. As we show here, much better agreement for both (Fig. 2) and (Fig. 3) is obtained when taking into account the dispersive nature of phonons, without changing the type or strength of the dominant scattering mechanisms. In particular, the simple model phonon dispersion as used here in combination with the empirical expressions for the different scattering processes, but without any further fitting parameter, reproduces the cost-intensive DFT results both on a microscopic and macroscopic level. We chose a third-order polynomial to mimic a more realistic phonon dispersion. Analytical functions with more free parameters may describe the actual phonon dispersion curves even better and may change the calculated somewhat. One should, however, bear in mind that also the relaxation times for the different scattering processes given in Table 1 are based on simple, empirical expressions, so that further refinement of the phonon dispersion without modification of the phonon scattering may quickly cross the limits of the chosen model.
Finally, we note that both the improved models (ii) and (iii) require phonon dispersion curves of the material under study. The experimental determination of these dispersion curves can be challenging, due to required sample dimensions and limited access to scattering facilities, while computational methods nowadays routinely provide reliable data. As compared to first principle calculations of thermal transport properties, the phonon dispersion curves required for model (ii) and (iii) are computationally much less demanding, as only harmonic terms have to be considered [49].
4 Conclusion
We conclude that the Callaway model with implementation of the effects of phonon dispersion is a simple but useful model to analyze the lattice thermal conductivity of a material. In contrast, the Callaway model in the often used simplification of Eq. (3) is generally too simple to deduce the dominant phonon scattering processes at elevated temperatures, and can result in misleading strategies to optimize . We have shown, that combining a simple polynomial phonon dispersion relation and empirical expressions for relevant scattering processes without any adjustable parameters reproduces of a NiSn model system both qualitatively and quantitatively. This model can easily be extended to understand of a wide range of other material systems, as long as information on the phonon dispersion is available.
This work was funded by the Research Council of Norway (THELMA, 228854). MS is grateful for enlightening discussions with Bin He and Joseph Heremans during his stay at the Ohio State University.
References
- [1] D. B. Tuckerman and R. F. W. Pease. High-performance heat sinking for vlsi. IEEE Electron Device Letters, 2(5):126–129, May 1981.
- [2] X.Q. Cao, R. Vassen, and D. Stoever. Ceramic materials for thermal barrier coatings. Journal of the European Ceramic Society, 24(1):1 – 10, 2004.
- [3] G. Jeffrey Snyder and Eric S. Toberer. Complex thermoelectric materials. Nature Materials, 7:105–114, 2008.
- [4] Jing-Feng Li, Wei-Shu Liu, Li-Dong Zhao, and Min Zhou. High-performance nanostructured thermoelectric materials. NPG Asia Materials, 2:152–158, 2010.
- [5] Christopher J. Vineis, Ali Shakouri, Arun Majumdar, and Mercouri G. Kanatzidis. Nanostructured thermoelectrics: Big efficiency gains from small features. Advanced Materials, 22(36):3970–3980, 2010.
- [6] Changwook Jeong, Supriyo Datta, and Mark Lundstrom. Full dispersion versus Debye model evaluation of lattice thermal conductivity with a Landauer approach. Journal of Applied Physics, 109(7):073718, 2011.
- [7] Lasse Bjerg, Bo B. Iversen, and Georg K. H. Madsen. Modeling the thermal conductivities of the zinc antimonides znsb and zn4sb3. Phys. Rev. B, 89:024304, Jan 2014.
- [8] Tao Wang, Jesús Carrete, Ambroise van Roekeghem, Natalio Mingo, and Georg K. H. Madsen. Ab initio phonon scattering by dislocations. Phys. Rev. B, 95:245304, Jun 2017.
- [9] Zhiting Tian, Jivtesh Garg, Keivan Esfarjani, Takuma Shiga, Junichiro Shiomi, and Gang Chen. Phonon conduction in PbSe, PbTe, and PbTe1-xSex from first-principles calculations. Phys. Rev. B, 85:184303, May 2012.
- [10] Atsushi Togo, Laurent Chaput, and Isao Tanaka. Distributions of phonon lifetimes in Brillouin zones. Phys. Rev. B, 91:094306, Mar 2015.
- [11] Wu Li, Jesus Carrete, Nebil A. Katcho, and Natalio Mingo. Shengbte: A solver of the boltzmann transport equation for phonons. Computer Physics Communications, 185(6):1747 – 1758, 2014.
- [12] Jose J. Plata, Pinku Nath, Demet Usanmaz, Jesús Carrete, Cormac Toher, Maarten de Jong, Mark Asta, Marco Fornari, Marco Buongiorno Nardelli, and Stefano Curtarolo. An efficient and accurate framework for calculating lattice thermal conductivity of solids: Aflow–aapl automatic anharmonic phonon library. npj Computational Materials, 3(1):45, 2017.
- [13] Christian Carbogno, Rampi Ramprasad, and Matthias Scheffler. Ab initio green-kubo approach for the thermal conductivity of solids. Phys. Rev. Lett., 118:175901, Apr 2017.
- [14] Pinku Nath, Jose J. Plata, Demet Usanmaz, Cormac Toher, Marco Fornari, Marco Buongiorno Nardelli, and Stefano Curtarolo. High throughput combinatorial method for fast and robust prediction of lattice thermal conductivity. Scripta Materialia, 129:88 – 93, 2017.
- [15] Cormac Toher, Corey Oses, Jose J. Plata, David Hicks, Frisco Rose, Ohad Levy, Maarten de Jong, Mark Asta, Marco Fornari, Marco Buongiorno Nardelli, and Stefano Curtarolo. Combining the aflow gibbs and elastic libraries to efficiently and robustly screen thermomechanical properties of solids. Phys. Rev. Materials, 1:015401, Jun 2017.
- [16] Joseph Callaway. Model for lattice thermal conductivity at low temperatures. Phys. Rev., 113:1046–1051, Feb 1959.
- [17] A. Ward and D. A. Broido. Intrinsic phonon relaxation times from first-principles studies of the thermal conductivities of si and ge. Phys. Rev. B, 81:085205, Feb 2010.
- [18] D. T. Morelli, J. P. Heremans, and G. A. Slack. Estimation of the isotope effect on the lattice thermal conductivity of group IV and group III-V semiconductors. Phys. Rev. B, 66:195304, Nov 2002.
- [19] M. Asen-Palmer, K. Bartkowski, E. Gmelin, M. Cardona, A. P. Zhernov, A. V. Inyushkin, A. Taldenkov, V. I. Ozhogin, K. M. Itoh, and E. E. Haller. Thermal conductivity of germanium crystals with different isotopic compositions. Phys. Rev. B, 56:9431–9447, Oct 1997.
- [20] Hanhui Xie, Heng Wang, Yanzhong Pei, Chenguang Fu, Xiaohua Liu, G. Jeffrey Snyder, Xinbing Zhao, and Tiejun Zhu. Beneficial contribution of alloy disorder to electron and phonon transport in half-Heusler thermoelectric materials. Advanced Functional Materials, 23(41):5123–5130, 2013.
- [21] Eric S. Toberer, Alex Zevalkink, and G. Jeffrey Snyder. Phonon engineering through crystal chemistry. J. Mater. Chem., 21:15843–15852, 2011.
- [22] Terry M. Tritt, editor. Thermal conductivity; Theory, Properties, and applications. Kluwer Academic/Plenum publishers, 2004.
- [23] Philip B. Allen. Improved Callaway model for lattice thermal conductivity. Phys. Rev. B, 88:144302, Oct 2013.
- [24] Julia Krez and Benjamin Balke. Thermoelectric Heusler compounds. Springer International Publishing, 2016.
- [25] S. Sakurada and N. Shutoh. Effect of Ti substitution on the thermoelectric properties of (Zr,Hf)NiSn half-Heusler compounds. Applied Physics Letters, 86(8), 2005.
- [26] Slade R. Culp, S. Joseph Poon, Nicoleta Hickman, Terry M. Tritt, and J. Blumm. Effect of substitutions on the thermoelectric figure of merit of half-Heusler phases at 800∘C. Applied Physics Letters, 88(4), 2006.
- [27] Huiyuan Geng and Hao Zhang. Effects of phase separation on the thermoelectric properties of (Ti, Zr, Hf)NiSn half-Heusler alloys. Journal of Applied Physics, 116(3), 2014.
- [28] Yintu Liu, Hanhui Xie, Chenguang Fu, G. Jeffrey Snyder, Xinbing Zhao, and Tiejun Zhu. Demonstration of a phonon-glass electron-crystal strategy in (Hf,Zr)NiSn half-Heusler thermoelectric materials by alloying. J. Mater. Chem. A, 3:22716–22722, 2015.
- [29] Wenjie Xie, Anke Weidenkaff, Xinfeng Tang, Qingjie Zhang, Joseph Poon, and Terry M. Tritt. Recent advances in nanostructured thermoelectric half-Heusler compounds. Nanomaterials, 2(4):379–412, 2012.
- [30] Han-Hui Xie, Cui Yu, Tie-Jun Zhu, Chen-Guang Fu, G. Jeffrey Snyder, and Xin-Bing Zhao. Increased electrical conductivity in fine-grained (Zr,Hf)NiSn based thermoelectric materials with nanoscale precipitates. Applied Physics Letters, 100(25), 2012.
- [31] Cui Yu, Hanhui Xie, Chenguang Fu, Tiejun Zhu, and Xinbing Zhao. High performance half-Heusler thermoelectric materials with refined grains and nanoscale precipitates. Journal of Materials Research, 27(19):2457–2465, Oct 2012.
- [32] M. Schrade, K. Berland, S. N. H. Eliassen, M. N. Guzik, C. Echevarria-Bonet, M. H. Sørby, B. C. Hauback, R. Tofan, A. E. Gunnæs, C. Persson, O. M. Løvvik, and T. G. Finstad. The role of grain boundary scattering in reducing the thermal conductivity of polycrystalline NiSn (Hf, Zr, Ti) half-Heusler alloys. Scientific reports, 7:13760, 2017.
- [33] Simen N. H. Eliassen, Ankita Katre, Georg K. H. Madsen, Clas Persson, Ole Martin Løvvik, and Kristian Berland. Lattice thermal conductivity of TixZryHf1-x-yNiSn half-Heusler alloys calculated from first principles: Key role of nature of phonon modes. Phys. Rev. B, 95:045202, Jan 2017.
- [34] Yongsheng Zhang. First-principles Debye-Callaway approach to lattice thermal conductivity. Journal of Materiomics, 2(3):237 – 247, 2016.
- [35] P. Hermet, R. M. Ayral, E. Theron, P. G. Yot, F. Salles, M. Tillard, and P. Jund. Thermal Expansion of Ni-Ti-Sn Heusler and Half-Heusler Materials from First-Principles Calculations and Experiments. The Journal of Physical Chemistry C, 118(39):22405–22411, 2014.
- [36] Daehyun Wee, Boris Kozinsky, Barbara Pavan, and Marco Fornari. Quasiharmonic Vibrational Properties of TiNiSn from ab initio Phonons. Journal of Electronic Materials, 41(6):977–983, 2012.
- [37] Cormac Toher, Jose J. Plata, Ohad Levy, Maarten de Jong, Mark Asta, Marco Buongiorno Nardelli, and Stefano Curtarolo. High-throughput computational screening of thermal conductivity, Debye temperature, and Grüneisen parameter using a quasiharmonic Debye model. Phys. Rev. B, 90:174107, Nov 2014.
- [38] M. D. Tiwari and Bal K. Agrawal. Analysis of the Lattice Thermal Conductivity of Germanium. Phys. Rev. B, 4:3527–3532, Nov 1971.
- [39] M. G. Holland. Analysis of lattice thermal conductivity. Phys. Rev., 132:2461–2471, Dec 1963.
- [40] Glen A. Slack and S. Galginaitis. Thermal Conductivity and Phonon Scattering by Magnetic Impurities in CdTe. Phys. Rev., 133:A253–A268, Jan 1964.
- [41] J. Yang, G. P. Meisner, and L. Chen. Strain field fluctuation effects on lattice thermal conductivity of ZrNiSn-based thermoelectric compounds. Applied Physics Letters, 85(7):1140–1142, 2004.
- [42] P G Klemens. The scattering of low-frequency lattice waves by static imperfections. Proceedings of the Physical Society. Section A, 68(12):1113, 1955.
- [43] Joseph Callaway and Hans C. von Baeyer. Effect of point imperfections on lattice thermal conductivity. Phys. Rev., 120:1149–1154, Nov 1960.
- [44] Alexander Page, Ctirad Uher, Pierre Ferdinand Poudeu, and Anton Van der Ven. Phase separation of full-Heusler nanostructures in half-Heusler thermoelectrics and vibrational properties from first-principles calculations. Phys. Rev. B, 92:174102, Nov 2015.
- [45] T. J. Zhu, C. G. Fu, H. H. Xie, Y. T. Liu, B. Feng, J. Xie, and X. B. Zhao. Lattice thermal conductivity and spectral phonon scattering in FeVSb-based half-Heusler compounds. EPL (Europhysics Letters), 104(4):46003, 2013.
- [46] A. J. Minnich, J. A. Johnson, A. J. Schmidt, K. Esfarjani, M. S. Dresselhaus, K. A. Nelson, and G. Chen. Thermal conductivity spectroscopy technique to measure phonon mean free paths. Phys. Rev. Lett., 107:095901, Aug 2011.
- [47] Yongjie Hu, Lingping Zeng, Austin J. Minnich, Mildred S. Dresselhaus, and Gang Chen. Spectral mapping of thermal conductivity through nanoscale ballistic transport. Nature Nanotechnology, 10:701–706, 2015.
- [48] Alex Petersen, S. Bhattacharya, T. M. Tritt, and S. J. Poon. Critical analysis of lattice thermal conductivity of half-Heusler alloys using variations of Callaway model. Journal of Applied Physics, 117(3), 2015.
- [49] Atsushi Togo and Isao Tanaka. First principles phonon calculations in materials science. Scripta Materialia, 108(Supplement C):1 – 5, 2015.