Observation of large multiple scattering effects
in ultrafast electron diffraction on single crystal silicon
Abstract
We report on ultrafast electron diffraction on high quality single crystal silicon. The ultrafast dynamics of the Bragg peaks exhibits a giant photo-induced response which can only be explained in the framework of dynamical diffraction theory, taking into account multiple scattering of the probing electrons in the sample. In particular, we show that lattice heating following photo-excitation can cause an unexpected increase of the Bragg peak intensities, in contradiction with the well-known Debye-Waller effect. We anticipate that multiple scattering should be systematically considered in ultrafast electron diffraction on high quality crystals as it dominates the Bragg peak dynamics. In addition, taking into account multiple scattering effects opens the way to quantitative studies of non-equilibrium dynamics of defects in quasi-perfect crystals.
The field of ultrafast dynamics in condensed matter has been very active in the past decades. Its main motivation is to gain new insight on the complex interplay between the various degrees of freedom in materials (charge, lattice, spins) directly in the time domain. In particular, ultrafast X-ray diffraction Fritz et al. (2007); Mankowsky et al. (2014) and ultrafast electron diffraction (UED) Zewail (2006); Sciaini and Miller (2011); Miller (2014) are ideal techniques for obtaining valuable information on structural dynamics at the atomic scale. The use of ultrafast electron diffraction in pump-probe experiments has proven to be very efficient for studying the dynamics of photo-induced phase transitions by measuring the relative changes of the diffraction pattern following photo-excitation Baum et al. (2007); Eichberger et al. (2010); Sciaini et al. (2009); Gao et al. (2013); Morrison et al. (2014). Indeed, in the case of a structural phase transition, interpreting the dynamics of the diffraction pattern is relatively straightforward: the change in the crystal symmetry can be monitored through the appearance/disappearance of Bragg peaks Eichberger et al. (2010); Morrison et al. (2014). However, a wealth of additional information is contained in the diffraction pattern, e.g. lattice heating can be estimated through the change of the Bragg peak intensity due to the Debye-Waller effect. Quantitative analysis mostly relies on the use of kinematical diffraction theory, which assumes that the scattering potential of the crystal lattice is a small perturbation, so that the probing electrons undergo a single elastic scattering event, leading to a weak diffracted intensity compared to the incident electron beam. This theory gives satisfactory results when applied to the case of polycrystalline samples where the grain size is only a few nanometers Harb et al. (2006); Morrison et al. (2014). It led to quasi-direct measurements of the lattice temperature with sub-picosecond resolution in several materials Harb et al. (2006); Miller (2014). However, as high quality single crystal samples adapted to UED experiments are becoming available, kinematical theory does not appear sufficient to explain all experimental results. Several UED studies on high quality crystals, such as silicon Harb et al. (2009) and graphite Lahme et al. (2014) have reported large photo-induced changes of the Bragg peak intensity that cannot be explained by kinematical theory. The authors proposed that multiple scattering of the electrons must be at play but no quantitative analysis was performed to fully confirm this hypothesis.
In electron microscopy, multiple scattering is taken into account in the framework of dynamical diffraction theory Reimer and Kohl (2008); Fultz and Howe (2013). In high quality crystals, multiple scattering needs to be considered due to the very high elastic scattering cross section of electrons. Despite this, little attention has been given to these effects in time-resolved electron diffraction experiments. To our knowledge, multiple scattering was considered in detailed only in Schäfer et al. (2011) in a UED experiment in reflexion geometry designed to study surface dynamics. In this letter, we show that multiple scattering completely dominates the dynamics of the diffraction pattern in the commonly used transmission geometry. The experiment is performed on nano-membranes of monocrystalline silicon which is the archetypal example of the perfect single crystal. In addition, the availability of the silicon scattering potential enables a thorough and quantitative comparison between experiment and theory, leading to the unambiguous conclusion that the observed dynamics is dominated by the photo-induced changes of multiple scattering physics.
The electron bunches are first generated by back-illuminating a gold photo-cathode with a ultrashort laser pulse of duration. Electrons are then accelerated in a DC gun, delivering accelerating voltages up to , and then focused by a solenoid to a spot size of Full Width Half Maximum (FWHM) at the sample position. The charge of the electron bunch beam is resulting in space charge dominated bunches with duration. Unless stated otherwise, the electron energy is . The silicon sample is pumped with a pump laser pulse, with photons. The incident fluence is , over a FWHM laser spot. The diffracted peaks are detected with a MCP detector imaged onto a CCD camera. The experiment is performed at 1 kHz repetition rate and each diffraction image is obtained by accumulating over pulses. The silicon samples were thinned out from a silicon on insulator wafer Scott and Lagally (2007), resulting in a grid of free standing nano-membranes with [001] orientation. The membrane thickness was measured using convergent beam electron diffraction Allen (1981) and estimated to be .
We start by reviewing some properties of silicon and its expected dynamical response following photo-excitation. We measured the pump pulse absorption in the sample to be . Thus, starting from an incident fluence of , the absorbed fluence is estimated at . The pump laser pulse causes the excitation of electron-hole pairs and the density of excited electrons in the conduction band is given by: , i.e. for our experimental parameters. Excited carriers thermalize via electron-electron scattering on the 100 fs time scale Jeong et al. (1996) and form two subsystems comprising hot electrons and holes. The electrons (holes) subsequently relax to the bottom of the conduction band (top of the valence band) through electron-phonon coupling on a picosecond timescale, causing lattice heating Shank et al. (1983); Harb et al. (2006). Using ab initio calculations Gonze et al. (2009) for determining the quasiparticle density of states of the valence and conduction bands Arnaud et al. (2005), as well as the specific heat of silicon, we were able to determine the lattice temperature after electron relaxation assuming that the number of electron-hole pairs stays constant during this part of the dynamics. This gives a lattice temperature increase of . Additional delayed heating occurs via electron-hole pair recombination across the gap. At this excitation level, it is well-known that the dominant mechanism is Auger recombination Richter et al. (2012). The dynamics of excited carrier is governed by the following equation , where and are the Auger coefficients for electron and holes respectively. Following Dziewior and Schmid J.Dziewior and Schmid (1977) , we used , and we find that of the Auger recombination has occurred after and after . Therefore, after , we estimate a temperature increase of . At this point, the system reaches a metastable state as heat diffusion occurs on the microsecond time scale for our sample geometry. In kinematical diffraction, lattice heating manifests itself by the decrease of the Bragg peak intensities according to the Debye-Waller factor: , with . Here, represents the rms displacement of atoms around their equilibrium position and , where is the electron de Broglie wavelength. Using ab initio calculations Arnaud et al. (2005); Gonze et al. (2009); Lee and Gonze (1995) for estimating the values of , we find that the (220) peaks should all decrease by after lattice heating is completed: . This scenario and the use of kinematical theory to interpret the decrease of the Bragg peak intensities was validated in a UED experiment on polycrystalline silicon Harb et al. (2006).
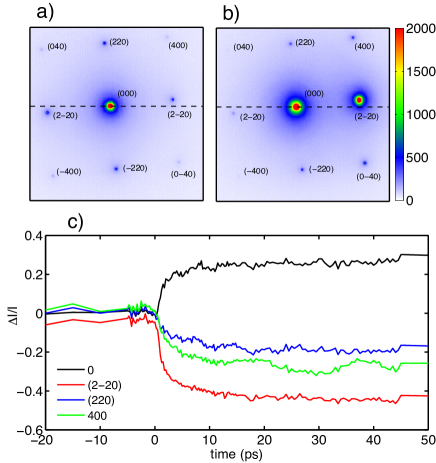
We now demonstrate that this interpretation does not hold in the case of high quality single crystals. Typical diffraction patterns from the silicon nano-membranes are shown in Fig. 1. In a), the electron beam is oriented so that it is parallel to the direction: the diffraction pattern is symmetric and the various (220) peaks have similar intensity. The diffracted beam intensities is about one order of magnitude lower compared to the intensity of the transmitted electron beam (referred to as the 0-order beam in the following). In contrast, in b) the sample was tilted along the horizontal axis (represented by the dashed black line) so that the (2-20) peak satisfies the Bragg condition. The diffraction pattern is quite asymmetric and remarkably, the 0-order and the (2-20) peak have similar intensities. This fact clearly contradicts the basic hypothesis of kinematical diffraction theory which states that the diffracted intensity is much lower than the transmitted beam intensity. Fig. 1c shows the dynamics of various Bragg peaks following photo-excitation at incident fluence of . In this case, the sample was oriented so that the (2-20) peak is slightly off Bragg. All Bragg peaks exhibit similar dynamics: the relative intensity starts with a sharp decrease on the picosecond time scale. This is followed by a slower roll-off and further decrease on the 10 ps time scale. According to the above-mentioned scenario, the fast picosecond time scale can be attributed to electron relaxation and lattice heating via electron phonon coupling while the slower time scale can be attributed to delayed heating due to Auger recombination. After tens of picoseconds, the Bragg peak intensity is relatively flat and a quasi-steady state is established that lasts hundreds of picoseconds.
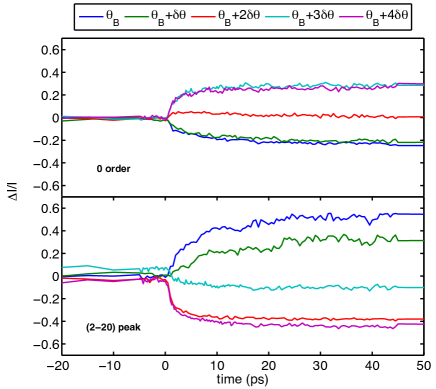
These different time scales are consistent with previous results Harb et al. (2009), but a truly intriguing feature is the magnitude of the measured signal: the (2-20) peak decreases by while the 0-order peak increases by nearly . Even more surprisingly, we observed that the dynamics of the Bragg peak is extremely sensitive to sample orientation. In Fig. 2, we show the dynamics for the transmitted beam (a) and for the (2-20) peak (b) for five different sample orientations. The results are striking as a tilt can turn the intensity change of the (2-20) peak from to almost . Therefore, we not only observe a giant photo-induced response in the Bragg peak intensity but the sign of the response is determined by sample orientation. It is also interesting to note that the 0-order and the (2-20) peak have a complementary behavior, indicating a possible coupling.
These observations are in complete contradiction with the predictions of kinematical theory. In kinematical theory, the 0-order should remain unchanged while the all (220) peaks should decrease by less than . Finally, the magnitude of the intensity changes should be independent on sample orientation.
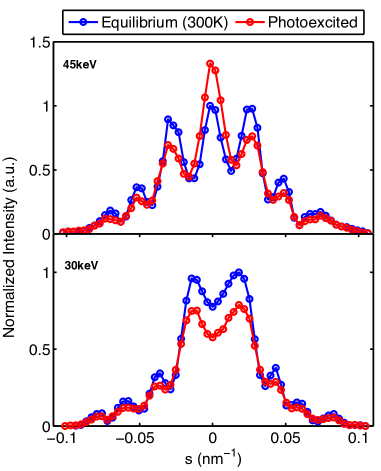
In order to gain further insight on these large changes of intensity, we measured the rocking curves of several diffraction peaks. Figure 3 shows the rocking curve of the (2-20) peak at equilibrium (i.e. at , blue curves) and in the photo-excited state (red curves) taken 150 ps after the arrival of the pump pulse, i.e. after thermalization of the sample has occurred. Rocking curves are shown at two different electron energies. We plot the Bragg peak intensity , where is the amplitude of the deviation vector , and is the lattice reciprocal vector corresponding to the (2-20) peak. Figure 3 clearly shows that the shape and magnitude of the rocking curve changes upon photo-excitation. However, there is no angular shift of the rocking curve upon photo excitation, invalidating previous interpretations based on lattice expansion Lahme et al. (2014) or sample distortion Harb et al. (2009). In addition, the results of Fig. 3 summarize and clarify the surprising features of Fig. 2: for electrons, the intensity change is positive at the Bragg angle, whereas it is negative for most off-Bragg cases. For electrons, the behavior is quite different: here, the intensity change is always negative after photo-excitation. The shape of these rocking curves, by departing from the usual line shape of kinematical theory, indicates that dynamical effects are dominating the physics of electron diffraction, even at equilibrium.
The fact that the rocking curve changes with temperature and electron energy can be understood quantitatively using a simplified version of dynamical diffraction theory: the 2-beam theory where one considers only the transmitted beam and one diffracted beam with intensity . In 2-beam theory, the diffracted intensity depends on the thickness of the sample and reads
| (1) |
where is the amplitude of the effective deviation vector and is the extinction distance. The extinction distance defines the shape of the rocking curve and changes of will modify the rocking curve.
At , the extinction distance reads where is the electron mass, is the Lorentz factor of an electron with kinetic energy . The two beams are coupled through , the Fourier component of the crystal potential corresponding to reciprocal lattice vector : . Clearly, the extinction distance depends on electron energy via , explaining why the rocking curve changes with electron energy. The temperature dependence can be accounted for by formally replacing by Takagi (1958). Consequently, the extinction distance increases with temperature Thomas and E.Levine (1965) like . Evidently, a rise in temperature causes an increase of , implying changes of the shape of the rocking curve.
We found that 2-beam theory does not allow us to fit our experimental rocking curves and that additional Bragg peaks need to be taken into account. This is also apparent in the experimental data of Fig. 2: the diffracted intensity is not conserved if one considers only the 0-order and the (2-20) peak, indicating that more diffracted beams need to be considered. Therefore, we turned to a N-beam theory and solved the Howie-Whelan equations Howie and Whelan (1961)
| (2) |
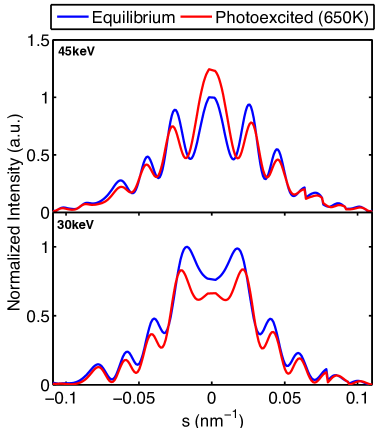
Here, is the amplitude of the diffraction peak and two peaks and are coupled through the extinction distance . Implementing this method requires the detailed knowledge of the scattering potential. Silicon data on the various was taken from the code JEMS Stadelmann (2004). In the experiment, we detect 12 diffraction peaks during a rocking curve scan but we found that the N-beam theory converges for and we present results with (more details can be found in the suppl. info). We found that N-beam theory reproduces all the trends of the experiment but the data could be even better fitted by adding a gaussian background to the results of the N-beam calculations. This background is a phenomenological modeling of absorption and inelastic scattering effect. The blue curves in Fig. 4 show the rocking curves at , both for and electrons. The photo-excited state was best fitted considering a temperature. Results are represented by the red curves in Fig. 4, showing excellent agreement with the measurements. We conclude that the observed dynamics of the Bragg peaks and in particular the behavior of can be fully explained by lattice heating and dynamical diffraction effects. In particular, we obtained the non-intuitive result that depending on the electron energy and the sample orientation, lattice heating can cause an increase of the Bragg peak intensity, contrary to the well-known Debye-Waller effect.
While this study was performed on silicon, we anticipate that such effects should be present in all materials provided that the crystal quality is high and the thickness comparable with the extinction distance. Indeed, when , multiple scattering can be neglected and kinematic theory appears to be a valid approximation. Typical extinction distances are tens of nanometers ( for silicon at ), so that multiple scattering and dynamical effects have to be considered as soon as the sample thickness is larger that a 1-10 nm, depending on the material. Consequently, when high quality single crystals are used, the quantitative interpretation of UED experiments might become quite complex as modeling multiple scattering requires prior knowledge of the crystal scattering potential. Dynamical effects, in turn, could potentially be used to obtain new information on the dynamics of the crystal potential. Finally, dynamical effects are also useful to visualize crystal defects, such as dislocation or stacking faults Fultz and Howe (2013). Therefore, they should enable a new type of experiments in which the dynamics of defects following laser irradiation can be studied using ultrafast electron imaging.
Acknowledgements.
Acknowledgments: This work was funded by the European Research Council under Contract No. 306708, ERC Starting Grant FEMTOELEC and also by a public grant from the “Laboratoire d’Excellence Physics Atoms Light Mater”, LabEx PALM, Contract No. ANR-11-IDEX-0003-02. Fabrication and characterization of Si nano-membrane samples (S.A.S. and M.G.L.) was supported by the US Department of Energy Grant No. DE-FG0203ER46028.References
- Fritz et al. (2007) D. M. Fritz, D. A. Reis, B. Adams, R. A. Akre, J. Arthur, C. Blome, P. H. Bucksbaum, A. L. Cavalieri, S. Engemann, S. Fahy, et al., Science 315, 633 (2007).
- Mankowsky et al. (2014) R. Mankowsky, A. Subedi, M. Först, S. O. Mariager, M. Chollet, H. T. Lemke, J. S. Robinson, J. M. Glownia, M. P. Minitti, A. Frano, et al., Nature 516, 71 (2014).
- Zewail (2006) A. H. Zewail, Annu. Rev. Phys. Chem. 57, 65 (2006).
- Sciaini and Miller (2011) G. Sciaini and R. J. D. Miller, Rep. Prog. Phys. 74, 096101 (2011).
- Miller (2014) R. J. D. Miller, Science 343, 1108 (2014).
- Baum et al. (2007) P. Baum, D. S. Yang, and A. H. Zewail, Science 318, 788 (2007).
- Eichberger et al. (2010) M. Eichberger, H. Schäfer, M. Krumova, M. Beyer, J. Demsar, H. Berger, G. Moriena, G. Sciani, and R. J. D. Miller, Nature 468, 799 (2010).
- Sciaini et al. (2009) G. Sciaini, M. Harb, S. G. Kruglik, T. Payer, C. T. Hebeisen, F. M. Heringdorf, M. Yamagushi, M. H. Hoegen, R. Ernstorfer, and R. J. D. Miller, Nature 458, 458 (2009).
- Gao et al. (2013) M. Gao, C. Lu, H. Jean-Ruel, L. C. Liu, A. Marx, K. Onda, S. Koshihara, Y. Nakano, X. Shao, T. Hiramatsu, et al., Nature 496, 343 (2013).
- Morrison et al. (2014) V. R. Morrison, R. P. Chatelain, K. L. Tiwari, A. Hendaoui, A. Bruhács, M. Chaker, and B. J. Siwick, Science 346, 445 (2014).
- Harb et al. (2006) M. Harb, R. Ernstorfer, T. Dartigalongue, C. T. Hebeisen, R. E. Jordan, and R. J. D. Miller, J. Phys. Chem. B 110, 25308 (2006).
- Harb et al. (2009) M. Harb, W. Peng, G. Sciaini, C. T. Hebeisen, R. Ernstorfer, M. A. Eriksson, M. G. Lagally, S. G. Kruglik, and R. J. D. Miller, Phys. Rev. B 79, 094301 (2009).
- Lahme et al. (2014) S. Lahme, C. Kealhofer, F. Krausz, and P. Baum, Struc. Dynam. 1, 034303 (2014).
- Reimer and Kohl (2008) L. Reimer and H. Kohl, Transmission electron microscopy (Springer Series in Optical Sciences, New York, 2008).
- Fultz and Howe (2013) B. Fultz and J. Howe, Transmission electron microscopy and diffractometry of materials (Springer Series in Graduate Texts in Physics, Berlin, Heidelberg, 2013).
- Schäfer et al. (2011) S. Schäfer, W. Liang, and A. H. Zewail, J. Chem. Phys. 135, 214201 (2011).
- Scott and Lagally (2007) S. A. Scott and M. G. Lagally, J. of Phys. D: App. Phys. 40, R75 (2007).
- Allen (1981) F. S. Allen, Phil. Mag. A 43, 325 (1981).
- Jeong et al. (1996) S. Jeong, H. Zacharias, and J. Bokor, Phys. Rev. B 54, R17300 (1996).
- Shank et al. (1983) C.V. Shank, R.Yen, and C.Hirlimann, Phys. Rev. Lett. 50, 454 (1983).
- Gonze et al. (2009) X. Gonze, B. Amadon, P. Anglade, J. Beuken, F. Bottin, P. Boulanger, F. Bruneval, D. Caliste, R. Caracas, M. Côté, et al., Computer Physics Communications 180, 2582 (2009).
- Arnaud et al. (2005) B. Arnaud, S. Lebègue, and M. Alouani, Phys. Rev. B 71, 035308 (2005).
- Richter et al. (2012) A. Richter, S.W. Glunz, F. Werner, J. Schmidt, and A. Cuevas, Phys. Rev. B 86, 165202 (2012).
- J.Dziewior and Schmid (1977) J.Dziewior and W. Schmid, Appl. Phys. Lett. 31, 346 (1977).
- Lee and Gonze (1995) C. Lee and X. Gonze, Phys. Rev. B 51, 8610 (1995).
- Takagi (1958) S. Takagi, J. Phys. Soc. Japan 13, 278 (1958).
- Thomas and E.Levine (1965) G. Thomas and E.Levine, Phys. Stat. Sol 11, 81 (1965).
- Howie and Whelan (1961) A. Howie and M. J. Whelan, Proc. R. Soc. Lond. A 263, 217 (1961).
- Stadelmann (2004) P. A. Stadelmann, JEMS-EMS java version (2004), URL www.jems-saas.ch.