Intermittent reconnection and plasmoids in UV bursts in the low solar atmosphere
Abstract
Magnetic reconnection is thought to drive a wide variety of dynamic phenomena in the solar atmosphere. Yet the detailed physical mechanisms driving reconnection are difficult to discern in the remote sensing observations that are used to study the solar atmosphere. In this paper we exploit the high-resolution instruments Interface Region Imaging Spectrograph (IRIS) and the new CHROMIS Fabry-Pérot instrument at the Swedish 1-m Solar Telescope (SST) to identify the intermittency of magnetic reconnection and its association with the formation of plasmoids in so-called UV bursts in the low solar atmosphere. The Si IV 1403Å UV burst spectra from the transition region show evidence of highly broadened line profiles with often non-Gaussian and triangular shapes, in addition to signatures of bidirectional flows. Such profiles had previously been linked, in idealized numerical simulations, to magnetic reconnection driven by the plasmoid instability. Simultaneous CHROMIS images in the chromospheric Ca II K 3934Å line now provide compelling evidence for the presence of plasmoids, by revealing highly dynamic and rapidly moving brightenings that are smaller than 0.2″ and that evolve on timescales of order seconds. Our interpretation of the observations is supported by detailed comparisons with synthetic observables from advanced numerical simulations of magnetic reconnection and associated plasmoids in the chromosphere. Our results highlight how subarcsecond imaging spectroscopy sensitive to a wide range of temperatures combined with advanced numerical simulations that are realistic enough to compare with observations can directly reveal the small-scale physical processes that drive the wide range of phenomena in the solar atmosphere.
Subject headings:
magnetic reconnection — Sun: activity — Sun: chromosphere — Sun: magnetic fields — Sun: transition region1. Introduction
Magnetic reconnection is thought to be the mechanism responsible for releasing magnetic energy in a wide range of solar transient phenomena, from flares and coronal mass ejections on the largest scales, to jets, surges and UV bursts on spatial scales of just a few arcseconds or smaller. It is clear from the observed temporal scales and plasma conditions in this wide range of solar events that classical reconnection, such as the Sweet-Parker mechanism, acts too slowly (by orders of magnitude) to explain the rapid release of energy that is observed (Priest, 2014). Recent theoretical work indicates that the Sweet-Parker reconnection can turn into fast reconnection through the tearing mode instability and formation of magnetic islands or plasmoids (e.g. Loureiro et al., 2007; Bhattacharjee et al., 2009). Observational support for such plasmoids has been found from “small” bright blob-like features in imaging observations of CMEs and flares (e.g. Ko et al., 2003; Lin et al., 2005, 2007, 2008; Milligan et al., 2010; Liu, 2013), coronal jets (e.g. Zhang & Ji, 2014; Zhang et al., 2016; Zhang & Zhang, 2017), and chromospheric anemone jets (Singh et al., 2012). Whether the observed bright blobs truly are magnetic islands as in the strict definition of plasmoids, requires measurements of the magnetic field that are presently not feasible. Recently, there have also been suggestions that the presence of plasmoids and fast reconnection can be deduced from spectroscopic observations of transition region explosive events which often show non-Gaussian and/or triangular-shaped profiles with broad wings (Innes et al., 2015). Explosive events are highly dynamic events, visible in transition region lines (Dere et al., 1989), that are much smaller than the events described above, with typical total sizes of only a few arcseconds. They are thought to be driven by reconnection (Innes et al., 1997). The presence of the plasmoid instability has been deduced from the spectral line shapes since idealized numerical simulations suggest that the piling up of plasmoids of a wide range of sizes naturally leads to triangular or non-Gaussian line shapes with broad wings around the current sheet, in addition to strong bidirectional flows in the neighboring outflow regions (Guo et al., 2017). If such line profiles are indeed a signature of the plasmoid instability, the Innes et al. (2015) results would significantly expand the diagnostic capability of magnetic reconnection through remote sensing of the solar atmosphere. First, spectroscopic measurements provide access to velocities and densities, key constraints for theoretical models of reconnection. Second, and more importantly, this would allow the identification of the plasmoid instability along the line-of-sight without the need for identifying blob-like features in imaging data. The latter is very difficult with most current imaging instruments because the bulk of the plasmoids in such arcsecond-scale events are expected to occur on much smaller spatial scales than can be resolved. This is because the plasmoid instability is expected to cascade down to very small spatial scales (of order the ion inertial length, Ni et al., 2015). However, blob-like features indicative of plasmoids have not been directly seen in imaging data of such explosive events, because to date imaging instruments have lacked the spatial resolution.
In this paper we focus on simultaneous spectroscopic and imaging observations of so-called “IRIS bombs” (Peter et al., 2014; Vissers et al., 2015) or UV bursts. These events were discovered with the Interface Region Imaging Spectrograph (IRIS, De Pontieu et al., 2014) and are a subset of “transition region” explosive events. The main difference with classical explosive events is that they are formed much lower in the atmosphere as evidenced by absorption from a Ni II line in the blue wing of Si IV 1394Å. This absorption line is formed in cool, chromospheric plasma (e.g., from overlying plasma in the magnetic canopy) suggesting that the Si IV emission, traditionally viewed as transition region diagnostic, originates from photospheric or low chromospheric heights. Comparisons with synthetic observables from advanced “realistic” 3D numerical simulations show a remarkable correspondence with the observations (Hansteen et al., 2017) and suggest that these events occur as a result of reconnection in the low solar atmosphere when new magnetic flux emerges.
The main difference of our current work with these previous observations and modeling efforts is the spatial resolution of the imaging observations and the numerical resolution of the simulation. Here we exploit the advent of the CHROMIS instrument, a Fabry-Pérot interferometer that operates at the Swedish 1-m Solar Telescope (SST, Scharmer et al., 2003) in the blue part of the visible spectrum, allowing narrowband images in the Ca II K 3934Å spectral line with unprecedented spatial resolution of 008 or 60 km. Such a resolution is high enough to, for the first time, directly detect blob-like features in UV bursts that also show triangular shaped Si IV 1394Å profiles, thereby providing strong support for the previous interpretation of plasmoid instability driven reconnection. This is further confirmed by comparison with advanced numerical simulations revealing the presence of plasmoids in UV burst-like events. Plasmoids have been seen previously in several solar MHD simulations, including of chromospheric anemone jets (e.g. Yang et al., 2013), surges (Nóbrega-Siverio et al., 2016), and coronal jets (e.g. Ni et al., 2017), but not for simulations that focus on UV burst formation or that are realistic enough to allow detailed comparisons with observables.
2. Observations and Data Processing
Active region NOAA AR12585 was observed in a coordinated campaign by IRIS and SST on 2016 September 3, 4, and 5. Two Fabry-Pérot tunable filter instruments were employed at SST: CRISP (Scharmer et al., 2008) on the red beam and CHROMIS, that saw first light during this campaign, on the blue beam. A detailed description of the CHROMIS instrument will be published in a forthcoming paper by Scharmer and collaborators. CHROMIS sampled two spectral lines: Ca II K 3934Å and H. For this study, we only focus on Ca II K, which was sampled at 21 wavelength positions, within the range of Doppler offsets of km s-1 from line center and with 6 km s-1 steps (or 78 mÅ) between km s-1. In addition, a continuum position was sampled at 4000 Å. The temporal cadence was 13, 25, and 12 s for the three observing days, and the time spent to sample Ca II K was 8.1, 15.5, and 7.4 s respectively. The CHROMIS transmission width is estimated to be 130 mÅ at Ca II K, the image scale is 00376, and the diffraction limit is 008 at 3934 Å. CRISP sampled H at 15 line positions between 1.5 Å, and Ca II 8542Å at 21 line positions between 1.75 Å in spectropolarimetric mode. The temporal cadence was 20 s. On 2016 September 5, CRISP also sampled the two Fe I lines at 6301 and 6302 Å, at 16 line positions in spectropolarimetric mode, this decreased the temporal cadence to 32 s. We applied Multi-Object Multi-Frame Blind Deconvolution (MOMFBD, van Noort et al., 2005) image restoration separately to each individual spectral line scan, which allowed, with the aid of the SST high order adaptive optics system, for diffraction limited imaging during the best seeing conditions. CHROMIS includes a pair of cameras in phase-diversity mode for the wideband channel (filter FWHM 13.2 Å). We followed the CRISPRED data reduction pipeline (de la Cruz Rodríguez et al., 2015) which was adapted and extended for the CHROMIS data (CHROMISRED, Löfdahl et al., 2017).
IRIS was running a so-called “medium dense 16-step raster” (observing program OBS-ID 3625503135) which has the spectrograph slit cover an area of 5360″ with 16 continuous 033 steps and a temporal cadence of 20 s. The exposure time was 0.5 s, the spatial image scale 0166 pixel-1, and the spectral sampling 11 km s-1 for Si IV (4 binning). Slit-jaw images were recorded in the 1400Å (dominated by Si IV), 1330Å (dominated by C II), and 2976Å (Mg II k) channels at 10 s temporal cadence.
The overlapping and aligned SST + IRIS data sets have durations of 27 min (September 3, starting 09:36:50 UT), 34 min (September 4, starting 08:19:17), and 30 min (September 5, starting 09:15:16).
3. Numerical Simulations
To interpret the observations we use a 2.5D radiative MHD simulation using the Bifrost code (Gudiksen et al., 2011) which includes thermal conduction along the magnetic field and radiative losses from the photosphere to the corona (Hayek et al., 2010; Carlsson & Leenaarts, 2012). The model spans from the upper layers of the convection zone ( Mm, with the photosphere at Mm) to the corona ( Mm). The ambient magnetic field is vertical, unipolar, and of strength 10 G. In addition, a twisted magnetic flux tube ( Mx) is injected from the bottom boundary which results in flux emergence in the simulated atmosphere and the formation of a reconnection site between the emerged plasma and the ambient field (see Fig. 4). A detailed description of this simulation is given in Nóbrega-Siverio et al. (2017).
We calculate synthetic spectral profiles of Si IV assuming non-equilibrium ionization (Olluri et al., 2013) and optically thin conditions. The upper atmosphere in the simulation has relatively low density and the chromosphere, transition region and corona combined has a Si IV line core optical thickness so that the assumption of optically thin line formation is justified. In addition, synthetic Ca II spectral profiles are calculated using the RH code (Uitenbroek, 2001; Pereira & Uitenbroek, 2015) assuming a five plus continuum level Ca II atom in 1D, non-LTE and partial redistribution (Leenaarts et al., 2012). The synthetic Si IV and Ca II profiles have been degraded both spatially and spectrally to match the observations.
4. Results
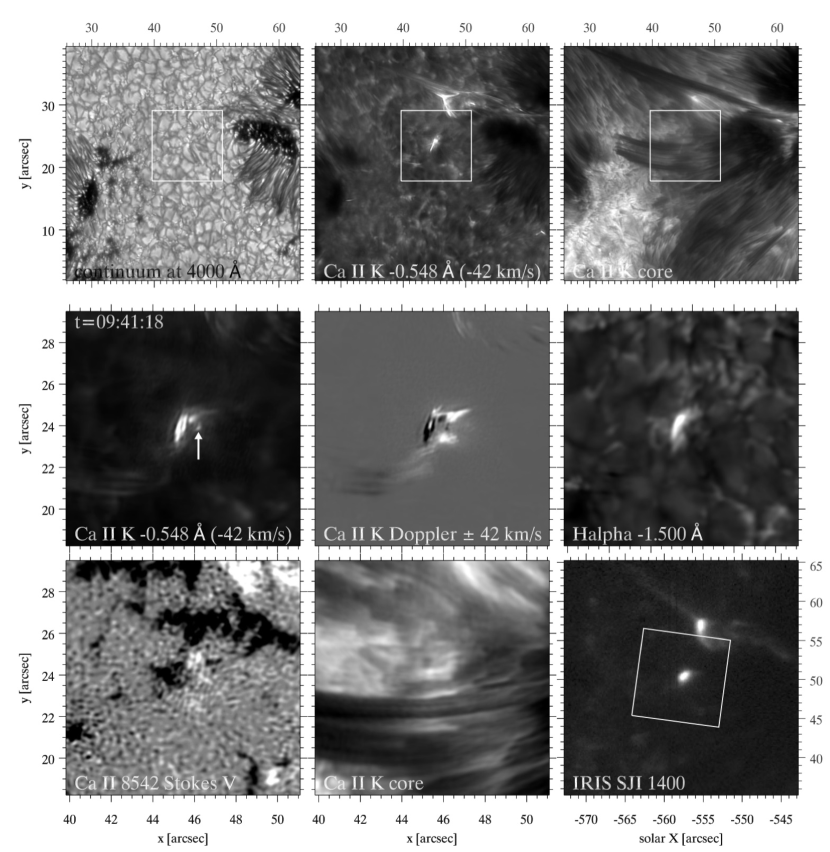
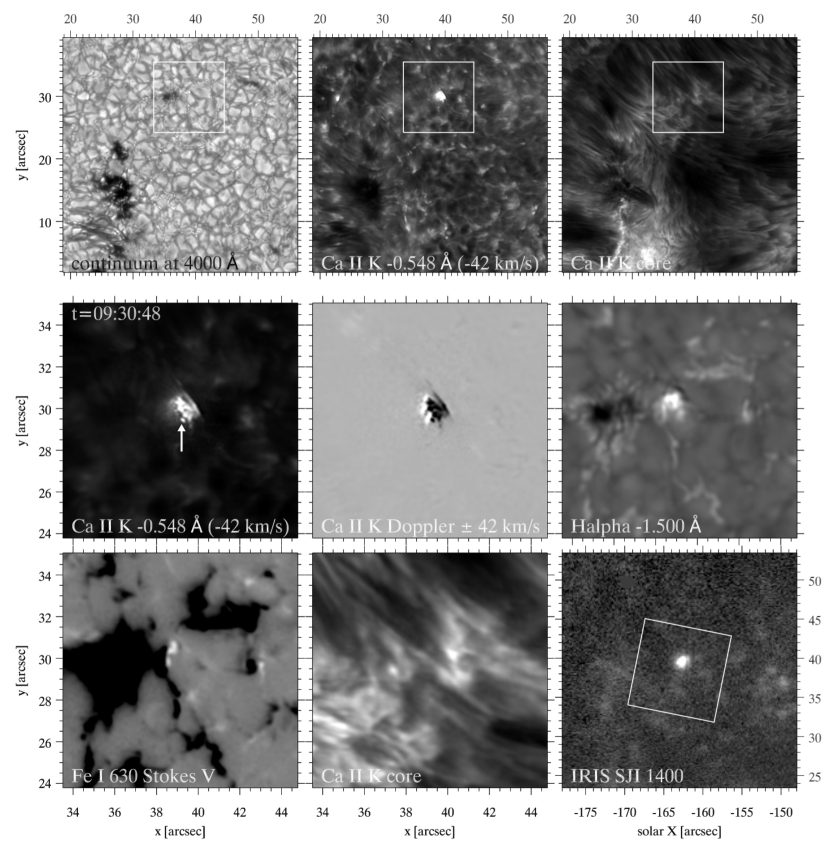
Visual inspection of the Ca II K movies obtained with CHROMIS on all three days reveal a bewildering variety of fine-scale, highly dynamic phenomena, some of which evolve so rapidly that they are not fully captured by the cadence (12 to 25 s) of the timeseries. This is illustrated by the online animations that accompany Figs. 1 and 2. These figures highlight the two events that are the focus of this paper. These are typical cases of UV bursts with strong emission in the wings of H and the Ca II K line, as well as the IRIS SJI 1400Å channel which is dominated by transition region Si IV emission. The Stokes V magnetogram movies show that in both cases the UV bursts are caused by a sequence of events that starts with emergence of flux (seen as an expanding bubble in the magnetograms) followed by cancellation of the newly emerged flux with the strong pre-existing neighboring plage fields, most plausibly accompanied by magnetic reconnection. The whole process occurs on timescales of order 5-15 min and is set by the evolution of the photospheric magnetic field. The chromospheric and transition region response is much more dynamic, as illustrated with the Ca II K images from CHROMIS and the SJI movies from IRIS. Both events appear to occur underneath a set of fibrils that overlie the cancellation site as can be seen in the Ca II K core images. The response to the reconnection, i.e., the UV burst, becomes visible in the wings of the chromospheric lines (as previously reported, e.g., by Vissers et al., 2015). In H this is manifested as typical Ellerman bomb profiles with strongly enhanced wings. The extremely high resolution enabled by CHROMIS allows us to now better spatially resolve some of the substructure of these UV bursts. We are struck by the spatial and temporal intermittency of the brightenings in both the blue and red wings of Ca II K. This intermittency manifests itself in the wing images as tiny blob-like features that rapidly change in position and sometimes in shape from one timestep to the next, suggesting that the dynamic evolution is not always properly tracked. Nevertheless we see several occasions when blob-like features last for several timesteps and rapidly move away from the cancellation site. These features are visible in the wings at velocities of order 40 km s-1 as illustrated by the Ca II K Dopplergrams in Figs. 1 and 2 and the spectral line profiles in Fig. 3. A white arrow marks an example of an isolated, FWHM 014 wide blob in Fig. 1, and a 012 wide blob in Fig. 2. Both the line-of-sight (LOS) and plane-of-the-sky velocities are in excess of the typical values for the speed of sound in the chromosphere ( km s-1), and of order the Alfvén speed, suggesting a magnetic origin for the driving mechanism that accelerates the plasma.
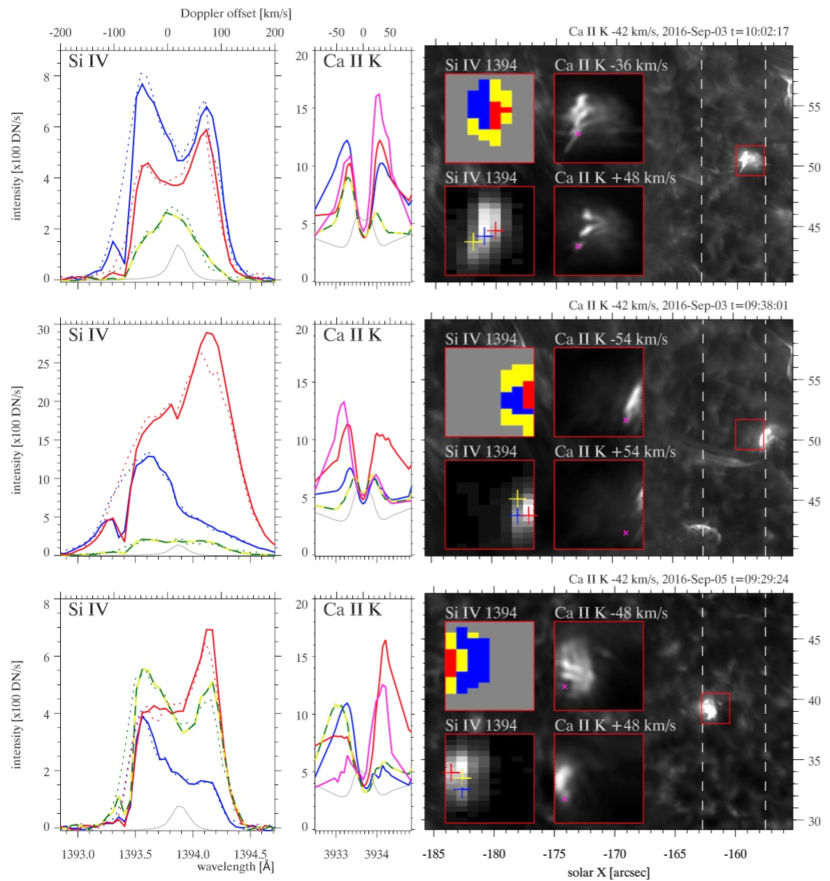
The blobs often disappear from the chromospheric passband within one timestep, which, given the clear counterpart in the IRIS transition region SJI channel, suggests that significant heating is occurring and depletion of Ca II due to ionization at high temperature. The transition region spectra associated with these events show profiles that are common in classical explosive events (Innes et al., 2015). We see profiles that are strongly Doppler shifted to the blue or red (Fig. 3 ), as well as profiles that are more centered around 0 km s-1 with very broad wings up to 100 km s-1. These profiles are non-Gaussian and often show triangular-shaped profiles, which Innes et al. (2015) and Guo et al. (2017) have suggested are caused by reconnection driven by the plasmoid instability. The spatial pattern of these strongly broadened explosive event type profiles in Si IV is illustrated in Fig. 3 which shows a multitude of non-Gaussian, flat-topped or triangular-shaped, profiles, sometimes centered around 0 km s-1 (yellow), as well as strongly blue-shifted and red-shifted profiles in the vicinity. All of these observations are compatible with a scenario in which these events are caused by plasmoid-mediated magnetic reconnection, likely at a wide range of locations within the UV burst(s), with yellow profiles caused by pile-up of a variety of plasmoids, and red/blue-shifted profiles in the outflow regions (Innes et al., 2015; Guo et al., 2017). This tentative scenario is based on idealized numerical simulations, but finds strong support from our discovery of the highly intermittent nature of the UV burst brightenings mediated by dynamic, fine-scale blob-like structures in the CHROMIS data.
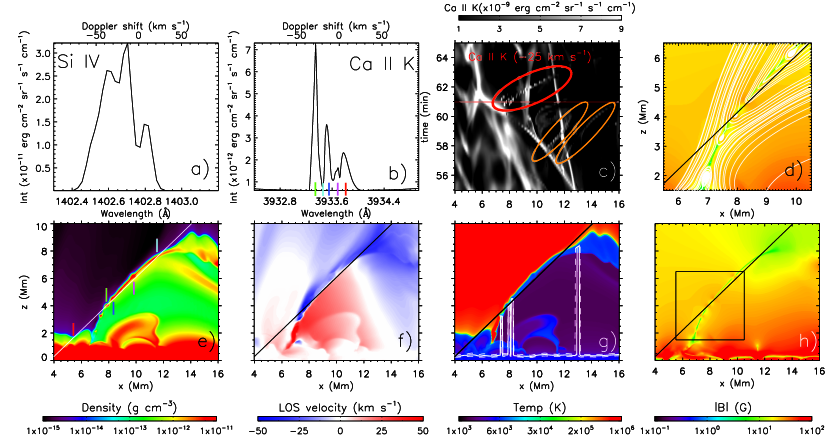
Additional support for this scenario comes from advanced numerical simulations in which flux emergence leads to magnetic reconnection that results in a UV burst that is accompanied by a surge (for more details, see Nóbrega-Siverio et al., 2017). We focus here on the presence of plasmoids in this simulation. As shown in the online animation that accompanies Fig. 4, the reconnection quickly develops a sequence of plasmoids that propagate both upward and downward. Synthesis of Ca II K and Si IV observables from these simulations (Fig. 4) shows notable similarities with the observations. We see emergent Ca II K spectral line profiles that show enhanced components in the wings, in a similar fashion to those shown in Fig. 3: both in terms of relative enhancement and range of Doppler shifts (note, however, that the synthetic profiles do not show a dark absorption core K3 like in the observations since the simulation does not have dense overlying fibrils). The synthetic profiles are caused by reconnection outflows filled with plasmoids which show significant redshifts and blueshifts. The marking of the height in Fig. 4g shows that the plasmoids are responsible for the bright blobs in the Ca II K wing. The magnetic reconnection in the simulation leads to substantial heating of plasma to at least transition region temperatures. This results in strong Si IV brightenings. The spectral line profile that emerges from a LOS along the current sheet shows substantially broadened profiles that often have non-Gaussian and sometimes triangular shapes. These profiles show a good resemblance with those observed (Fig. 3). Comparison with the velocity panel in Fig. 4 shows that the broadened Si IV comes about because the LOS includes multiple plasmoids with the upward and downward moving plasmoids in the outflow regions and the stationary plasmoids close to the current sheet. This confirms the scenario proposed by Guo et al. (2017) using idealized simulations.
The synthetic Si IV profiles are narrower than the observed ones, likely because the numerical resolution of the current simulation is not high enough to capture the multitude of plasmoids that in more idealized simulations (Innes et al., 2015) with much higher resolution lead to bright and broader spectral profiles. This is supported by numerical experiments in which the resolution of the current simulation is increased by a factor of two. Such high-resolution runs show a significant increase of the number of plasmoids, as expected from theoretical considerations, and more triangular shaped broadened profiles.
5. Conclusions
We have found evidence for intermittent magnetic reconnection driven by the plasmoid instability in UV bursts in the low solar atmosphere. We exploit the extremely high spatial resolution of the new CHROMIS instrument at the SST to reveal the presence of rapidly evolving blob-like features at Alfvénic speeds in the Ca II K line. We see evidence for substantial heating to transition region temperatures leading to highly broadened, non-Gaussian Si IV profiles observed with IRIS. Such profiles had previously been associated with reconnection mediated by the plasmoid instability based on idealized numerical simulations (Innes et al., 2015). This has now been placed on a solid footing by the direct observational evidence of tiny blob-like features, and by advanced numerical simulations of UV bursts which show remarkable similarities to the observations. Our results establish the presence of bright, non-Gaussian/triangular shaped spectral line profiles in spectroscopic data as good proxies for plasmoid-mediated reconnection. This finding will allow us to exploit spectroscopy to diagnose small-scale plasma physical processes like the plasmoid instability on spatial scales where imaging cannot reveal whether reconnection occurs and/or determine the dominant mode of reconnection.
References
- Bhattacharjee et al. (2009) Bhattacharjee, A., Huang, Y.-M., Yang, H., & Rogers, B. 2009, Physics of Plasmas, 16, 112102
- Carlsson & Leenaarts (2012) Carlsson, M., & Leenaarts, J. 2012, A&A, 539, A39
- de la Cruz Rodríguez et al. (2015) de la Cruz Rodríguez, J., Löfdahl, M. G., Sütterlin, P., Hillberg, T., & Rouppe van der Voort, L. 2015, A&A, 573, A40
- De Pontieu et al. (2014) De Pontieu, B., et al. 2014, Sol. Phys., 289, 2733
- Dere et al. (1989) Dere, K. P., Bartoe, J.-D. F., & Brueckner, G. E. 1989, Sol. Phys., 123, 41
- Gudiksen et al. (2011) Gudiksen, B. V., Carlsson, M., Hansteen, V. H., Hayek, W., Leenaarts, J., & Martínez-Sykora, J. 2011, A&A, 531, A154
- Guo et al. (2017) Guo, L., De Pontieu, B., & Peter, H. 2017, submitted to Science
- Hansteen et al. (2017) Hansteen, V. H., Archontis, V., Pereira, T. M. D., Carlsson, M., Rouppe van der Voort, L., & Leenaarts, J. 2017, ApJ, 839, 22
- Hayek et al. (2010) Hayek, W., Asplund, M., Carlsson, M., Trampedach, R., Collet, R., Gudiksen, B. V., Hansteen, V. H., & Leenaarts, J. 2010, A&A, 517, A49+
- Innes et al. (2015) Innes, D. E., Guo, L.-J., Huang, Y.-M., & Bhattacharjee, A. 2015, ApJ, 813, 86
- Innes et al. (1997) Innes, D. E., Inhester, B., Axford, W. I., & Wilhelm, K. 1997, Nature, 386, 811
- Ko et al. (2003) Ko, Y.-K., Raymond, J. C., Lin, J., Lawrence, G., Li, J., & Fludra, A. 2003, ApJ, 594, 1068
- Leenaarts et al. (2012) Leenaarts, J., Pereira, T., & Uitenbroek, H. 2012, A&A, 543, A109
- Lin et al. (2008) Lin, J., Cranmer, S. R., & Farrugia, C. J. 2008, Journal of Geophysical Research (Space Physics), 113, A11107
- Lin et al. (2005) Lin, J., Ko, Y.-K., Sui, L., Raymond, J. C., Stenborg, G. A., Jiang, Y., Zhao, S., & Mancuso, S. 2005, ApJ, 622, 1251
- Lin et al. (2007) Lin, J., Li, J., Forbes, T. G., Ko, Y.-K., Raymond, J. C., & Vourlidas, A. 2007, ApJ, 658, L123
- Liu (2013) Liu, R. 2013, MNRAS, 434, 1309
- Löfdahl et al. (2017) Löfdahl, M. G., Hillberg, T., & de la Cruz Rodríguez, J. 2017, A&A, in prep.
- Loureiro et al. (2007) Loureiro, N. F., Schekochihin, A. A., & Cowley, S. C. 2007, Physics of Plasmas, 14, 100703
- Milligan et al. (2010) Milligan, R. O., McAteer, R. T. J., Dennis, B. R., & Young, C. A. 2010, ApJ, 713, 1292
- Ni et al. (2015) Ni, L., Kliem, B., Lin, J., & Wu, N. 2015, ApJ, 799, 79
- Ni et al. (2017) Ni, L., Zhang, Q.-M., Murphy, N. A., & Lin, J. 2017, ApJ, 841, 27
- Nóbrega-Siverio et al. (2016) Nóbrega-Siverio, D., Moreno-Insertis, F., & Martínez-Sykora, J. 2016, ApJ, 822, 18
- Nóbrega-Siverio et al. (2017) —. 2017, ApJ, in prep
- Olluri et al. (2013) Olluri, K., Gudiksen, B. V., & Hansteen, V. H. 2013, ApJ, 767, 43
- Pereira & Uitenbroek (2015) Pereira, T. M. D., & Uitenbroek, H. 2015, A&A, 574, A3
- Peter et al. (2014) Peter, H., et al. 2014, Science, 346, 1255726
- Priest (2014) Priest, E. 2014, Magnetohydrodynamics of the Sun (Cambridge University Press)
- Scharmer et al. (2003) Scharmer, G. B., Bjelksjö, K., Korhonen, T. K., Lindberg, B., & Petterson, B. 2003, in Society of Photo-Optical Instrumentation Engineers (SPIE) Conference Series, Vol. 4853, Society of Photo-Optical Instrumentation Engineers (SPIE) Conference Series, ed. S. L. Keil & S. V. Avakyan, 341–350
- Scharmer et al. (2008) Scharmer, G. B., et al. 2008, ApJ, 689, L69
- Singh et al. (2012) Singh, K. A. P., Isobe, H., Nishizuka, N., Nishida, K., & Shibata, K. 2012, ApJ, 759, 33
- Uitenbroek (2001) Uitenbroek, H. 2001, ApJ, 557, 389
- van Noort et al. (2005) van Noort, M., Rouppe van der Voort, L., & Löfdahl, M. G. 2005, Sol. Phys., 228, 191
- Vissers et al. (2015) Vissers, G. J. M., Rouppe van der Voort, L. H. M., Rutten, R. J., Carlsson, M., & De Pontieu, B. 2015, ApJ, 812, 11
- Yang et al. (2013) Yang, L., He, J., Peter, H., Tu, C., Zhang, L., Feng, X., & Zhang, S. 2013, ApJ, 777, 16
- Zhang & Ji (2014) Zhang, Q. M., & Ji, H. S. 2014, A&A, 567, A11
- Zhang et al. (2016) Zhang, Q. M., Ji, H. S., & Su, Y. N. 2016, Sol. Phys., 291, 859
- Zhang & Zhang (2017) Zhang, Y., & Zhang, J. 2017, ApJ, 834, 79