Detection of GeV -ray emission in the direction of HESS J1731-347 with Fermi-LAT
Abstract
We report the detection of GeV -ray emission from supernova remnant HESS J1731-347 using 9 years of Fermi Large Area Telescope data. We find a slightly extended GeV source in the direction of HESS J1731-347. The spectrum above 1 GeV can be fitted by a power-law with an index of , and the GeV spectrum connects smoothly with the TeV spectrum of HESS J1731-347. Either a hadronic-leptonic or a pure leptonic model can fit the multi-wavelength spectral energy distribution of the source. However, the hard GeV -ray spectrum is more naturally produced in a leptonic (inverse Compton scattering) scenario, under the framework of diffusive shock acceleration. We also searched for the GeV -ray emission from the nearby TeV source HESS J1729-345. No significant GeV -ray emission is found, and upper limits are derived.
Subject headings:
gamma rays: general - gamma rays: ISM - ISM: individual objects (HESS J1731-347) - ISM: supernova remnants - radiation mechanisms: non-thermal1. Introduction
It is widely believed that supernova remnants (SNRs) are the main accelerators of Galactic cosmic rays (CRs) with energies up to the knee. This is supported by the non-thermal X-ray emission detected in many SNRs, which indicates the acceleration of electrons to hundreds of TeV energies (e.g., Koyama et al., 1995). The GeV and/or TeV -rays have also been detected in some SNRs, for example, RCW 86 (Aharonian et al., 2009; Yuan et al., 2014); Cas A (Albert et al., 2007a; Abdo et al., 2010a); CTB 37B (Aharonian et al., 2008a; Xin et al., 2016); Puppis A (Hewitt et al., 2012; Xin et al., 2017); IC 443 (Albert et al., 2007b; Acciari et al., 2009; Ackermann et al., 2013); W44 (Abdo et al., 2010b; Ackermann et al., 2013). Gamma-rays can be produced by the decay of neutral pions due to the inelastic collisions (the hadronic process), the Inverse Compton Scattering (ICS) or bremsstrahlung process of relativistic electrons (the leptonic process). For some SNRs interacting with dense molecular clouds, the evidence for acceleration of nuclei has been suggested by GeV/TeV -ray observations (Li & Chen, 2010, 2012; Ackermann et al., 2013).
HESS J1731-347 (G353.6-0.7) was first observed as an unidentified very-high-energy (VHE; 100 GeV) -ray source by the High Energy Stereoscopic System (HESS) (Aharonian et al., 2008b). Tian et al. (2008) discovered the radio and X-ray counterparts of HESS J1731-347 and identified it as a shell-type SNR. Abramowski et al. (2011) carried out an additional -ray observation with HESS and detected its shell-type morphology. Together with RX J1713.7-3946 (Aharonian et al., 2004, 2006, 2007a), RX J0852.0-4622 (Aharonian et al., 2005, 2007b), RCW 86 (Aharonian et al., 2009; Abramowski et al., 2016) and SN 1006 (Acero et al., 2010), HESS J1731-347 becomes one of five firmly identified TeV shell-type SNRs (Rieger et al., 2013).
The distance of HESS J1731-347 is under debated. Tian et al. (2008) argued that HESS J1731-347 locates at 3.2 kpc if it is associated with the nearby HII region G353.42-0.37. By comparing the absorption column density derived from the X-ray observation and that obtained from 12CO and HI observations, Abramowski et al. (2011) set 3.2 kpc as a lower limit of its distance, which is reinforced by Doroshenko et al. (2017). In addition, Fukuda et al. (2014) suggested that HESS J1731-347 is correlated with the interstellar proton cavity at a velocity range from km s-1 to km s-1, indicating a distance of 5.26.1 kpc. However, no significant emission from dense molecular gas traced by CS(1-0) line coincides with HESS J1731-347 at that distance (Maxted et al., 2017). Due to uncertainties of the distance and other parameters, the age of HESS J1731-347 is estimated to be in a wide range of kyr (Tian et al., 2008; Abramowski et al., 2011; Fukuda et al., 2014; Acero et al., 2015b).
HESS J1731-347 and its sub-regions were detected in the X-ray band by ROSAT, XMM-Newton and Suzaku, with an X-ray morphology consistent with the radio shell (Tian et al., 2008, 2010; Abramowski et al., 2011; Bamba et al., 2012; Doroshenko et al., 2017). The X-ray emission from the complete SNR and its sub-regions are found to be non-thermal. The X-ray spectral index is 2.66 for the entire SNR (Doroshenko et al., 2017), and is somewhat harder () for the north-east region (Abramowski et al., 2011). A compact object, XMMS J173203-344518, located near the geometrical center of the remnant, was detected by XMM-Newton, which was considered to be the central compact object (CCO) associated with HESS J1731-347 (Tian et al., 2010; Halpern & Gotthelf, 2010; Abramowski et al., 2011).
Yang et al. (2014) and Acero et al. (2015b) searched for the GeV -ray emission from HESS J1731-347 with the Fermi Large Area Telescope (Fermi-LAT; Atwood et al., 2009) data. No significant signal was detected and only the upper limits were given. Furthermore, no candidate source in the third Fermi-LAT source catalog (3FGL; Acero et al., 2015a) is found to be associated with HESS J1731-347.
In this paper, we revisit the GeV -ray emission in the direction of HESS J1731-347, with 9 year Pass 8 data recorded by Fermi-LAT. A statistically significant excess which is positionally consistent with HESS J1731-347 is found. In Section 2, we present the data analysis and results, including the spatial and spectral analysis. Based on the multi-wavelength observations of HESS J1731-347, we model the non-thermal radiation of it in Section 3. The conclusion of this work is presented in Section 4.
2. Data Analysis
2.1. Data Reduction
We select the latest Pass 8 version of the Fermi-LAT data with “Source” event class (evclass=128 & evtype=3), recorded from August 4, 2008 (Mission Elapsed Time 239557418) to August 4, 2017 (Mission Elapsed Time 523497605). The region of interest (ROI) is chosen to be a box centered at HESS J1731-347. In order to have a good angular resolution, we adopt the events with energies between 1 GeV and 300 GeV in this analysis. In addition, the events whose zenith angles are larger than are excluded to reduce the contamination from the Earth Limb. The data are analyzed with the Fermi-LAT Science Tools v10r0p5111http://fermi.gsfc.nasa.gov/ssc/data/analysis/software/, and the standard binned likelihood analysis method gtlike. The diffuse backgrounds used are gll_iem_v06.fits and iso_P8R2_SOURCE_V6_v06.txt, which can be found from the Fermi Science Support Center222http://fermi.gsfc.nasa.gov/ssc/data/access/lat/BackgroundModels.html. All sources listed in the 3FGL and the two diffuse backgrounds are included in the model. During the fitting procedure, the spectral parameters and the normalizations of sources within around HESS J1731-347, together with the normalizations of the two diffuse backgrounds, are left free.
2.2. Results
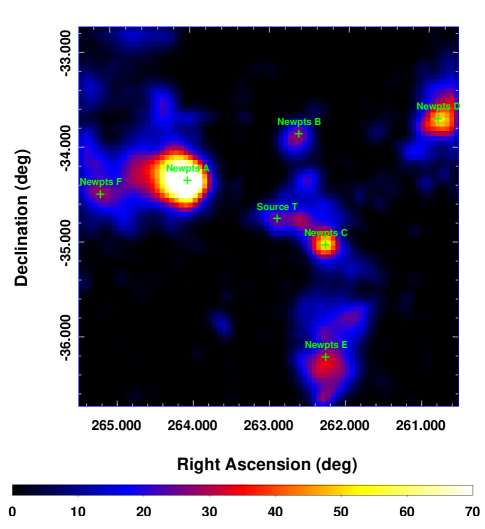
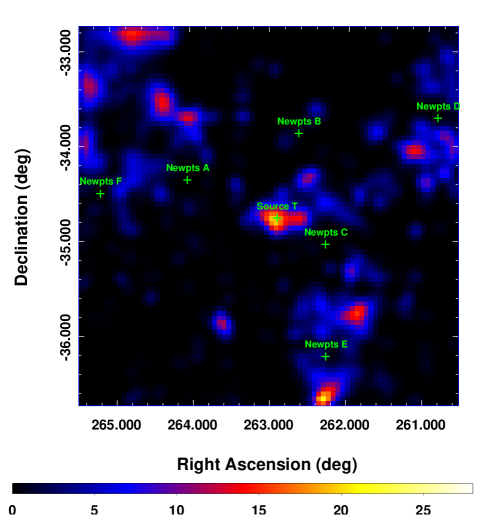
We create a TS (test statistic, which is essentially the logarithmic likelihood ratio between different models) map centered at HESS J1731-347 by slice the center of the box along each axis, after subtracting the 3FGL sources and the diffuse backgrounds. There are still excesses in this TS map, as marked out by green crosses. At the center of the TS map, a weak excess (labelled as Source T) is found to be spatially coincident with HESS J1731-347. It is noted that Newpts C was also detected in Yang et al. (2014) with a TS value of about 20. We add Source T and the other six new sources, from A to F, in the model as additional point sources with power-law (PL) spectra, and re-do the likelihood fitting. The positions of these new sources are optimized by the gtfindsrc tool. Best-fitting results of their coordinates and TS values are listed in Table 1. The TS value of Source T is about 25.9, and its best-fitting position is R.A., Dec. with 1 error circle of . The residual TS map after subtracting the additional sources A to F is shown in the right panel Figure 1.
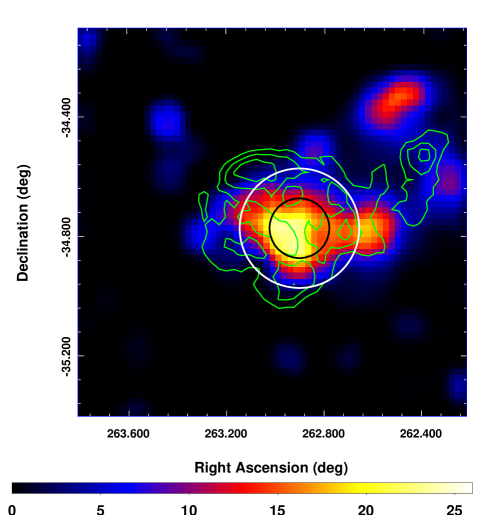
Figure 2 gives a zoom-in of Figure 1b in order to better show the spatial distribution of the target source T and its relationship with HESS J1731-347. The GeV -ray emission overlaps with part of the VHE emission region shown by the contours (Abramowski et al., 2011). However, the GeV TS map does not fully overlap with the TeV image, which is possibly due to the large point spread function (PSF) of Fermi-LAT and/or the fluctuation of the weak signal. Similar cases were also shown for SN 1006 (Xing et al., 2016) and HESS J1534-571 (Araya, 2017).
| Name | R.A. | Dec. | TS | |
|---|---|---|---|---|
| [deg] | [deg] | [deg] | ||
| Source T | ||||
| Newpts A | ||||
| Newpts B | ||||
| Newpts C | ||||
| Newpts D | ||||
| Newpts E | ||||
| Newpts F |
2.2.1 Spatial Extension
Considering that HESS J1731-347 has an extended morphology in radio, X-ray, and TeV -ray bands, we carried out an extension test with different spatial models. We used a uniform disk centered at the best-fitting position of Source T with radius of , , , and , as well as the TeV -ray image of HESS J1731-347, as spatial templates of Source T. The TS values for different spatial models are listed in Table 2. We found that a disk template gives the highest TS value, 33.9, which corresponds to a significance of for five (2 for the coordinates, 1 for the radius, and 2 for the spectrum) degrees of freedom (dof). For the four adopted disk templates, the TS values do not differ much from each other. Compared with the point source hypothesis, the data favors slightly an extended morphology. Using the TeV -ray template, a TS value of 25 is found. These results are quite consistent with that of Condon et al. (2017), which used the data with different energy ranges and observation time-series. In the following analysis, we adopt the disk template for Source T.
We also try to search for -ray emission from the nearby TeV source HESS J1729-345. The TeV image of HESS J1729-345 is used as the spatial template. No significant GeV -ray emission from the direction of HESS J1729-345 is detected. The TS value of HESS J1729-345 is about 4, and its flux upper limits will be derived (see the next sub-section).
| Spatial Model | TS | Degrees of Freedom |
|---|---|---|
| Point Source | ||
| Uniform Disk | ||
| Uniform Disk | ||
| Uniform Disk | ||
| Uniform Disk | ||
| TeV Image |
2.2.2 Spectral Analysis
For Source T, the global fit in the 1300 GeV energy range with a disk template gives a spectral index of , and an integral photon flux of photon cm-2 s-1 with statistical errors only. Assuming a distance of 3.2 kpc (Tian et al., 2008; Nayana et al., 2017), the -ray luminosity between 1 GeV and 300 GeV is erg s-1.
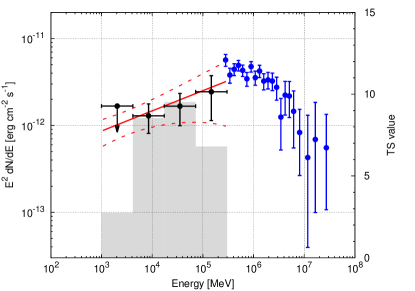
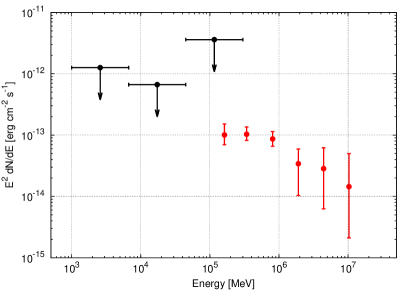
The data is further divided into four energy bins with equal width in the logarithmic space to study is spectral energy distribution (SED). For each energy bin, we repeat the likelihood analysis, with only the normalizations of the sources within around Source T and the diffuse backgrounds in the model free. The spectral parameters of these sources are fixed to be the best-fitting values obtained in the global likelihood analysis. If the TS value of Source T is smaller than 4 in an energy bin, a 95% confidence level upper limit is given. The results of the SED are shown in Figure 3. The GeV SED connects smoothly with the TeV spectrum of HESS J1731-347. The spatial coincidence and a smoothly connected -ray spectrum suggest that Source T is the GeV counterpart of HESS J1731-347.
The significance of HESS J1729-345 is not high enough, and we derive the flux upper limits in energy bins of , , and GeV, which are shown in Figure 4.
3. Discussion
The radio counterpart of HESS J131-347 was firstly identified by Tian et al. (2008). The integrated flux density was derived to be Jy at 1420 MHz, through extrapolating that of one half of the remnant at low Galactic latitudes to the total SNR. With the Giant Metrewave Radio Telescope (GMRT), Nayana et al. (2017) observed the complete shell of HESS J131-347 at 325 MHz, and obtained an integrated flux density of Jy. In the following models, we use the result of Nayana et al. (2017) to constrain the model parameters. The X-ray flux of the full SNR given by Doroshenko et al. (2017) is also used.
We assume either a pure leptonic model or a hadronic-leptonic hybrid one to fit the wide-band SED from radio to TeV -rays. The spectrum of electrons or protons is assumed to be an exponential cutoff power-law form
where i = e or p, is the spectral index, is the cutoff energy of particles. and describes the sharpness of the cutoff. describes the sharpness of the cutoff, and we adopt the typical values of 0.5, 0.6 and 1.0 to constrain the parameters in the model. The radius of the SNR is nearly in the radio band (Tian et al., 2008; Nayana et al., 2017), and in the TeV band (Abramowski et al., 2011). Such an angular size corresponds to a physical radius of about pc for a distance of 3.2 kpc. The gas density in the vicinity of HESS J1731-347 is quite uncertain, due to the lack of thermal X-ray emissions. We assume a nominal value of cm-3.
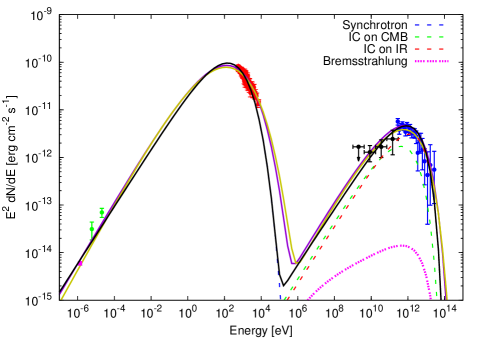
For the leptonic model, the background radiation field considered includes the cosmic microwave background (CMB), and an infrared (IR) radiation field with a temperature of 40 K and an energy density of 1 eV cm-3 (Abramowski et al., 2011). The magnetic field strength is taken as a free parameter, which is determined through fitting to the multi-wavelength data. The derived model parameters are given in Table 3. The corresponding multi-wavelength SED of the model calculation is shown in the left panel of Figure 5.
The leptonic models with the three different values of can reproduce the muti-wavelength SED with little differences. Compared with the results of Yang et al. (2014), the spectral index of electrons and cutoff energy are both slightly smaller in this work. This may due to the updated radio, X-ray and GeV data we used in the model. The magnetic field strength, G, is consistent with that given in Yang et al. (2014). Such a magnetic field strength is slightly larger than that of several other SNRs which show similar GeV-TeV -ray spectra, e.g. RX J1713.7-3946 (Abdo et al., 2011; Yuan et al., 2011; Zeng et al, 2017), RX J0852-4622 (Vela Junior; Tanaka et al., 2011), and RCW 86 (Yuan et al., 2014). These SNRs are believed to be a class of sources with leptonic origin of the -ray emission (Yuan et al., 2012; Funk, 2015; Guo et al., 2017).
The cutoff of the spectrum may be due to the (synchrotron) cooling of electrons. The synchrotron cooling time scale of HESS J1731-347 is estimated to be
This time scale is close to the minimum value of the age of HESS J1731-347 inferred with other methods (Tian et al., 2008; Abramowski et al., 2011; Fukuda et al., 2014; Acero et al., 2015b).
Nayana et al. (2017) reported an anti-correlation between the TeV -ray emission and radio brightness profile, and ascribed such an anti-correlation to the synchrotron cooling effect with a non-uniform magnetic field. This result supports the leptonic scenario for the multi-wavelength emission of HESS J1731-347.
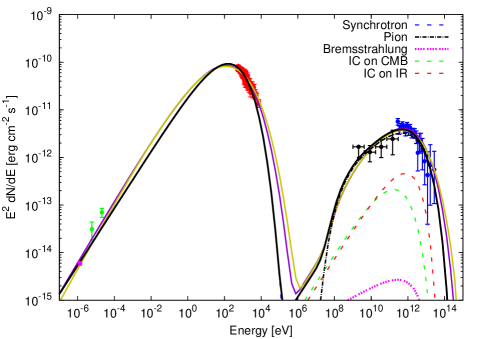
The right panel of Figure 5 shows the multi-wavelength SED of the hadronic-leptonic hybrid model, in which the radio to X-ray data is acounted for by the synchrotron emission of electrons, and the GeV-TeV -ray emission is produced by the decay of neutral pions from collisions. The model parameters are also summarized in Table 3. For the hybrid models with different values of , a hard spectral index of protons with even , is needed to explain the hard GeV -ray spectrum. However, such spectrum of protons is difficult to be produced in the conventional diffusive shock acceleration model of strong shocks. The total energy of protons above 1 GeV is estimated to be , corresponding to 15% particle acceleration efficiency for a typical total energy of erg released by a core-collapse supernova. The total energy depends on the distance and ambient gas density of HESS J1731-347. Since there is no thermal X-ray emission observed, the gas density would be very low, (e.g., Abramowski et al. (2011) derived an upper limit of gas density of cm-3 assuming an electron plasma temperature of 1 keV), and hence the corresponding would be much higher. However, if HESS J1731-347 expands in an inhomogeneous environment with dense gas clumps, the hard -ray emission and the high energy budget can be solved (Inoue et al., 2012; Gabici & Aharonian, 2014; Fukui, 2013).
A spatial correlation between the TeV -ray shell and the interstellar protons at a distance of 5.2 kpc was reported in Fukuda et al. (2014). It was suggested that the hadronic process contributes a large fraction of the -ray emission of HESS J1731-347 (Fukuda et al., 2014). This is similar to the cases of RX J1713.7-3946 and RX J0852.0-4622 (Fukui et al., 2012; Fukui, 2013). However, no significant emission from dense molecular gas at such a distance was detected by Maxted et al. (2017), which seems to be challenge to the hadronic scenario.
| Model | |||||||||
|---|---|---|---|---|---|---|---|---|---|
| (G) | ( erg) | (TeV) | ( erg) | (TeV) | |||||
| Leptonic | |||||||||
| Hybrid | |||||||||
HESS J1729-345 is an unidentified TeV source near HESS J1731-347 (Abramowski et al., 2011). Assuming that HESS J1731-347 locates at a distance of 3.2 kpc, Cui et al. (2016) suggested that the TeV -ray emission of HESS J1729-345 possibly originates from the nearby molecular clouds illuminated by the CRs escaped from HESS J1731-347. Capasso et al. (2016) reported a good spatial coincidence between the TeV -ray image in the bridge region and the dense gas at a distance of 3.2 kpc, which further supports the scenario of Cui et al. (2016). Nayana et al. (2017) detected possible radio counterparts of HESS J1729-345 at 843 MHz and 1.4 GHz. However, the multi-wavelength data of HESS J1729-345 is still lack. Future multi-wavelength observations are need to explore its nature.
4. Conclusion
In this paper, we report the GeV -ray emission from the direction of HESS J1731-347 at a significance level of , with nine years of Pass 8 data recorded by the Fermi-LAT. The spatial morphology of HESS J1731-347 is found to be slightly extended in the GeV band. The GeV spectrum can be described by a hard PL for with an index of .
The -ray characteristics of HESS J1731-347 is similar with several shell-type SNRs, including RX J1713.7-3946, RX J0852-4622, RCW 86, and SN 1006. A pure leptonic model can account for the wide-band SED of HESS J1731-347. If the hadronic process is adopted to explain the -ray emission, a very hard () proton spectrum is required. In addition, the energy budget of CR protons may be a problem, given a potentially low gas density environment implied by the lack of thermal X-ray emission.
We also search for GeV -ray emission from the nearby source HESS J1729-345. No significant excess is detected in its direction, and the upper limits are given. More multi-wavelength observations are necessary to address its emission mechanism, and test the proposed scenario of the interaction between CRs escaped from HESS J1731-347 and the molecular clouds.
Acknowledgments
We thank V. Doroshenko for providing the new X-ray data. This work is supported by National Key Program for Research and Development (2016YFA0400200), the National Natural Science Foundation of China (Nos. 11433009, 11525313, 11722328, 11703093), Natural Science Foundation of Jiangsu Province of China (No. BK20141444), and the 100 Talents program of Chinese Academy of Sciences.
References
- Abdo et al. (2010a) Abdo, A. A., Ackermann, M., Ajello, M., et al. 2010a, ApJL, 710, L92
- Abdo et al. (2010b) Abdo, A. A., Ackermann, M., Ajello, M., et al. 2010b, Sci, 327, 1103
- Abdo et al. (2011) Abdo, A. A., Ackermann, M., Ajello, M., et al. 2011, ApJ, 734, 28
- Abramowski et al. (2011) Abramowski, A., Acero, F., Aharonian, F., et al. 2011, A&A, 531, A81
- Abramowski et al. (2016) Abramowski, A., Aharonian, F., Ait Benkhali, F. et al. arXiv:1601.04461
- Acciari et al. (2009) Acciari, V. A., Aliu, E., Arlen, T., et al. 2009, ApJL, 698, L133
- Acero et al. (2015a) Acero, F., Ackermann, M., Ajello, M., et al. 2015, ApJS, 218, 23
- Acero et al. (2010) Acero, F., Aharonian, F., Akhperjanian, A. G., et al. 2010, A&A, 516, A62
- Acero et al. (2015b) Acero, F., Lemoine-Goumard, M., Renaud, M., et al. 2015, A&A, 580, A74
- Ackermann et al. (2013) Ackermann, M., Ajello, M., Allafort, A., et al. 2013, Sci, 339, 807
- Aharonian et al. (2004) Aharonian, F., Akhperjanian, A. G., Aye, K.-M., et al. 2004, Natur, 432, 75
- Aharonian et al. (2005) Aharonian, F., Akhperjanian, A. G., Bazer-Bachi, A. R., et al. 2005, A&A, 437, L7
- Aharonian et al. (2006) Aharonian, F., Akhperjanian, A. G., Bazer-Bachi, A. R., et al. 2006, A&A, 449, 223
- Aharonian et al. (2007a) Aharonian, F., Akhperjanian, A. G., Bazer-Bachi, A. R., et al. 2007a, A&A, 464, 235
- Aharonian et al. (2007b) Aharonian, F., Akhperjanian, A. G., Bazer-Bachi, A. R., et al. 2007b, ApJ, 661, 236
- Aharonian et al. (2008a) Aharonian, F., Akhperjanian, A. G., de Alemida, U. B., et al. 2008a, A&A, 486, 829
- Aharonian et al. (2008b) Aharonian, F., Akhperjanian, A. G., de Almeida, U. B., et al. 2008b, A&A, 477, 353
- Aharonian et al. (2009) Aharonian, F., Akhperjanian, A. G., de Almeida, U. B., et al. 2009, ApJ, 692, 1500
- Albert et al. (2007a) Albert, J., Aliu, E., Anderhub, H., et al. 2007a, A&A, 474, 937
- Albert et al. (2007b) Albert, J., Aliu, E., Anderhub, H., et al. 2007b, ApJL, 664, L87
- Araya (2017) Araya, M, 2017, ApJ, 843, 12
- Atwood et al. (2009) Atwood, W. B., Abdo, A. A., Ackermann, M., et al. 2009, ApJ, 697, 1071
- Bamba et al. (2012) Bamba, A., Pühlhofer, G., Acero, F., et al. 2012, ApJ, 756, 149
- Capasso et al. (2016) Capasso, M., Condon, B., Coffaro, M., et al. 2016, arXiv:1612.00258
- Condon et al. (2017) Condon, B., Lemoine-Goumard, M., Acero, F. & Katagiri, H. 2017, arXiv:1711.05499
- Cui et al. (2016) Cui, Y., Pühlhofer, G., & Santangelo, A. 2016, A&A, 591, A68
- Doroshenko et al. (2017) Doroshenko, V., Pühlhofer, G., Bamba, A., et al. 2017, arXiv:1708.04110
- Fukuda et al. (2014) Fukuda, T., Yoshiike, S., Sano, H., et al. 2014, ApJ, 788, 94
- Fukui et al. (2012) Fukui, Y., Sano, H., Sato, J., et al. 2012, ApJ, 746, 82
- Fukui (2013) Fukui, Y. 2013, in Astrophysics and Space Science Proc., Vol. 34, Cosmic Rays in Star-Forming Environments, ed. D. F. Torres & O. Reimer (Berlin: Springer), 249
- Funk (2015) Funk, S. 2015, Annual Review of Nuclear and Particle Science, 65, 245
- Gottschall et al. (2016) Gottschall, D., Capasso, M., Deil, C., et al. 2016, arXiv:1612.00261
- Gabici & Aharonian (2014) Gabici, S. & Aharonian, F. A. 2014, MNRAS, 445, L70
- Guo et al. (2017) Guo, X.-L., Xin, Y.-L., Liao, N.-H., et al. 2017, ApJ, 835, 42
- Halpern & Gotthelf (2010) Halpern, J. P., & Gotthelf, E. V. 2010, ApJ, 710, 941
- Hewitt et al. (2012) Hewitt, J. W., Grondin, M.-H., Lemoine-Goumard, M., et al. 2012, ApJ, 759, 89
- Inoue et al. (2012) Inoue, T., Yamazaki, R., Inutsuka, S., & Fukui, Y. 2012, ApJ, 744, 71
- Koyama et al. (1995) Koyama, K., Petre, R., Gotthelf, E. V., et al. 1995, Nature, 378, 255
- Li & Chen (2010) Li, H. & Chen, Y. 2010, MNRAS, 409, L35
- Li & Chen (2012) Li, H. & Chen, Y. 2012, MNRAS, 421, 935
- Maxted et al. (2017) Maxted, N., Burton, M., Braiding, C., et al. 2017, arXiv:1710.06101
- Nayana et al. (2017) Nayana, A. J., Chandra, P., Roy, S., et al. 2017, MNRAS, 467, 155
- Rieger et al. (2013) Rieger, F. M., de Oña-Wilhelmi, E., & Aharonian, F. A., 2013, Front. Phys., 8, 714
- Tanaka et al. (2011) Tanaka, T., Allafort, A., Ballet, J., et al. 2011, ApJL, 740, L51
- Tian et al. (2008) Tian, W.-W., Leahy, D. A., Haverkorn, M., & Jiang, B. 2008, ApJL, 679, L85
- Tian et al. (2010) Tian, W.-W., Li, Z., Leahy, D. A., et al. 2010, ApJ, 712, 790
- Xin et al. (2016) Xin, Y.-L., Liang, Y.-F., Li, X., et al. 2016, ApJ, 817, 64
- Xin et al. (2017) Xin, Y.-L., Guo, X.-L., Liao, N.-H., et al. 2017, ApJ, 843, 90
- Xing et al. (2016) Xing, Y., Wang, Z., Zhang, X., & Chen, Y. 2016, ApJ, 823, 44
- Yang et al. (2014) Yang, R.-Z., Zhang, X., Yuan, Q., & Liu, S.-M. 2014, A&A, 567, A23
- Yuan et al. (2014) Yuan, Q., Huang, X.-Y., Liu, S.-M., & Zhang, B. 2014, ApJL, 785, L22
- Yuan et al. (2012) Yuan, Q., Liu, S.-M., & Bi, X.-J. 2012, ApJ, 761, 133
- Yuan et al. (2011) Yuan, Q., Liu, S. M., Fan, Z. H., Bi, X. J., & Fryer, C. L. 2011, ApJ, 735, 120
- Zeng et al (2017) Zeng, H.-D., Xin, Y.-L., Liu, S.-M., et al. 2017, ApJ, 834, 153