Unveiling the bosonic nature of an ultrashort few-electron pulse
Abstract
Abstract
Quantum dynamics is very sensitive to dimensionality.
While two-dimensional electronic systems form Fermi liquids, one-dimensional systems –
Tomonaga-Luttinger liquids – are described by purely bosonic excitations, even though they
are initially made of fermions.
With the advent of coherent single-electron sources, the quantum dynamics of such a liquid is now accessible at the single-electron level.
Here, we report on time-of-flight measurements of ultrashort few-electron charge pulses injected into a quasi one-dimensional quantum conductor.
By changing the confinement potential we can tune the system from the one-dimensional Tomonaga-Luttinger liquid limit to the multi-channel Fermi liquid and show that the plasmon velocity can be varied over almost an order of magnitude.
These results are in quantitative agreement with a parameter-free theory
and demonstrate a powerful new probe for directly investigating real-time dynamics of fractionalisation phenomena in low-dimensional conductors.
Introduction
A fundamental difference between bosons and fermions is that the former can be described at the classical macroscopic level while the latter cannot. In particular, in an ultrafast quantum nano-electronics setup, the experimentalist controls the - bosonic - electromagnetic degrees of the system and aims at injecting a single - fermionic - coherent electron in the system. This interplay between bosonic and fermionic statistics is a central feature in one-dimensional quantum systems as it provides a unique playground for the study of interaction effects giamarchi_book ; glazman-yacoby_nature_2010 .
The reduced dimensionality influences the interaction between particles and can lead to fascinating phenomena such as spin-charge separation yacoby_science_2005 , charge fractionalisation yacoby_nphys_2008 or Wigner crystallisation ilani_nphys_2013 . The low-energy collective bosonic excitations consist of charge and spin density waves that propagate at two different velocities. While the spin density is unaffected by the Coulomb interaction and propagates at Fermi velocity , the charge density is strongly renormalised by the interactions and propagates with the plasmon velocity , which is usually much faster than the Fermi velocity. Spin-charge separation has been experimentally probed in momentum resolved tunnelling experiments between two quantum wires yacoby_science_2005 as well as tunnelling from a quantum wire into a two-dimensional electron gas ford_science_2009 . In addition to spin-charge separation, charge fractionalisation occurs in one-dimensional systems safi_book_1995 ; safi_prb_1995 ; lederer_prb_2000 ; degiovanni_prb_2013 . Injecting an electron into a one-dimensional system with momentum conservation, the charge decomposes into right and left moving charge excitations, as demonstrated in [yacoby_nphys_2008 ]. Charge fractionalisation also occurs in a system of two coupled Tomonaga-Luttinger liquids. There, an electronic excitation present in one of the two channels fractionalises into a fast charge mode and a slow neutral mode, which are the eigenmodes of the coupled systemsukhorukov_prb_08 . This charge fractionalisation has been recently observed in a chiral two-channel Tomonaga-Luttinger liquid in the integer quantum Hall regimebocquillon_ncom_2013 ; heiblum_prl_2014 ; fujisawa_nnano_2014 ; feve_ncom_2015 ; fujisawa_nphys_2017 .
Here, we study the most general case where the system can be tuned continuously from a clean one-channel Tomonaga-Luttinger liquid to a multi-channel Fermi liquid in a non-chiral system. We use time-resolved measurement techniques ashoori_prb_1992 ; haug_prl_1996 to determine the time of flight kamata_prb_2010 ; kataoka_prl_2016 ; kumada_ncom_2013 of a single-electron voltage pulse and extract the collective charge excitation velocity. Our detailed modelling of the electrostatics of the sample allows us to construct and understand the excitations of the system in a parameter-free theory. We show that our self-consistent calculations capture well the results of the measurements, validating the construction of the bosonic collective modes from the fermionic degrees of freedom.
Results
Measurement principle
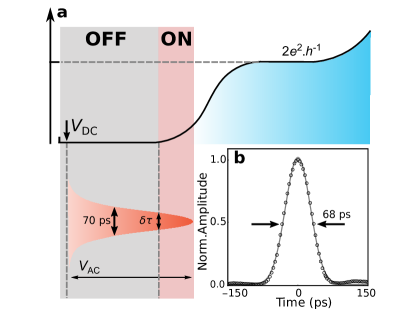
We tailor a long quasi one-dimensional wire into a two-dimensional electron gas using metallic surface gates as shown in Fig. 1a. A pump-probe technique has been implemented to measure in a time-resolved manner the shape as well as the propagation speed of the electron pulse. We apply an ultrashort voltage pulse ( ) to the left ohmic contact to generate the few-electron pulse. The pulse injection is repeated at a frequency of and the resulting DC current is measured at the right ohmic contact. Three quantum point contacts (QPCs) are placed along the quantum wire to measure the arrival time of the charge pulse at different positions. Simultaneously, another ultrashort voltage pulse is sent to one of the three QPCs which allows opening and closing the QPC on a timescale much faster than the width of the few-electron pulse (see methods section). By changing the time-delay between launching the electron pulse and the on–off switching of the QPC we can reconstruct the actual shape of the few-electron pulse kamata_prb_2010 ; kataoka_prl_2016 .
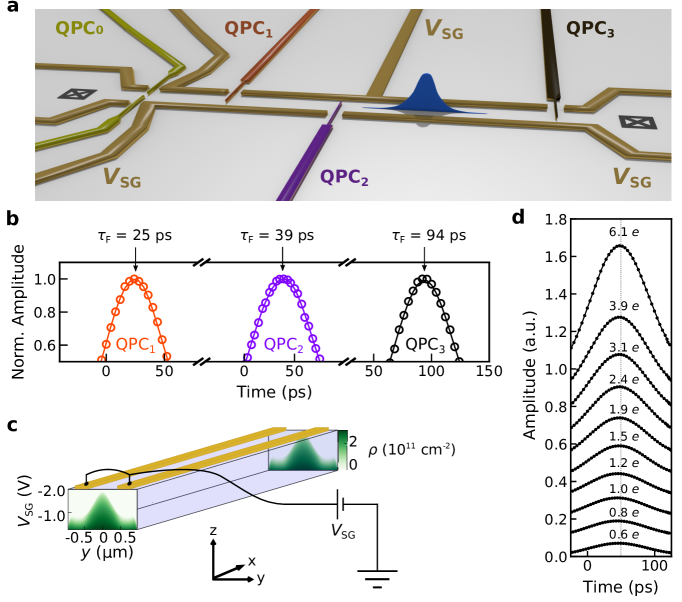
Time-of-flight measurements
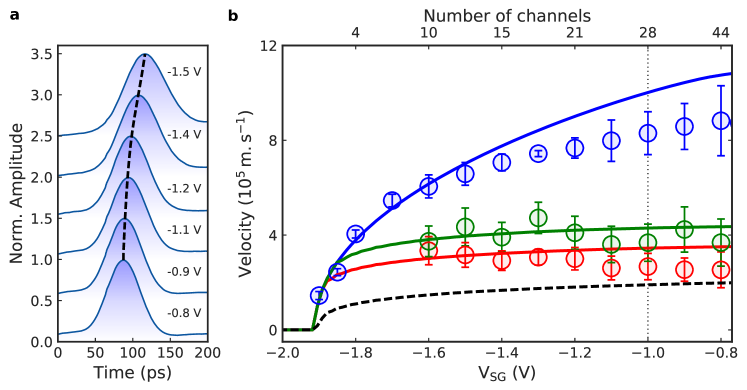
A typical time-resolved measurement is shown in Fig. 1b. We observe a few-electron pulse of Gaussian shape with a FWHM of . Measurements of the time of flight at different positions (Fig. 1b) allows us to determine its propagation speed, which we find to be independent of the number of electrons contained in the electron pulse (Fig. 1d). By changing the voltage on the side gates VSG it is possible to modify the propagation speed by almost an order of magnitude. As the confinement is made stronger, the arrival time of the electron pulse at the detection QPC is shifted to longer times, as seen in Fig. 2a. This, as it will be demonstrated further on, is an indication of a slower propagation speed and it is in stark contrast to standard DC measurements. Indeed, in DC the Coulomb interaction is screened by the Fermi sea and the electrons travel at the Fermi velocity, as shown by magnetic focusing experiments focussing_delft . The situation is very different when creating a local perturbation of the charge density. Applying a very short charge pulse results in an excess charge density created locally. Due to the generated electric field, the excess charge is displaced very rapidly at the surface of the Fermi sea giving rise to a collective excitation, a plasmon chaplik_1985 .
Effect of Coulomb interaction on the propagation velocity
In one dimension, an interacting wire is described by Tomonaga-Luttinger plasmons of bosonic charactergiamarchi_book . The problem of generalising the bosonization construction to a system containing an arbitrary number of conduction channels, , in the presence of Coulomb interactions has been treated theoretically by Matveev and Glazmanmatveev-glazman_1993 . The effect of the Coulomb potential is to couple the individual channels of the quantum wire, thus resulting in a collective behaviour that in turn affects strongly the propagation velocity of the excitations. For a quantum wire containing conduction channels, Coulomb interaction leads to charge fractionalisation into charge modes with renormalised propagation velocity and spin modes (c.f. Supplementary Note 4). To distinguish between single-particle states and collective modes, we will use throughout the manuscript the term channel whenever referring to single-particle states and mode when referring to collective modes. As the spin modes do not carry any charge, their speed is not affected by the Coulomb interaction. For our experiment we can neglect them since voltage pulses do not excite spin modes in the quantum conductor. The charge modes, on the other hand, are affected by the Coulomb interaction in the following way: charge modes – the slow modes – are weakly affected and propagate with a speed close to while one mode – the fast mode – usually referred to as the plasmon mode is renormalised via all the other modes and propagates with a velocity much faster than .
Here, we have derived the theory matveev-glazman_1993 from first principles in order to obtain a quantitative - parameter free - comparison with the measurements. Our calculations proceed in three steps: first we solve the self-consistent electrostatics-quantum mechanics problem to obtain the effective potential seen by the electrons as shown in Fig. 1c. Second, we compute the effective propagating channels and their interaction matrix and third we compute the mode velocities as arising from bosonisation theory (c.f. Supplementary Note 4). The obtained theoretical data for the fast mode – the plasmon mode – (without any adjustable parameters) is displayed by the blue curve in Fig. 2b.
Channel selection
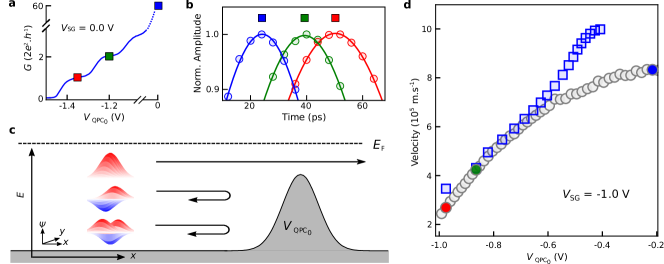
By gradually reducing the number of channels of the quantum wire to one, we enter the Tomonaga-Luttinger liquid regimegiamarchi_book . However, due to the strong confinement potential and its long length, the quantum wire is not very homogeneous and the pulse becomes distorted. It is therefore not possible to realise a clean one-channel Tomonaga-Luttinger liquidpierre_ncom_2013 in the present configuration. To circumvent this limitation we have placed another quantum point contact QPC0 at the entrance of the quantum wire in order to select specific channels as schematised in Fig. 3c. We set the confinement potential of the quantum wire to a situation where the wire width is relatively large (; ) and set the quantum point conductance to a value of .
An electron pulse is launched from the left ohmic contact into the quantum wire containing initially channels. Upon propagation, this charge pulse decomposes onto the eigenmodes (plasmon modes) due to Coulomb interaction. When this pulse passes through the QPC0, only one channel is transmitted, as shown in Fig. 3c. After the passage, the electron pulse continues its propagation along the quantum wire containing again the same number of available channels as before the passage through the selection QPC0. Assuming a non-adiabatic passage, the charge pulse should instantaneously fractionalise into a fast plasmon mode and slow modes. Very surprisingly, this is not the case. Time-resolved measurements of the charge pulse propagation through QPC1, QPC2 and QPC3 allow us to determine the average speed of the charge pulse after passing through the selection QPC0. We observe that the charge pulse is strongly slowed down after passing the channel selection QPC0, as shown in Fig. 3b and d. These measurements are repeated for different confinement potentials to corroborate our findings (see red data points in Fig. 2b).
Discussion
As discussed above, the propagation speed of the charge pulse is strongly enhanced by the Coulomb interaction. Applying our parameter free model we are able to determine the propagation velocity for any gate configuration. This is done for the fast charge mode in Fig. 2b (see blue continuous curve). The agreement with the experiments over the entire gate voltage region is quite remarkable. We attribute the observed discrepancy in the limit of large number of channels to interchannel forward scattering which is not taken into account in matveev-glazman_1993 .
Our theoretical model also allows us to calculate the speed of the charge pulse assuming that only one single mode is occupied after passing the channel selection QPC0 (solid red curve in Fig. 2b) and compare it to our experimental data. This mode corresponds to a single-channel Tomanaga-Luttinger plasmon (c.f. Supplementary Note 4) which is very different from the plasmon hosted by the full 28 channels. The agreement between theory and experiment is again remarkable. These observations strongly suggest that the charge pulse which is transmitted through the lowest channel of the selection QPC0 is adiabatically transferred onto the fast plasmon mode corresponding to a single-channel Tomonaga-Luttinger liquid and which we named the funneling scenario (c.f. Supplementary Note 4). We have repeated these experiments for the second quantised plateau (green data points) and find similar agreement. Hence our data indicate that it is possible to form a very clean single channel (two-channel) Tomonaga-Luttinger liquid even though the wire contains many more active channels. We observe that the electron pulse conserves its propagation speed for at least a distance of (position of QPC2). This is in stark contrast to experiments in the quantum Hall regime, where the wave packet fractionalises instantaneouslyfeve_ncom_2015 . In these experiments the electron wave packet is already fully fractionalised after a propagation distance of about feve_ncom_2015 with a time separation of between the fast and the slow mode. In our experiment, we observe fractionalisation only at a distance well above . At a distance of about (QPC3), we observe that the velocity is again approaching the one corresponding to the fast mode where all the channels of the quantum wire are populated. This opens the possibility to realise quantum interference experiments with single-electron pulses by only populating a single-channel plasmon mode, which has never been observed with DC measurements.
The presented time control of single-electron pulses at the picosecond level will also be important for the implementation of wave-guide architectures for flying qubits using single electronsbauerle_ropp_2018 . Integrating a leviton sourceglattli_nature_2013 into a wave-guide interferometer would allow to realise single-electron flying qubit architecturesyamamoto_nnano_2012 ; bautze_prb_2014 ; bauerle_ropp_2018 similar to those employed in linear quantum opticsobrien_science_2008 .
Our findings give also a new insight into the recently discovered levitonsglattli_nature_2013 . As the underlying physics is independent of the actual shape of the single-electron wave packet, levitons should be regarded as a special kind of plasmon with the particularity that it does only generate electronic excitations (no holes), rather than a single-electron excitation propagating at the surface of the Fermi sea with the Fermi velocitylevitov_jmp_1996 .
Furthermore, our studies pave the way for studying real-time dynamics of a quantum nano-electronic device gaury_nat-com_14 such as the measurement of the time spreading or the charge fractionalisation dynamicsdegiovanni_prb_2013 of the electron wave packet during propagation.
Methods
Sample fabrication
The sample is fabricated by depositing electrostatic gates on top of a GaAs/AlGaAs semiconductor heterostructure.
The two-dimensional electron gas, which is at a depth of , has density and mobility , measured at .
The long electrostatic gates are defined by Ti/Au, while a Ni/Ge/Au/Ni/Au alloy is used for the ohmic contacts.
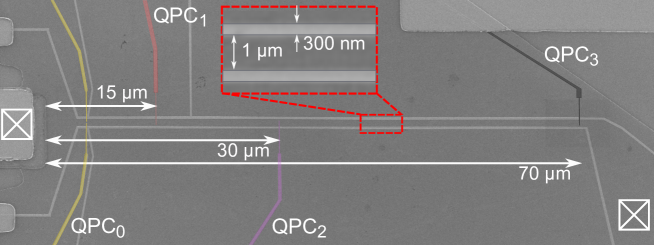
A scanning electron microscope image of our sample is shown in figure 4.
Time resolved measurements of voltage pulse
To generate a single-electron pulse, a voltage pulse with an amplitude of several tens of is applied to the left ohmic contact of our sample through a high bandwidth coaxial line and a attenuation.
The voltage pulses are provided by an arbitrary function generator (Textronics AWG7122C) and have a repetition frequency.
The generated DC current is measured across a resistor placed on the sample chip carrier at a temperature of . The pulse train is modulated at a frequency of to perform lock-in measurements.
A second voltage pulse is applied to one of the QPCs in order to operate it as a fast switch.
By changing the time delay between generating the electron pulse and opening/closing the QPC switch we can reconstruct in a time-resolved manner the time trace of the electron pulse, following the protocol developed by Kamata et al. kamata_prb_2010 .
In order to obtain the shortest possible switching times we perform the following operations, shown in Fig. 5a.
First, the QPC is set to the pinch-off regime (OFF - position) by applying an appropriate negative DC voltage ().
Subsequently, we apply a short voltage pulse with a fixed amplitude () to the QPC, which allows us to open the QPC switch only for a very short time , typically below johnson_apl_2017 . To achieve these fast switching times we keep the amplitude constant and we vary . As shown in Fig. 5a when is very negative the QPC switch remains closed for all time delays and therefore the recorded current is zero. By increasing to the appropriate value we can open the QPC switch for a brief period of time , thus allowing us to reconstruct the electron pulse.
As the switching profile of the QPC depends on the combination of the applied DC and AC voltages as well as the very sharp conductance response we can achieve time resolutions that are shorter than those provided by our electronics.
By optimising and amplitudes we are able to measure single-electron pulses down to a FWHM of , as shown in Fig. 5b.
Determination of the propagation velocity
To determine the velocity of the electron wave packet we perfomed time-of-flight measurements for different confinement potentials (see Fig. 1 and Fig. 2). For every confinement potential we carry out three independent measurements, one for each QPC (except QPC which is not connected to a bias tee).
During these measurements we excite the electron wave packet and measure the time it takes to propagate to the three detection QPCs. By using the time of flight and the exact distance between the left ohmic contact (excitation location) and these three QPCs (Fig. 4) we can calculate the velocity (cf. Supplementary Note 4).
Data availability:
The data that support the findings of this study are available from the corresponding authors on reasonable request.
References
- (1) Giamarchi, T. Quantum Physics In One Dimension (Oxford university press, 2004).
- (2) Deshpande, V. V., Bockrath, M., Glazman, L. I. & Yacoby, A. Electron liquids and solids in one dimension. Nature 464, 209–216 (2010).
- (3) Auslaender, O. M. et al. Spin-charge separation and localization in one dimension. Science 308, 88–92 (2005).
- (4) Steinberg, H. et al. Charge fractionalization in quantum wires. Nature Physics 4, 116–119 (2008).
- (5) Pecker, S. et al. Observation and spectroscopy of a two-electron wigner molecule in an ultraclean carbon nanotube. Nature Physics 9, 576–581 (2013).
- (6) Jompol, Y. et al. Probing spin-charge separation in a tomonaga-luttinger liquid. Science 325, 597–601 (2009).
- (7) Safi, I. & Schulz, H. J. Transport in an interacting wire connected to measuring leads. In Kramer, B. (ed.) Quantum Transport in Semiconductor Submicron Structures, chap. 3, 159 (Kluwer Academic Press, Dordrecht, 1995).
- (8) Safi, I. & Schulz, H. J. Transport in an inhomogeneous interacting one-dimensional system. Physical Review B 52, R17040–R17043 (1995).
- (9) Pham, K.-V., Gabay, M. & Lederer, P. Fractional excitations in the luttinger liquid. Physical Review B 61, 16397–16422 (2000).
- (10) Ferraro, D. et al. Wigner function approach to single electron coherence in quantum Hall edge channels. Physical Review B 88, 205303 (2013).
- (11) Levkivskyi, I. P. & Sukhorukov, E. V. Dephasing in the electronic mach-zehnder interferometer at filling factor . Physical Review B 78, 045322 (2008).
- (12) Bocquillon, E. et al. Separation of neutral and charge modes in one-dimensional chiral edge channels. Nature Communications 4, 1839 (2013).
- (13) Inoue, H. et al. Charge fractionalization in the integer quantum hall effect. Physical Review Letters 112, 166801 (2014).
- (14) Kamata, H., Kumada, N., Hashisaka, M., Muraki, K. & Fujisawa, T. Fractionalized wave packets from an artificial tomonaga-luttinger liquid. Nature Nanotechnology 9, 177–181 (2014).
- (15) Freulon, V. et al. Hong-Ou-Mandel experiment for temporal investigation of single-electron fractionalization. Nature Communications 6, 6854 (2015).
- (16) Hashisaka, M., Hiyama, N., Akiho, T., Muraki, K. & Fujisawa, T. Waveform measurement of charge- and spin-density wavepackets in a chiral tomonaga-luttinger liquid. Nature Physics 13, 559–562 (2017).
- (17) Ashoori, R. C., Stormer, H. L., Pfeiffer, L. N., Baldwin, K. W. & West, K. Edge magnetoplasmons in the time domain. Physical Review B 45, 3894–3897 (1992).
- (18) Ernst, G., Haug, R. J., Kuhl, J., von Klitzing, K. & Eberl, K. Acoustic edge modes of the degenerate two-dimensional electron gas studied by time-resolved magnetotransport measurements. Physical Review Letters 77, 4245–4248 (1996).
- (19) Kamata, H., Ota, T., Muraki, K. & Fujisawa, T. Voltage-controlled group velocity of edge magnetoplasmon in the quantum hall regime. Physical Review B 81, 085329 (2010).
- (20) Kataoka, M. et al. Time-of-flight measurements of single-electron wave packets in quantum hall edge states. Physical Review Letters 116, 126803 (2016).
- (21) Kumada, N. et al. Plasmon transport in graphene investigated by time-resolved electrical measurements. Nature Communications 4, 1363 (2013).
- (22) van Houten, H. et al. Coherent electron focussing in a two-dimensional electron gas. Europhysics Letters 5, 721 (1988).
- (23) Chaplik, A. V. Absorption and emission of electromagnetic waves by two-dimensional plasmons. Surface Science Reports 5, 289–335 (1985).
- (24) Matveev, K. A. & Glazman, L. I. Coulomb blockade of tunneling into a quasi-one-dimensional wire. Physical Review Letters 70, 990–993 (1993).
- (25) Jezouin, S. et al. Tomonaga–luttinger physics in electronic quantum circuits. Nature Communications 4, 1802 (2013).
- (26) Bäuerle, C. et al. Coherent control of single electrons: a review of current progress. Rep. Prog. Phys. 81, 056503 (2018).
- (27) Dubois, J. et al. Minimal-excitation states for electron quantum optics using levitons. Nature 502, 659–663 (2013).
- (28) Yamamoto, M. et al. Electrical control of a solid-state flying qubit. Nature Nanotechnology 7, 247–251 (2012).
- (29) Bautze, T. et al. Theoretical, numerical, and experimental study of a flying qubit electronic interferometer. Physical Review B 89, 125432 (2014).
- (30) Politi, A., Cryan, M. J., Rarity, J. G., Yu, S. & O’Brien, J. L. Silica-on-silicon waveguide quantum circuits. Science 320, 646–649 (2008).
- (31) Levitov, L. S., Lee, H. & Lesovik, G. B. Electron counting statistics and coherent states of electric current. Journal of Mathematical Physics 37, 4845–4866 (1996).
- (32) Gaury, B. & Waintal, X. Dynamical control of interference using voltage pulses in the quantum regime. Nature Communications 5, 3844 (2014).
- (33) Johnson, N. et al. Ultrafast voltage sampling using single-electron wavepackets. Applied Physics Letters 110, 102105 (2017).
Acknowledgments
We would like to dedicate this article to the late Frank Hekking who has been very implicated in the initial stage of the project. We would like to acknowledge fruitful discussions with D. Carpentier, P. Degiovanni, M. Filippone and T. Martin. S. T. acknowledges financial support from the European Union’s Horizon 2020 research and innovation program under the Marie Skłodowska-Curie grant agreement No. 654603. A. L. and A. D. W. acknowledge gratefully support of DFG-TRR160, BMBF - Q.com-H 16KIS0109, and the DFH/UFA CDFA-05-06. C. B, T.M. and X.W. acknowledge financial support from the French National Agency (ANR) in the frame of its program ANR Fully Quantum Project No. ANR-16-CE30-0015-02 and QTERA No. ANR-15-CE24-0007-02. C.B. and T.M. also acknowledge the SingleEIX Project No. ANR-15-CE24-0035. X.W. and P.A. are funded by the U.S. Office of Naval Research.
Author contribution
G.R and E.A. performed the experiment and analysed the data with input from S.T., G.G, M.U. and T.M.. G.R made the sample with help from S.T. and T.M.. M.S. contributed to the experimental setup and timing methods. T.K., P.A. and X.W. designed the theoretical framework. P.A. performed the numerical simulations. All authors analyzed the numerical data. A.L. and A.D.W. provided the high mobility heterostructure. C.B, X.W. and G.G. wrote the paper with inputs from all authors. C.B. supervised the experimental work.
Supplementary Information accompanies this paper.
Competing interests: The authors declare no competing financial or non-financial interests.