All-Microwave Control and Dispersive Readout of Gate-Defined Quantum Dot Qubits
in Circuit Quantum Electrodynamics
Abstract
Developing fast and accurate control and readout techniques is an important challenge in quantum information processing with semiconductor qubits. Here, we study the dynamics and the coherence properties of a GaAs/AlGaAs double quantum dot (DQD) charge qubit strongly coupled to a high-impedance SQUID array resonator. We drive qubit transitions with synthesized microwave pulses and perform qubit readout through the state dependent frequency shift imparted by the qubit on the dispersively coupled resonator. We perform Rabi oscillation, Ramsey fringe, energy relaxation and Hahn-echo measurements and find significantly reduced decoherence rates down to corresponding to coherence times of up to for charge states in gate defined quantum dot qubits.
Fundamental and applied research on semiconductor quantum dots Loss and DiVincenzo (1998); Kouwenhoven et al. (2001); van der Wiel et al. (2002) attracts much attention largely due to the potential of using the electron charge Hayashi et al. (2003); Petta et al. (2004) and spin Petta et al. (2005); Hanson et al. (2007) degrees of freedom as information carriers in solid state qubits. In practice, the coherence of both spin and charge qubits are limited by charge noise Hayashi et al. (2003); Petersson et al. (2010); Dial et al. (2013); Paladino et al. (2014); Reed et al. (2016); Martins et al. (2016). As a consequence, both improving coherence properties and reducing the time scale for control and readout of qubits are important topics of current research as they are crucial for realizing quantum information processing in such systems.
In this work, we address both challenges by making use of strong coherent coupling between charges in double quantum dots and photons stored in an on-chip resonator using the circuit QED architecture realized first with superconducting qubits Wallraff et al. (2004) and more recently in Silicon Mi et al. (2017) and GaAs Stockklauser et al. (2017) quantum nanostructures. We use non-resonant (dispersive) interactions between a DQD charge qubit and a high impedance resonator for time-resolved readout of the qubit coherently manipulated using microwave pulses. We employ this technique to investigate coherence properties of qubits.
In a more conventional approach, in which DQD charge qubits are manipulated using non-adiabatic pulses and read out by capacitively coupled charge detectors, coherence times of up to in GaAs Petersson et al. (2010) and in Si Shi et al. (2013) have been observed. Spin Echo experiments performed with non-adiabatic pulses Dovzhenko et al. (2011) found echo times of in GaAs Wang et al. (2017) and Si Shi et al. (2013). Recently, first microwave driven coherent operations showed improved qubit control and a in three electron DQDs in SiGe Kim et al. (2015), which is operated as hybrid spin and charge qubit. In a more recent work, the free induction decay time of this system has been extended to through operation in the spin-like operating region Thorgrimsson et al. (2017).
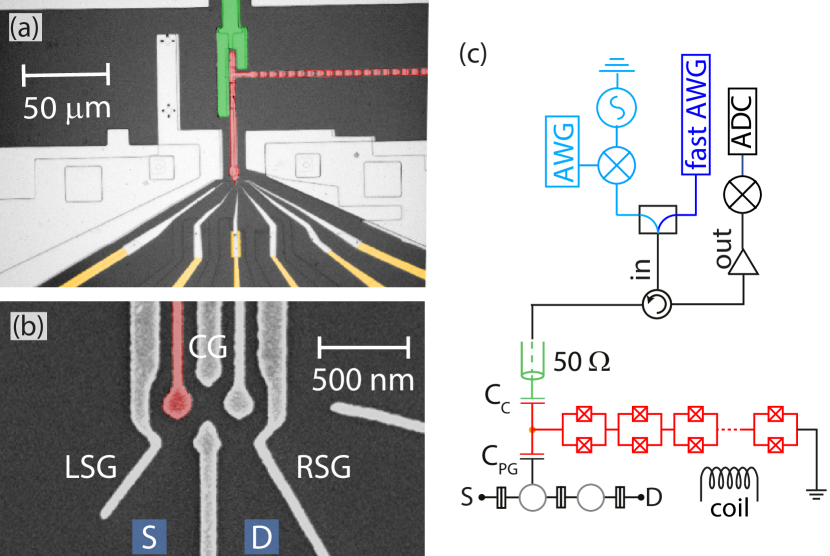
Here, we perform experiments with a superconducting high-impedance resonator coupled to a DQD charge qubit Stockklauser et al. (2017). The high-impedance resonator, which boosts the coupling strength and is frequency tunable, is composed of an array of SQUIDs [Fig. 1(a)] grounded at one end and terminated at the other end by a small island that is capacitively coupled to a coplanar waveguide used as a drive line. A gate line [red in Fig. 1(b)] extends from the island towards the DQD forming one of its plunger gates. The DQD is defined using voltage-biased Aluminum (Al) depletion gates van der Wiel et al. (2002) connected to gold (Au) leads deposited on a small mesa etched into a GaAs/AlGaAs heterostructure forming a two dimensional electron gas (2DEG) 90 nm below the surface [Figs. 1(a) and (b)]. We estimate an electron number of around 10 in each QD from the respective charging energies () van der Wiel et al. (2002). The device is operated in a dilution refrigerator at a temperature of .
We control the DQD qubit transition frequency by tuning the inter-dot tunnel rate to and by adjusting the detuning by applying bias voltages to the respective gates Frey et al. (2012). We tune the resonator frequency to using externally applied magnetic flux Stockklauser et al. (2017). Sweeping the DQD detuning , the reflectance spectrum [Fig. 2(a)] shows characteristic dispersive shifts in the resonator spectrum for and , and avoided crossings that are the signature of strong coupling at resonance Stockklauser et al. (2017); Mi et al. (2017).
We measure a resonator linewidth of with external coupling exceeding the internal losses realizing the overcoupled regime. From the vacuum Rabi splitting we extract a coherent coupling strength of between the resonator and the DQD at resonance for Stockklauser et al. (2017).
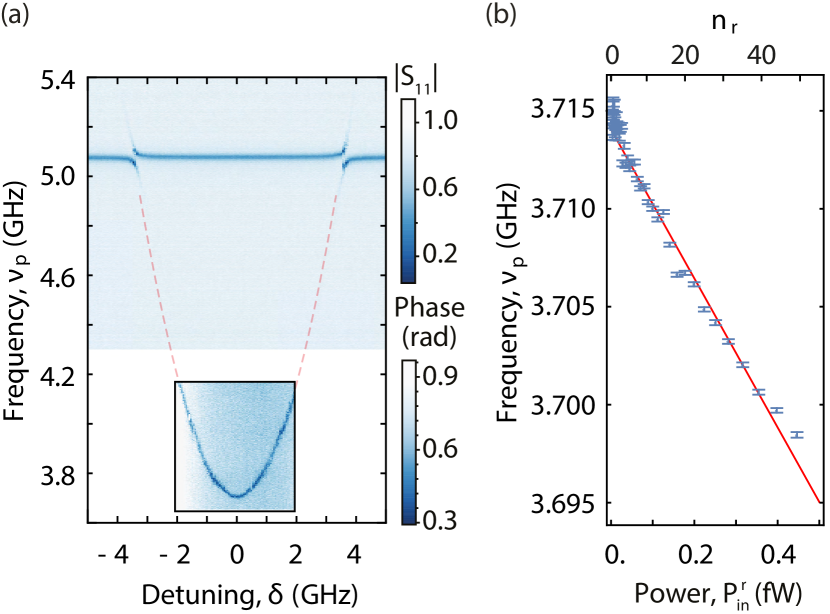
As mentioned above, when the DQD transition frequency is detuned by , the resonator frequency is dispersively shifted conditioned on the qubit state Blais et al. (2004). We infer the qubit transition frequency from the detected phase shift of the resonator reflectance, as recently demonstrated for semiconductor DQD qubits Stockklauser et al. (2017); Mi et al. (2017) and routinely used for superconducting qubits Schuster et al. (2005). We perform continuous wave (CW) two-tone spectroscopy of the DQD charge qubit Schuster et al. (2005); Wallraff et al. (2004) by probing the amplitude and phase () of the resonator reflectance at fixed measurement frequency while applying an additional spectroscopy tone at frequency through the resonator to the DQD qubit Stockklauser et al. (2017). The spectroscopically extracted transition frequency displayed in the lower part of Fig. 2(a) is in good agreement with the calculated qubit frequency (red dashed line) for .
The dispersive coupling harnessed for qubit readout also leads to a qubit frequency shift , known as the ac-Stark shift Blais et al. (2004), dependent on the average resonator photon number Schuster et al. (2005). As expected, the qubit frequency , measured in two-tone spectroscopy with low spectroscopy power (), depends linearly on the resonator drive power [Fig. 2(b)]. Using the independently determined coupling constant and detuning [Fig. 2(a)], we calibrate the average photon number in the resonator vs. input power from the observed linear shift of the qubit frequency [Fig. 2(b)] Schuster et al. (2005).
From the dependence of the qubit linewidth on the spectroscopy power () Stockklauser et al. (2017) at and , we extract the qubit decoherence rate corresponding to . This rate is almost 10 times lower than previously reported values in similar GaAs based devices Stockklauser et al. (2017) and is comparable to decoherence rates found for DQD charge qubits in undoped SiGe heterostructures Mi et al. (2017).
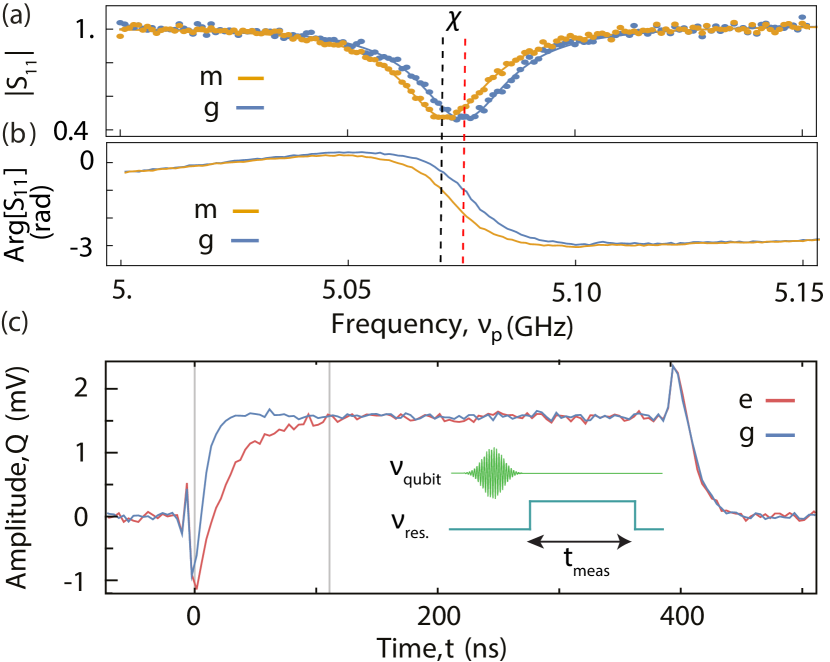
To prepare for the time-resolved readout of the DQD qubit, we determine the state-dependent cavity frequency shift . First, we extract the resonator frequency from a measurement of the reflection coefficient when leaving the qubit in the ground state [blue trace in Figs. 3(a,b)]. Then, we apply a continuous coherent tone of duration at frequency saturating the qubit transition and creating a fully mixed qubit state (). Comparing the frequency of the resonator with the qubit in the fully mixed state [orange curve in Figs. 3(a,b)] to the one in the ground state , we extract the resonator frequency shift Blais et al. (2004).
By applying resonant microwave pulses of controlled amplitude and duration, we coherently control the quantum state of the DQD charge qubit. We subsequently infer the qubit state by applying a microwave pulse to the resonator and measure its amplitude and phase response using the pulse scheme shown in the inset of Fig. 3(c). This approach was previously demonstrated for superconducting qubits Wallraff et al. (2005); Bianchetti et al. (2009).
We record the time-dependent resonator response to the applied measurement microwave pulse with the qubit left in the ground state (blue trace) and when applying a microwave pulse to the qubit preparing the excited state (red trace) [Fig. 3(c)]. We adjust the phase of the measurement pulse to maximize (minimize) the detected signal in the Q (I) quadrature. All measurements are performed at to maximize qubit coherence.
When applying the readout pulse with the qubit in , we observe an exponential rise of the resonator response reaching a steady state on a time scale of . In , the resonator frequency is shifted by resulting in a different Q quadrature response (red trace). The integrated area between the two curves in Fig. 3(c) is proportional to the qubit excited state population as discussed in detail, for example, in Refs. Bianchetti et al., 2009; Wallraff et al., 2005.
We apply microwave drive pulses to the DQD qubit at its transition frequency through the resonator. The qubit is detuned by from the resonator. We synthesize the Gaussian qubit control pulses directly (without upconversion) by using an arbitrary waveform generator (AWG) with 25 GS/s sampling rate allowing for good pulse definition down to sub-ns pulse length.
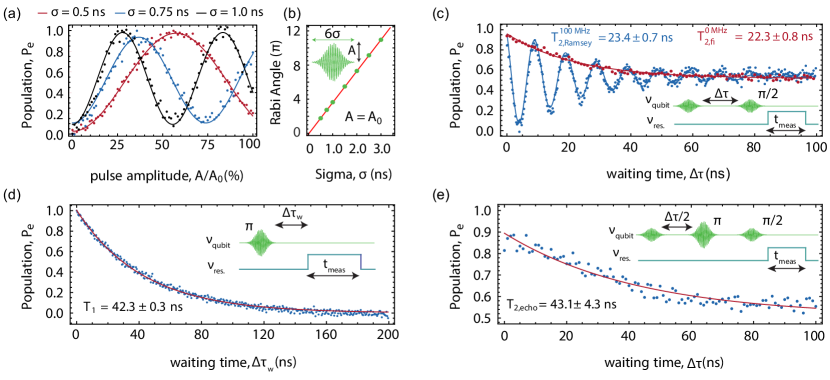
We observe Rabi oscillations in the DQD charge qubit excited state population by applying pulses [see inset of Fig. 4(b)] with standard deviation and vs. normalized microwave pulse amplitudes followed by pulsed dispersive readout as described above [Fig. 4(a)]. The fastest -Rabi pulse, realized in our experiment by using the maximum available pulse amplitude at the AWG output, has a standard deviation of . This corresponds to a sizable Rabi frequency of up to averaged over the pulse duration. We observe the expected linear dependence of the Rabi angle vs. pulse length obtained for a fixed maximum pulse amplitude [Fig. 4(b)].
We determine the coherence time of the DQD charge qubit, configured as in Fig. 4(a), from a Ramsey fringe experiment using two pulses separated by a free evolution time followed by a readout pulse [inset, Fig. 4(c)]. Driving the qubit on resonance (red curve) or detuned (blue curve), we obtain a free induction decay time of or a Ramsey decay time of when extracting the exponential decay coefficient from the data [Fig. 4(c)].
We determine the energy relaxation time of the DQD charge qubit in the same configuration by first initializing the qubit in and varying the time before reading out the qubit state [Fig. 4(d)]. In this specific DQD configuration , indicating that coherence is limited by pure dephasing. To investigate the origin of the low frequency noise limiting coherence, we also perform a Hahn echo experiment by interleaving the Ramsey sequence with an extra -pulse in the middle [inset, Fig. 4(e)]. The echo decay time [Fig. 4(e)] is a factor of 2 longer than the but still lower than , indicating that fluctuations faster than contribute to dephasing.
Dispersive read-out combined with all-microwave control of qubits is an essential feature of quantum information processing with superconducting circuits. This work demonstrates that these assets can also come to fruition in circuit QED with semiconductor qubits. We are convinced that the presented methods will contribute significantly to the continued improvement of tools and techniques for quantum information processing with charge and spin qubits in semiconductor nano-structures. In particular, the methods presented here do allow for a detailed study of coherence properties of charge qubits, the results of which we will present elsewhere.
We acknowledge useful discussions with Andreas Landig, Theodore Walter, Philipp Kurpiers, Anton Potočnik, Christian K. Andersen and Johannes Heinsoo. We thank Alexandre Blais for valuable feedback on the manuscript. This work was supported by ETH Zurich and in part by the Swiss National Science Foundation through the National Center of Competence in Research (NCCR) Quantum Science and Technology.
References
- Loss and DiVincenzo (1998) D. Loss and D. P. DiVincenzo, Phys. Rev. A 57, 120 (1998).
- Kouwenhoven et al. (2001) L. P. Kouwenhoven, D. Austing, and S. Tarucha, Reports on Progress in Physics 64, 701 (2001).
- van der Wiel et al. (2002) W. G. van der Wiel, S. De Franceschi, J. M. Elzerman, T. Fujisawa, S. Tarucha, and L. P. Kouwenhoven, Rev. Mod. Phys. 75, 1 (2002).
- Hayashi et al. (2003) T. Hayashi, T. Fujisawa, H. D. Cheong, Y. H. Jeong, and Y. Hirayama, Phys. Rev. Lett. 91, 226804 (2003).
- Petta et al. (2004) J. R. Petta, A. C. Johnson, C. M. Marcus, M. P. Hanson, and A. C. Gossard, Phys. Rev. Lett. 93, 186802 (2004).
- Petta et al. (2005) J. R. Petta, A. C. Johnson, J. M. Taylor, E. A. Laird, A. Yacoby, M. D. Lukin, C. M. Marcus, M. P. Hanson, and A. C. Gossard, Science 309, 2180 (2005).
- Hanson et al. (2007) R. Hanson, L. P. Kouwenhoven, J. R. Petta, S. Tarucha, and L. M. K. Vandersypen, Rev. Mod. Phys. 79, 1217 (2007).
- Petersson et al. (2010) K. D. Petersson, J. R. Petta, H. Lu, and A. C. Gossard, Phys. Rev. Lett. 105, 246804 (2010).
- Dial et al. (2013) O. Dial, M. D. Shulman, S. P. Harvey, H. Bluhm, V. Umansky, and A. Yacoby, Physical review letters 110, 146804 (2013).
- Paladino et al. (2014) E. Paladino, Y. Galperin, G. Falci, and B. Altshuler, Rev. Mod. Phys. 86, 361 (2014).
- Reed et al. (2016) M. Reed, B. Maune, R. Andrews, M. Borselli, K. Eng, M. Jura, A. Kiselev, T. Ladd, S. Merkel, I. Milosavljevic, et al., Physical review letters 116, 110402 (2016).
- Martins et al. (2016) F. Martins, F. K. Malinowski, P. D. Nissen, E. Barnes, S. Fallahi, G. C. Gardner, M. J. Manfra, C. M. Marcus, and F. Kuemmeth, Physical review letters 116, 116801 (2016).
- Wallraff et al. (2004) A. Wallraff, D. I. Schuster, A. Blais, L. Frunzio, R.-S. Huang, J. Majer, S. Kumar, S. M. Girvin, and R. J. Schoelkopf, Nature 431, 162 (2004).
- Mi et al. (2017) X. Mi, J. V. Cady, D. M. Zajac, P. W. Deelman, and J. R. Petta, Science 355, 156 (2017).
- Stockklauser et al. (2017) A. Stockklauser, P. Scarlino, J. V. Koski, S. Gasparinetti, C. K. Andersen, C. Reichl, W. Wegscheider, T. Ihn, K. Ensslin, and A. Wallraff, Phys. Rev. X 7, 011030 (2017).
- Shi et al. (2013) Z. Shi, C. Simmons, D. R. Ward, J. Prance, R. Mohr, T. Koh, J. K. Gamble, X. Wu, D. Savage, M. Lagally, et al., Physical Review B 88, 075416 (2013).
- Dovzhenko et al. (2011) Y. Dovzhenko, J. Stehlik, K. D. Petersson, J. R. Petta, H. Lu, and A. C. Gossard, Phys. Rev. B 84, 161302 (2011).
- Wang et al. (2017) B. Wang, B. Chen, G. Cao, H. Li, M. Xiao, and G. Guo, EPL (Europhysics Letters) 117, 57006 (2017).
- Kim et al. (2015) D. Kim, W. D. R., S. C. B., J. K. Gamble, R. Blume-Kohout, E. Nielsen, S. D. E., L. M. G., M. Friesen, C. S. N., and E. M. A., Nat. Nano. 10, 243 (2015).
- Thorgrimsson et al. (2017) B. Thorgrimsson, D. Kim, Y. C. Yang, L. W. Smith, C. B. Simmons, D. R. Ward, R. H. Foote, J. Corrigan, D. E. Savage, and M. Lagally, npj Quantum Information 3, 1 (2017).
- Frey et al. (2012) T. Frey, P. J. Leek, M. Beck, A. Blais, T. Ihn, K. Ensslin, and A. Wallraff, Phys. Rev. Lett. 108, 046807 (2012).
- Blais et al. (2004) A. Blais, R.-S. Huang, A. Wallraff, S. M. Girvin, and R. J. Schoelkopf, Phys. Rev. A 69, 062320 (2004).
- Schuster et al. (2005) D. I. Schuster, A. Wallraff, A. Blais, L. Frunzio, R.-S. Huang, J. Majer, S. M. Girvin, and R. J. Schoelkopf, Phys. Rev. Lett. 94, 123602 (2005).
- Wallraff et al. (2005) A. Wallraff, D. I. Schuster, A. Blais, L. Frunzio, J. Majer, S. M. Girvin, and R. J. Schoelkopf, Phys. Rev. Lett. 95, 060501 (2005).
- Bianchetti et al. (2009) R. Bianchetti, S. Filipp, M. Baur, J. M. Fink, M. Göppl, P. J. Leek, L. Steffen, A. Blais, and A. Wallraff, Phys. Rev. A 80, 043840 (2009).
Supplemental Material
Appendix A Setup Details and Sample Characterization
In this section, we describe in more detail the measurement setup and the device parameters.
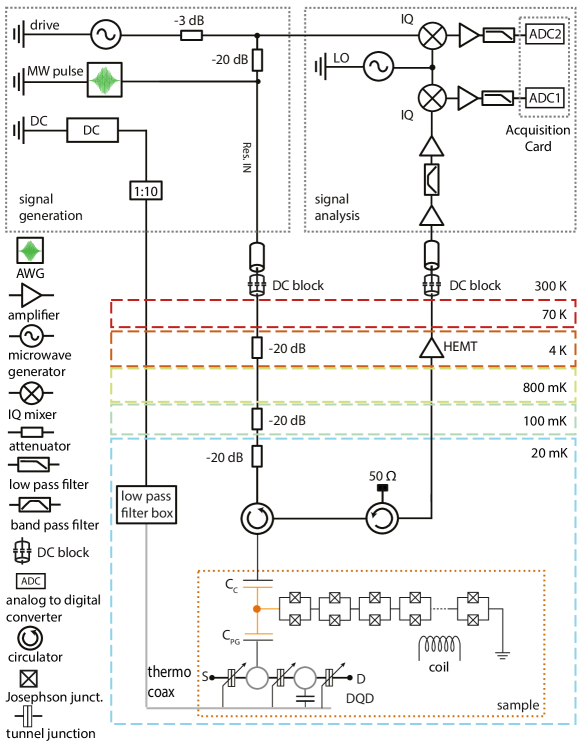
The measurement setup consists of DC electronics for biasing and reading out the quantum dot and RF electronics to probe the resonator [Fig. S1]. The DQD gates are biased using a dc voltage sources (Yokogawa7651). The DC lines contain voltage dividers for noise reduction at room temperature and are low pass filtered at base temperature. This filter is connected to the sample holder by thermocoax lines Zorin (1995), which provide additional filtering in the microwave range. A symmetric current-to-voltage (IV) converter is used to apply a voltage bias to the 2DEG and measure the resulting current.
The room temperature electronics consists of signal generation and signal analysis components as sketched in Fig. S1. A microwave generator provides the input signal of the resonator (drive).
For the time-resolved measurements, Gaussian pulses with derivative removal via adiabatic gate (DRAG) technique Chow et al. (2010) are generated by an arbitrary wave form generator with 25 GS/s and 10 bit resolution (Tektronix AWG70002) directly at the qubit frequency . The DRAG technique is used to minimize the frequency component at the SQUID array resonator frequency .
The resonator drive tone for read-out is gated.
The output field is routed through two circulators before reaching a high electron mobility transistor (HEMT) amplifier located on the K plate of the cryostat. This amplifier has a gain of dB and a noise temperature of 6 K.
The signal is further amplified and filtered at room temperature and converted to an intermediate frequency (IF) of 250 MHz. In the down-conversion process the signal is mixed with a local oscillator (LO), which is 250 MHz detuned from the signal to be detected [signal analysis box in Fig. S1]. The same mixing process creates a phase reference signal which is split off the input signal of the resonator (drive) and does not pass through the sample.
The down-converted signals are subsequently amplified, filtered and digitized using an analog-to-digital converter (ADC) outputting its data to a field-programmable gate array (FPGA) signal processing board or to an acquisition card. Digital down-conversion to zero frequency and digital filtering yield the quadrature amplitudes I and Q or equivalently the amplitude A and phase of the complex signal amplitude Wallraff et al. (2004).
The electrostatics of the DQD is tuned predominantly by making use of the left and right side gates (LSG, RSG). The plunger gates, not dc-biased, are connected to the SQUID array resonator (LPG) and to the groud (RPG). Additionally, the slightly modified DQD gate layout [see Fig. 1(b)] of this device (compared to the gate layout in Stockklauser et al. (2017)) allows to form the QDs closer to each other and increases the lever arm of the plunger gates, directly placed above the desired dot positions. Furthermore, the SQUID array resonator is better shielded from the metallic gates by additional Al ground plane. The coupling capacitance of the SQUID array to the drive line has been increased (with respect to the previous design in Stockklauser et al. (2017)) by extending the metal structure of the drive line around the array island [see Fig. 1(a)].
The extracted device parameters differ significantly from the ones of the previous device generation reported in Stockklauser et al. (2017). While the external linewidth of the resonator is increased due to the larger coupling capacitance of the SQUID array island to the drive line ( and ) Wong and Vavilov (2017), the internal linewidth is reduced.
Appendix B Charge Qubit Spectroscopy
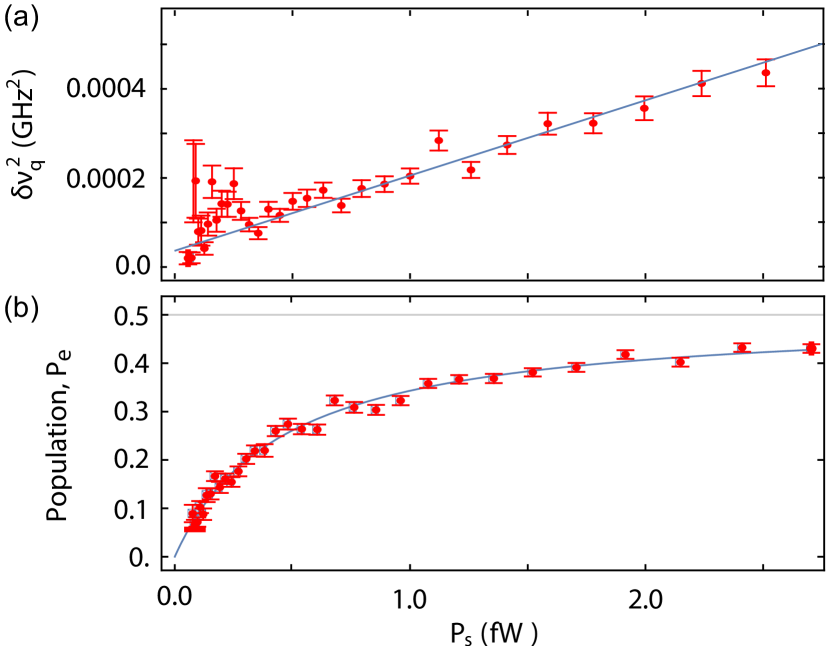
We further analyze the spectroscopy power () dependence of the qubit linewidth , reported in Fig. S2(a), from which we extract the qubit decoherence rate corresponding to , evaluated for and (for the same DQD charge configuration explored in the main text). This value is almost 10 times better than what we previously reported on a similar device in Stockklauser et al. (2017) and comparable to what observed in Mi et al. (2017) for a DQD charge qubit in undoped SiGe heterostructures. Increasing the drive strength we observe the qubit transition to approach saturation [Fig. S2(b)] Schuster et al. (2005); Stockklauser et al. (2017).
References
- Zorin (1995) A. B. Zorin, Rev. Sci. Instrum. 66, 4296 (1995).
- Chow et al. (2010) J. M. Chow, L. DiCarlo, J. M. Gambetta, F. Motzoi, L. Frunzio, S. M. Girvin, and R. J. Schoelkopf, Phys. Rev. A 82, 040305 (2010).
- Wallraff et al. (2004) A. Wallraff, D. I. Schuster, A. Blais, L. Frunzio, R.-S. Huang, J. Majer, S. Kumar, S. M. Girvin, and R. J. Schoelkopf, Nature 431, 162 (2004).
- Stockklauser et al. (2017) A. Stockklauser, P. Scarlino, J. V. Koski, S. Gasparinetti, C. K. Andersen, C. Reichl, W. Wegscheider, T. Ihn, K. Ensslin, and A. Wallraff, Phys. Rev. X 7, 011030 (2017).
- Wong and Vavilov (2017) C. H. Wong and M. G. Vavilov, Phys. Rev. A 95, 012325 (2017).
- Mi et al. (2017) X. Mi, J. V. Cady, D. M. Zajac, P. W. Deelman, and J. R. Petta, Science 355, 156 (2017).
- Schuster et al. (2005) D. I. Schuster, A. Wallraff, A. Blais, L. Frunzio, R.-S. Huang, J. Majer, S. M. Girvin, and R. J. Schoelkopf, Phys. Rev. Lett. 94, 123602 (2005).