Star-Forming Environments Throughout the M101 Group
Abstract
We present a multiwavelength study of star formation within the nearby M101 Group, including new deep H imaging of M101 and its two companions. We perform a statistical analysis of the H to FUV flux ratios in H II regions located in three different environments: M101’s inner disk, M101’s outer disk, and M101’s lower mass companion galaxy NGC 5474. We find that, once bulk radial trends in extinction are taken into account, both the median and scatter in FFFUV in H II regions are invariant across all of these environments. Also, using Starburst99 models, we are able to qualitatively reproduce the distributions of FFFUV throughout these different environments using a standard Kroupa IMF, hence we find no need to invoke truncations in the upper mass end of the IMF to explain the young star-forming regions in the M101 Group even at extremely low surface density. This implies that star formation in low density environments differs from star formation in high density environments only by intensity and not by cloud-to-cloud physics.
Subject headings:
galaxies:individual(M101), galaxies:individual(NGC5474), galaxies:evolution, galaxies:spiral, galaxies:star formation1. Introduction
The extended, low surface brightness (LSB) outer disks of galaxies are a poor fit to idealized models of galaxy formation theory. Absent extenuating circumstances, CDM predicts that galaxies form “inside-out”, hence are youngest at their largest radii. Yet real galaxies’ often smooth, red outer isophotes imply the opposite (e.g. Bakos et al., 2008; Zheng et al., 2015; Laine et al., 2016). In fact, old red giant branch (RGB) stars typically have longer scale lengths than main sequence stars (e.g. Davidge, 2003; Vlajić et al., 2009, 2011), and any young stars present in outer disks tend to be sparsely distributed (e.g. Barker et al., 2007; Davidge, 2010). Outer disks are not simply an LSB continuation of inner disks.
Star formation is also inefficient in outer disks, with gas consumption timescales exceeding a Hubble time (Thilker et al., 2007; Bigiel et al., 2010). This is similar to LSB galaxies (e.g. McGaugh & Bothun, 1994; Burkholder et al., 2001; Boissier et al., 2008), suggesting that star formation physics changes in low density environments. Jeans stability criteria suggest that low gas column density results in depressed or truncated star formation (with an apparent threshold below around – cm-2, e.g. Hunter & Gallagher, 1986; Skillman, 1987; van der Hulst et al., 1987), but star formation may also be suppressed on large scales via dynamically induced stability (e.g. Zasov & Simakov, 1988; Kennicutt, 1989). The latter suggests disks should have a star formation truncation radius (Martin & Kennicutt, 2001), with star formation taking place beyond this only in local high density pockets (e.g. Courtes & Cruvellier, 1961; Ferguson et al., 1998; Gil de Paz et al., 2005; Thilker et al., 2005).
Despite its scarcity and inefficiency, this in situ outer disk star formation could fully account for all of the outer disk stellar mass in some galaxies (depending on the star formation history, SFH; Zaritsky & Christlein, 2007). However, outer disk star formation is present in only 4%–14% of star-forming galaxies out to (Lemonias et al., 2011), hence it may not be sufficient to explain outer disk formation in general. It also may not be necessary: many authors have proposed that much outer disk stellar mass can be accounted for through radial migration (Sellwood & Binney, 2002; Debattista et al., 2006), which can migrate early generations of inner disk stars outward via resonances with transient spiral arms, bars, or couplings thereof (e.g. Roškar et al., 2008; Sánchez-Blázquez et al., 2009; Schönrich & Binney, 2009; Minchev et al., 2011; Roškar et al., 2012).
Because our empirical star formation laws (e.g. the conversion of H flux to star formation rate, SFR; Kennicutt et al., 1994) were derived in high density environments, accounting for the fraction of stellar mass that formed in-situ in outer disks assumes that these laws remain unaltered in low density environments. If this is not true, conclusions drawn from typical star formation indicators about gas consumption timescales, star formation efficiency, and so on will be erroneous in outer disks and other similar environments. Consider, for example, two star-forming regions of equal mass and age, and so equal in predicted SFR. H emission is sensitive to the initial mass function (IMF, e.g. Sullivan et al., 2004); hence, if one region lacks massive O stars, it will emit fewer ionizing photons, resulting in lower H flux. Measuring its SFR using a standard H–SFR conversion factor will thus underestimate its true SFR.
It remains an open question if star formation physics changes in low density environments. Whether or not such a change occurs depends on whether or not changes in the underlying structure of the disk—surface mass density, gas velocity dispersion, gas phase, turbulence, etc.—affects the formation and subsequent evolution of molecular clouds and star clusters. For example, (Meurer et al., 2009) argue that the formation of dense bound clusters is inhibited in regions of low mass surface density because the midplane pressure in the disk influences internal cloud pressures (see e.g. Dopita & Sutherland, 2003). If massive stars form via competitive accretion (Larson, 1973), in which interactions between protostars drive mass segregation and subsequent gas accretion in high density cluster cores, protostars in low-density clusters would suffer fewer interactions and accrete less mass, inhibiting the growth of high-mass stars (e.g. Bonnell et al., 2004). Seeking out changes to the IMF in populations of young clusters could thus help determine how sensitive star formation within dense cores and molecular clouds is to the surrounding environment.
Some evidence does indicate that the cloud-to-cloud physics of star formation may be influenced by the local surface density of the disk. In inner disks, star formation follows a power law of the form with the measured value of ranging between 1 and 1.5 (as originally proposed by Schmidt 1959, and subsequently confirmed observationally, e.g. Kennicutt, 1989, 1998; Kennicutt et al., 2007; Bigiel et al., 2008). Such studies have been much rarer in outer disks and other low density environments, partly because of lack of CO emission (likely due to low metallicity or changes in ISM pressure; Elmegreen & Hunter, 2015). However, those that have broached this regime find a significantly steeper value of (2–3; Bigiel et al., 2008, 2010; Bolatto et al., 2011; Schruba et al., 2011), implying a significantly less efficienty coupling between star formation and gas density than found in the inner disk.
Clues to this difference may come from dwarf irregular (dIrr) or LSB galaxies, which, like outer disks, are often gas-dominated and low in mass surface density (McGaugh & de Blok, 1997; van Zee et al., 1997; Hunter et al., 2011). Stellar and gaseous disks in dIrr galaxies are also thicker than normal spirals (Elmegreen & Hunter, 2015), which can help stabilize them (Vandervoort, 1970); outer disks may again be similar, as they are frequently warped (Sancisi, 1976; van der Kruit, 1987; Bottema et al., 1987; García-Ruiz et al., 2002; van Eymeren et al., 2011). In a case study of the dIrr Sextans A, Hunter & Plummer (1996) found that stars still form at a slow rate in the peaks of the gas distribution even though dynamical arguments suggest this should not be the case (e.g. Toomre, 1964; Kennicutt, 1989). van Zee et al. (1997) found similar results for six additional LSB dwarf galaxies. These galaxies lack interaction signatures, hence van Zee et al. (1997) proposed that star formation therein is likely regulated by feedback, such as stellar winds or supernovae, locally compressing gas. Such a mechanism may be necessary to sustain star formation in environments that lack the periodic forcing provided by spiral arms or bars, which may also be absent in outer disks (Watkins et al., 2016).
One might thus consider whether these differing mechanisms yield observationally distinct populations of young clusters and H II regions. This is currently a topic of considerable discussion, and some previous studies have uncovered hints to this effect. Hoversten & Glazebrook (2008), for example, found that integrated colors of dwarf and LSB galaxies suggest a deficiency in high-mass stars; this may be related to their low integrated SFRs (Gunawardhana et al., 2011). A lack of high-mass stars may also account for the lack of high-luminosity H II regions in dwarfs and LSB galaxies (Helmboldt et al., 2005, 2009). Yet Schombert et al. (2013) found that when all 54 LSB galaxies in their sample were taken as a whole, the H II region luminosity function (LF) was the same as that found in normal spirals, hence the lack of bright H II regions in LSB galaxies could be merely a sampling effect given the intrinsic rareness of high-luminosity H II regions in general.
One means of informing this debate is to compare and contrast different star formation tracers. SFR conversion factors assume the following: that stars are sampled from a universal IMF, that the SFH is constant over Gyr timescales, and that there is no attenuation by dust (Kennicutt, 1983; Donas et al., 1987). Under those assumptions, different SF indicators should yield identical SFRs. Conversely, if different SF indicators yield different SFRs, one or more of those assumptions must be invalid. For example, when properly accounting for dust, H emission traces mainly O stars with masses , while far ultraviolet (FUV) emission traces O and B stars down to (Kennicutt & Evans, 2012); hence, variation in the H to FUV flux ratio (hereafter FFFUV) can be used to study the behavior of the high mass end of the IMF in young clusters (e.g. Lee et al., 2009).
This ratio also shows trends that may hint at environmentally dependent star formation physics: globally averaged FFFUV correlates with galaxy stellar mass (Boselli et al., 2009; Lee et al., 2009), with R band surface brightness (Meurer et al., 2009, but see Weisz et al. 2012), and with radius in some galaxies (Thilker et al., 2005; Goddard et al., 2010; Hunter et al., 2010). Unfortunately, FFFUV is sensitive to a large number of variables, which makes interpretation of these trends difficult. In addition to dust extinction (in fact, FFFUV correlates extremely well with extinction, to the point that it can itself be used as an extinction estimator; Cortese et al., 2006; Koyama et al., 2015), FFFUV decreases rapidly with age (e.g. Leroy et al., 2012) as the high-mass stars traced by H emission die off. IMF sampling effects play a similar role, and introduce stochasticity in H emission at low H II region mass, where a given H II region may be powered by a single O or B star (Lee et al., 2009, 2011). These degeneracies have led to much discussion regarding the true origin of the observed FFFUV trends, with explanations ranging from a changing IMF at low density (Pflamm-Altenburg & Kroupa, 2008; Meurer et al., 2009; Pflamm-Altenburg et al., 2009), to age effects (Alberts et al., 2011), to stochastic sampling (Goddard et al., 2010; Hermanowicz et al., 2013) or non-uniform SFHs (Weisz et al., 2012).
The nearby face-on spiral M101 (NGC 5457) provides a unique target for investigating the connection between star formation and local environment. Broadband imaging by Mihos et al. (2013) found extremely blue (BV0.2–0.4) colors in the extended LSB outer disk of the galaxy, implying a significant population of young stars at large radius. This is also apparent from deep GALEX FUV and near ultraviolet (NUV) imaging, which show that the galaxy has an XUV disk (Thilker et al., 2007). Given its disturbed morphology, this extended star formation likely resulted from an interaction with one or both of its companions, NGC 5477 and NGC 5474 (Mihos et al., 2013). Both companions are star-forming themselves and nearby on the sky. The M101 galaxy group thus provides examples of three different kinds of star-forming environments in close proximity; a high-mass star-forming disk, an LSB star-forming outer disk, and two star-forming companion galaxies with lower mass.
As such, we targeted the M101 Group for deep narrow-band H imaging with the Burrell Schmidt Telescope at Kitt Peak National Observatory (KPNO). The Burrell Schmidt’s wide field of view allows for a direct comparison of all three galaxies in the M101 Group in a single mosaic image. We use our H narrow-band imaging data in conjunction with the deepest available GALEX FUV and NUV images of M101 and its companions in order to investigate the statistical properties of the FFFUV ratio in both the H II regions as a function of these three environments. In Section 2, we give a brief overview of our observation and data reduction procedures. In Section 3, we describe our methodology for analysing the H II regions, including extinction correction, H II region selection, and photometry. We present the results of these analyses in Section 4. In Section 5, we discuss the implications of our results in the context of previous analyses of the FFFUV ratios of galaxies, as well as the broader applicability of our results. We conclude with a summary in Section 6.
2. Observations and Data Reduction
Here we present a discussion of our observing strategy and data reduction techniques. We briefly review these here; for an exhaustive description, we refer the reader to our previous work (Watkins et al., 2014; Mihos et al., 2017, and references therein). However, this previous work used broadband filters, hence we focus in this section on adjustments to these procedures necessary in shifting to narrow-band imaging data.
2.1. Observations
We observed M101 with the Burrell Schmidt telescope at KPNO in spring of 2014, using two custom narrow-band interference filters. The two filters have central wavelengths at 6589 Å and 6726 Å (hereafter the on-band and off-band filters, respectively), with 100 Å widths, necessitated by the Schmidt’s fast f beam. The on-band covers H at M101’s velocity (240 km s-1; de Vaucouleurs et al., 1991), while the off-band filter covers the adjacent stellar continuum; given M101’s low inclination, all H emission from the galaxy lies within a region of the on-band filter with 96% transmission. The on-band filter bandpass is wide enough to include Milky Way emission; however, M101 is located at a high Galactic latitude in a field relatively free of Galactic cirrus (Schlegel et al., 1998; Schlafly & Finkbeiner, 2011), limiting contamination. We observed only on moonless, photometric nights, using exposure times of 1200 s for both filters, with dithers of 05 between exposures to remove large-scale artifacts such as flat-fielding errors and scattered light. This resulted in sky levels of 200–300 ADU in the on-band filter, and 150–250 ADU in the off-band. In total, we observed M101 in each filter for s (nearly 24 hours per filter).
Due to low sky counts in the narrow-band filters, we could not construct flats from night-sky frames alone. To construct the flats, we started with twilight exposures; however, given our large field of view, these twilight flats contained noticeable gradients induced by the setting sun. We therefore also produced flats without gradients using offset night-sky frames with exposure times equal to our object frames (1200 s for both filters), as we did in constructing flat fields for our broadband imaging (see Watkins et al., 2014; Mihos et al., 2017). The final twilight flats consisted of 110 individual exposures per filter, averaging 20000 ADU px-1, while final night sky flats totaled s exposures in the on-band, and s exposures in the off-band. We defer a discussion of how we used both of these flats for the final reduction to the next section.
2.2. Data Reduction
We began data reduction by applying a standard overscan and bias subtraction, correcting for nonlinear chip response, and applying a WCS to each frame.
Flat-fielding took place in stages. We first constructed master twilight flats by median-combining all 110 twilight exposures per filter. To remove gradients in the twilight flats, we then constructed night-sky flats as described in previous works (Watkins et al., 2014; Mihos et al., 2017). In short, for each frame, we created an initial mask using the IRAF111IRAF is distributed by the National Optical Astronomy Observatory, which is operated by the Association of Universities for Research in Astronomy (AURA), Inc., under cooperative agreement with the National Science Foundation. task objmask, hand-masked any remaining artifacts (typically light scattered by stars just off-frame), and combined the resulting masked frames into a preliminary flat. We then flattened and sky-subtracted all night-sky frames using this preliminary flat, combined the flattened and sky-subtracted images into a new flat, and repeated for 5 iterations, until the flat field converged.
We isolated the twilight flat gradients through division by the gradientless night-sky flats. We then modeled and divided the planes out of the twilight flats, resulting in final generation flat fields. This is mathematically equivalent to using the night-sky flats (modulo uncertainty in the gradient fits), but with the improved Poisson statistics of the twilight flats on small scales.
Mild fringing is visible in all of our on-band images at an amplitude of 0.1%, but absent in the off-band images. As M101 is far from the ecliptic plane (hence from zodial light contributions), the main contributor of this fringing is telluric emission lines (OH; Massey & Foltz, 2000), which are not present in the off-band filter. We thus measure and correct for fringing in on-band frames only. Because scattered sunlight dominates the telluric emission in the twilight frames, the twilight flats lack the fringe pattern. Hence, to isolate the pattern, we divide the night-sky flat (which does contain the pattern) by the twilight. We then scale a normalized version of this fringe map to the sky level of each on-band frame (corrected for large-scale gradients) and subtract it from each frame. Because this fringing is present on all on-band night-sky frames, we reconstruct the on-band night-sky flat after fringe removal and rederive the on-band twilight flat gradient before flat-fielding the on-band object frames.
For our final flux calibration, we observed spectrophotometric standard stars from the Massey et al. (1988) catalog. We derived photometric zero points by convolving our filter transmission curves over the spectra of these stars to derive filter magnitudes (defined as for simplicity, where is the total flux in ADU of the star through the filter), which we compared with instrumental magnitudes derived through photometry of each exposure of each star. In each observing run, we observed 12 unique standard stars, several of which we observed multiple times to improve the final zero points. Due to uncooperative weather, we did not achieve adequate airmass coverage from these standard star observations; instead, we derived airmass terms for each filter using photometry of SDSS DR8 (Aihara et al., 2011) stars found in the individual exposures of M101 (this is described in more detail below). The photometric zero points are thus simply:
| (1) |
where is the instrumental magnitude and is the airmass term.
For each filter, we take as the zero point the median value of the zero points derived from each star. The standard error on the median is , hence errors on the two filter zero points are mag and mag; this translates to an error of 2% on M101’s total flux. In our final mosaic of M101, 1 ADU per pixel per 1200 s is equal to an H surface brightness of ergs s-1 cm-2 arcsec-2, or an emission measure of EM1.78 cm-6 pc. Using this flux calibration, we find good agreement (to within 3%) with the value of M101’s total flux published by Kennicutt et al. (2008), measured within their value of R25.
To reduce scattered light artifacts, we also remove reflections and diffuse halos around bright stars in all frames in the manner described by Slater et al. (2009). Briefly, we use deep (1200 s) exposures of Arcturus at different positions on the chip to measure and model these reflections and halos, then scale and subtract them from all stars brighter than V found in each frame. We do this scaling via a rough photometric calibration using SDSS stars found in each field, assuming our on-band filter is equivalent to SDSS r with no color term. This produces fairly robust scalings for the reflection- and halo-subtraction process; only for the brightest stars (V ) did we need to tweak the derived magnitudes by hand in order to produce an acceptable subtraction. Given this stability, the large number of SDSS stars in each frame, and the improved airmass coverage, we choose to use the airmass terms derived in this way over those derived from the standard star exposures for our flux calibration. This choice has little effect on the calibration, as the airmass terms are quite small () for both filters.
Finally, we sky-subtract each frame by masking all bright stars and galaxies, fitting sky planes to each masked image, and subtracting these planes from the frames. To preserve precise flux scaling, we then scale these images to zero airmass and median-combine them into two final mosaics (an on-band and off-band) using the IRAF tasks wregister and imcombine. Because these two mosaics combine many exposures taken under variable observing conditions, a direct subtraction of the two does not produce a clean difference image, making it difficult to identify LSB regions. Hence we create a third mosaic using individual pairs of images taken back-to-back. We align both images to within 0.1 pixels, photometrically scale and subtract the off-band images from the on-band, and combine the individual difference images into one mosaic, as before. While we use this difference mosaic to display our data, all H fluxes quoted henceforth are measured from the on-band and off-band mosaics, which preserve the flux calibration most accurately.
In our previous work, the background sky scatter was dominated by unresolved sources (background galaxies and foreground stars; see Rudick et al., 2010), however the grand majority of these sources have no emission lines that fall within our two narrow-band filters and thus cleanly subtract out. This, combined with our large total exposure time, results in extremely low background noise. We calculate the background sky uncertainty as the dispersion in the median count levels measured in 50–100 blank apertures with radius 15 pixels (22″) chosen adjacent to the target galaxies. Near M101, the background scatter in the difference image is 0.15 ADU, giving a limiting depth of ergs s-1 cm-2 arcsec-2 (EM). The scatter is slightly lower near NGC 5474 (0.13 ADU) despite it being nearer the edge of the mosaic; this is due to the presence of several slightly imperfectly subtracted reflections from bright stars near M101.
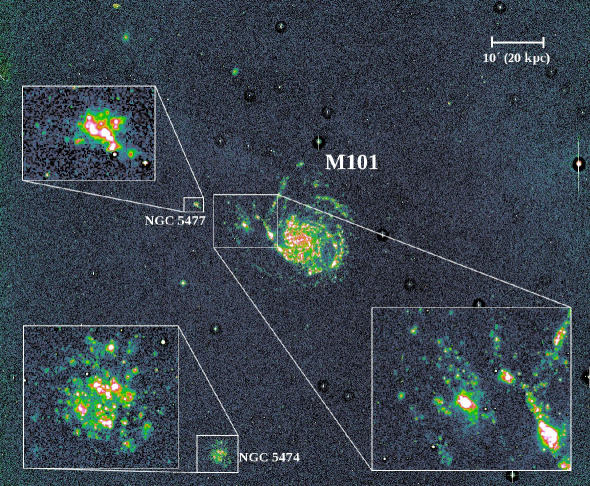
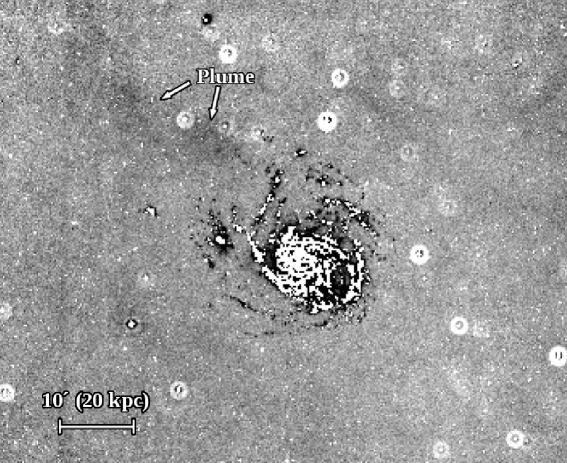
Figure 1 shows a subset of our full difference mosaic, with several areas of interest zoomed in to showcase the wealth of LSB H emission we detect. We also tentatively identify an extremely extended and LSB plume of H-emitting gas northeast of M101. While barely visible in Figure 1, we show an enhanced image of it in Figure 2, which shows our difference image masked of bright pixels (masks shown in white) and median-binned into 99 pixel bins.
The plume spans a length of 30 kpc, and has a characteristic surface brightness of (EM0.7), extending from the diffuse star-forming northeast plume region discussed by Mihos et al. (2013). When compared to adjacent background regions of similar size and shape (see Rudick et al., 2010; Watkins et al., 2014), this surface brightness amounts to roughly a 2 detection. So well removed from M101’s star-forming disk, the ionization source for this plume is unclear. One possibility is that it is gas ionized by the metagalactic ionizing background, however the feature’s H surface brightness is roughly an order of magnitude higher than expected for this phenomenon (Vogel et al., 1995). Additionally, we see no evidence of diffuse ionized gas (DIG; see, e.g., Reynolds, 1990; Haffner et al., 2009) in the long, low column density H I feature on the opposite, southwest side of M101 (Mihos et al., 2012) as might be expected if the ionization was from the metagalactic background. A more mundane explanation might be that the plume is diffuse H located within our own Milky Way galaxy. The velocity width of our filter also covers Galactic ISM velocities, and an examination of the H I data cube of Mihos et al. (2012) shows copious diffuse Galactic H I projected across the M101 Group. If this Milky Way gas is ionized, it would show as a patchy screen of diffuse H across our image. However, the spatial coincidence of the H tail with the NE plume in M101’s tidally distorted outer disk, and the lack of any comparable features elsewhere in our mosaic (which covers 2° 2°), remains intriguing.
2.3. GALEX data
In order to measure the FFFUV ratio, as well as to correct for extinction, we use the deepest available GALEX FUV and NUV images of M101 and its companion NGC 5474. The images of M101 were taken as part of the guest observing program in 2008 (GI3_05), and were first published in (Bigiel et al., 2010). These images have exposure times of 13300 s in both FUV and NUV. The images of NGC 5474 were taken as part of the Nearby Galaxy Survey (NGS; Bianchi et al., 2003) and have exposure times of 1610 s in both FUV and NUV, hence are shallower than those of M101. We calculate all FUV and NUV fluxes directly from the intensity maps, while we calculate photometric errors on these fluxes as Poisson errors using the associated high resolution relative response maps (as discussed in Morrissey et al., 2007). Because FUV fluxes are given as monochromatic fluxes, we multiply all FUV fluxes by the FUV filter’s central wavelength in order to keep the ratio FFFUV unitless.
2.4. Background/Foreground Contamination
Given the width of our filters, we detect H emission from sources at a large range of redshifts (we cover H-emitting sources at 10% transmission out to 4300 km s-1 in our on-band filter), resulting in both background and foreground contamination. While background spiral and elliptical galaxies are typically resolved, hence identifiable by eye, we also find many point sources in the difference mosaic that are not obviously associated with the M101 Group galaxies.
We investigated the origins of these point sources using the method described by Kellar et al. (2012). Briefly, they define a quantity , where is the magnitude of a source in their filters targeting H emission and is the magnitude of the same source in their continuum R band filter, scaled such that for sources with no emission present in the H filter. They label unresolved sources with “H dots”, which are simply point sources that are bright in their difference images. As we use a narrow-band continuum filter instead of R, in our case . We utilize the same cutoff limit as Kellar et al. (2012) for “dot” selection, that being sources with emission line equivalent widths Å. This corresponds to for our filter widths of 100Å.
While Kellar et al. (2012) obtained follow-up spectroscopy of the H bright point sources in their fields, such follow-up is beyond the scope of our project. Hence, we investigated the H dots in our field by cross-referencing them with SDSS and plotting their vs. colors. We find that the majority of the H dots in our final mosaic lie in the region of color-color space occupied by M stars (Figure 1 of Finlator et al., 2000), while only a select few have colors bluer than this. This M star contamination results from the width and placement of our filters; typical M star spectra contain broad TiO absorption features, and our on-band filter’s central wavelength (6600Å) happens to often lie on a peak in between two such features, while our off-band filter (6700Å) lies in an adjacent trough. This gives M stars the appearance of an emission line source in the difference mosaic.
Thankfully, these stars are readily identifiable as being bright in the difference mosaic but strongly lacking in FUV emission, as well as through available SDSS photometry. We hence reject all sources with FFFUV -1.4 (this cutoff is also justified by Starburst99 models, which never reach FFFUV higher than this; Leitherer et al., 1999), , and . The handful of dots with bluer colors are likely unresolved background galaxies, unresolved star-forming dwarfs near M101, or intergalactic H II regions (Kellar et al., 2012). For example, SDSS spectra of two of the sources shows that they are quasars at (2118225, 5375559) and at (21113981, =5340635); we detect redshifted Mg emission from both of these sources. These bluer sources are rare, however (we find 8 across our entire field of view, for a surface density of 2 per square degree), hence have a negligible effect on our analyses.
3. Methods
We present here our analysis of H II regions in the M101 Group. We begin by discussing our extinction correction method, then we discuss how we identify H II regions against the DIG background, and conclude with the results of this analysis.
3.1. Extinction Correction
Given that we focus much of this study on the ratio FFFUV, the components of which are separated by some 5000Å in wavelength, some manner of extinction correction is called for. Ideally, this would be done using direct tracers of nebular extinction such as the Balmer decrement (the H/H flux ratio). While Balmer decrements have been published for 200 of the brighter H II regions in M101 (Scowen et al., 1992), we need an extinction correction we can apply across the entire dataset, and so we choose to employ the GALEX-calibrated radial IRX- extinction correction method described by Goddard et al. (2010, in their Section 3.6). We recap this method briefly here.
IRX- is an empirical relationship between the ratio of the infrared and UV luminosities (the infrared excess, IRX) and the slope of the UV continuum (). It works under the assumption that all of the non-ionizing UV radiation that is absorbed by intervening dust is reprocessed into the IR (Heckman et al., 1995; Meurer et al., 1995, 1999). IRX- can be calibrated for the GALEX passbands into the following form:
| (2) |
where FUV and NUV are apparent AB magnitudes in the respective GALEX passbands (Calzetti, 2001; Seibert et al., 2005; Cortese et al., 2006; Goddard et al., 2010). For normal star-forming galaxies, Cortese et al. (2006) give , while Seibert et al. (2005) give a value of . This value depends on the assumed star formation history (e.g. Calzetti et al., 2005), which affects the transformation from to FUVNUV color. The value of depends on the age of the regions of interest, and is relatively constant for populations aged between 0–30 Myr (Figure 9 in Goddard et al., 2010). We then derive the H extinction as AAFUV, following Equation 13 of Calzetti (2001).
Following Goddard et al. (2010), we make bulk radial extinction corrections using the median FUVNUV color of H II regions (hence excluding DIG and field O and B stars) in both M101 and NGC 5474. For ease of comparison, we adopt the same values of and as Goddard et al. (2010), which are, respectively, the average of the values of published in Calzetti (2001); Seibert et al. (2005); Cortese et al. (2006), and the typical color of 10 Myr old populations (Figure 9 in Goddard et al., 2010). We find that our results are not sensitive to these choices for reasonable values of both. The primary purpose of this correction is not to accurately account for dust effects from H II region to H II region, but rather to make a reasonable bulk correction that places the inner and outer disks at the same mean extinction level for a more consistent comparison among environments. This is particularly pertinent in our study, in which we measure the scatter in FFFUV from environment to environment; because we are comparing populations across large radial expanses (e.g. M101’s inner vs. outer disk), a strong gradient could increase the scatter in a given radial range.
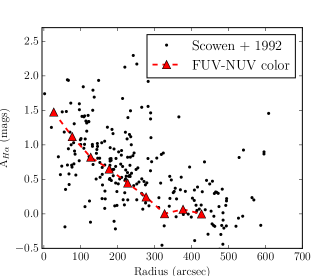
For comparison, we employed an alternative correction in M101 using the extinction values published by Scowen et al. (1992), derived from the Balmer decrement. We show this comparison in Figure 3 by overplotting our UV color–derived values of to the values for H II regions from Scowen et al. (1992), plotted as a function of radius in M101. While the two are broadly consistent, the UV color–derived AHα values are consistently lower by 0.1 mag. This is sensible, because the UV emission is directly tracing the stellar populations, which may not always lie behind a screen of dust depending on the relative dust geometry (for a beautiful demonstration of this, see Figure 1 of Whitmore et al., 2011). Because we are deriving the H extinction values by scaling AFUV, this geometrical uncertainty also propagates into our values of AHα. However, we find through application of both methods that this small offset does not affect the conclusions of this paper. We therefore use the UV color–derived values throughout to maintain consistency.
3.2. Region identification
We use SEXtractor (Bertin & Arnouts, 1996) to identify H II regions directly from the H difference mosaic. Because we are selecting regions based on their H emission, we are focusing our study only on regions with ongoing star formation. Our interest in this particular study is in comparing physical differences in star formation (for example, changes in the IMF) across environments, hence by focusing on such short timescales, we avoid complications introduced by aging populations, such as the dissolution of H-emitting regions by stellar winds (Whitmore et al., 2011).
We perform photometry on all regions using a 45 (150 pc) radius aperture, which is the typical FWHM of the GALEX FUV PSF (the Burrell Schmidt PSFs in the on- and off-band images have FWHM3″, hence the use of the FUV FWHM is warranted). This is large enough to contain multiple H II regions at M101’s distance (see, for example, Quireza et al., 2006, for sizes of Milky Way H II regions); we discuss how this affects our conclusions in Section 4.3. However, our statistical analyses are also robust to moderate adjustments to the aperture size. Additionally, we apply an aperture correction of 0.247 magnitudes to the FUV fluxes, derived from FUV-bright stars in the M101 field (this agrees well with the curve of growth presented by Morrissey et al., 2007).
To efficiently pick out both outer-disk and inner-disk H II regions, we run SEXtractor at a 2 threshold on an unsharp-masked version of our difference mosaic, without deblending. This turns SEXtractor into something of a local peak-finding algorithm, hence is useful for identifying the often densely packed inner-disk H II regions against the smooth background DIG. That said, it results in many spurious detections, thus we employ several rejection criteria. First, we run SEXtractor in dual-image mode, measuring fluxes of difference image detections from the FUV images; we reject all regions with , where is the pixel-to-pixel background dispersion in the FUV images (measured from the intensity maps in the manner described in Section 2.2). We also reject any sources with FFFUV -1.2, which is set by the maximum FFFUV value we find in Starburst99, from a zero-age cluster with solar metallicity (lower than the lowest metallicity found in M101; Croxall et al., 2016). We also reject sources with and to remove M stars (Section 2.4). Finally, we reject all sources 1440″ (48 kpc) in radius from M101, and 360″ (12 kpc) in radius from NGC 5474.
These cuts remove the bulk of the contaminating sources. However, running SEXtractor with no deblending detects not only H II regions, but also local peaks in the DIG. These regions are identifiable by eye as being more uniform in flux across the photometry aperture (as opposed to the point source–like H II regions). However, to reduce subjectivity, we make a first-round rejection of such regions via an automated procedure. We define a concentration parameter:
| (3) |
where is the fraction of pixels in the photometry aperture containing 50% of the total flux ( is defined such that high values correspond to higher concentration). We iterate the threshold value of until we see a reasonable rejection of diffuse regions, then reject the few remaining DIG regions by hand. We choose not to reject diffuse-looking regions in the outer disk; H II regions expand until they reach pressure equilibrium with the ISM (Dyson & Williams, 1980; Garcia-Segura & Franco, 1996), hence in low density environments they can potentially grow quite large. The statistical analyses we discuss below are robust to this rejection procedure, as diffuse-looking regions most often have anomalously low FFFUV (which further implies they are mostly DIG; Hoopes et al., 2001), and are rejected as outliers in the statistical metrics we use.
One concern is that in choosing regions based on H emission, there is the possibility that we are missing a population of UV-bright but H-weak clusters. This would include, for example, very massive clusters that nonetheless contain no highly ionizing, very massive stars due to a truncated IMF. We thus compared our H-selected samples with separate samples selected from both galaxies’ FUV images, using the same procedure as before, however in this case, we rejected regions based on their compactness in the FUV images rather than the H image, in order to preserve FUV-emitting clusters. While the FUV-selected samples did uncover a large (200) number of additional very FUV-faint regions (mostly in the outer disk), as compared to the H-selected sample we found no significant number of additional FUV-bright regions at any radius. All of the additional FUV-faint regions selected also cover a wide range of H flux (-14.6 – -17 ergs s-1 cm-2), and most appear diffuse and irregular in the H difference image. For example, many lie in the diffuse outskirts of H II region complexes, or along filaments of more isolated diffuse emission. This implies that they could mostly be older FUV-emitting clusters embedded within the DIG. It thus appears that if there is a population of FUV-bright but H-faint regions in either M101 or NGC 5474, it is not significant with respect to the general population of star-forming regions in either galaxy at any radius.
4. Results
4.1. H II Region Photometry
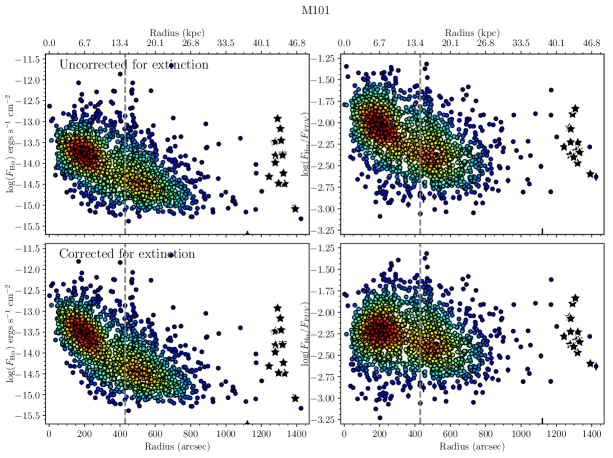
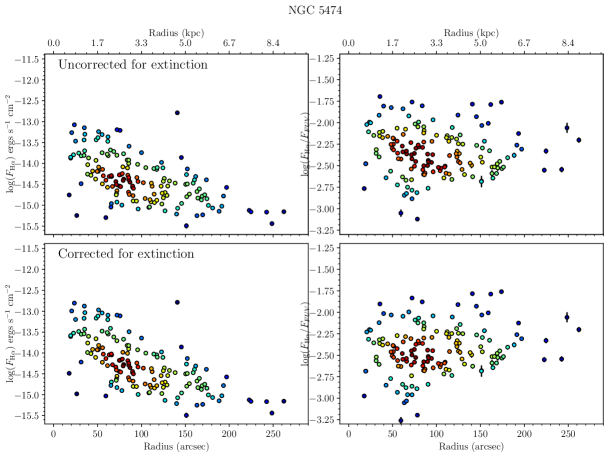
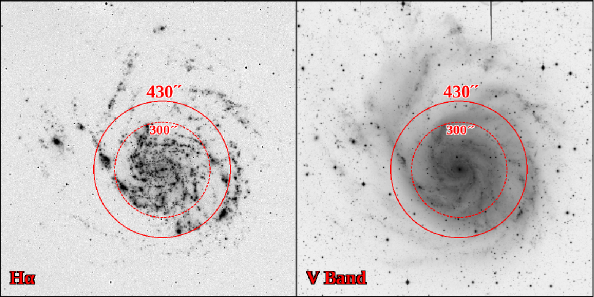
We show the results of our H II region photometry in Figures 4 and 5 for M101 and NGC 5474, respectively. The final sample contains 1525 H II regions in M101 and 156 regions in NGC 5474. We show radial profiles of on the left and FFFUV on the right. For comparison, we show radial profiles before and after we apply the extinction correction described in Section 3.1 (top and bottom plots, respectively). The grey dashed lines in Figure 4 mark M101’s outer disk, which we define as 3 times the azimuthally averaged disk scale length (430″, 14.5 kpc; Mihos et al., 2013). In Figure 6, we show this outer disk demarcation and a potential alternative on both our difference mosaic and on the V-band data from Mihos et al. (2013), for reference. We discuss how the choice of outer disk boundary affects our results in Section 4.2.
It should be noted here that NGC 5474 has a strongly offset bulge (van der Hulst & Huchtmeier, 1979; Kornreich et al., 1998), hence the definition of its “center” is not entirely clear. We define its center as the centroid of the circular outer isophotes (at 180″, or 6 kpc) on our on-band mosaic, which is very close to the kinematic center of its (strangely regular) H I velocity field (van der Hulst & Huchtmeier, 1979). This choice does not affect the qualitative behavior of the radial profiles, however the flux profile does show more scatter with radius when centered on the bulge. This implies that the isophotal center is the more appropriate choice regarding star formation in this galaxy.
The extinction correction has the expected behavior: H fluxes increase absent extinction, and FFFUV decreases given stronger attenuation for FUV. The correction applied at all radii in the lower metallicity companion NGC 5474 (which has a central O abundance of , vs. 8.71 in M101; Pilyugin et al., 2014) is less severe than that applied in the dustier central regions of M101. Additionally, we plot the values of and FFFUV for the dwarf irregular (dIrr) companion NGC 5477 (due east of M101; see Figure 1) in the same plots as M101 using black stars. Despite its much smaller mass, NGC 5477’s H II regions span the same range of luminosity as those in M101’s inner disk, implying similar LFs between the two environments. The same appears true of NGC 5474; we found it possible to reproduce NGC 5474’s global LF by resampling from M101. Each galaxy contains pockets of high column density gas (of order cm-2; van der Hulst & Huchtmeier, 1979; van der Hulst et al., 2001; Walter et al., 2008), which may account for the similarity. Regardless, that all three galaxies have qualitatively similar LFs is reminiscent of the study by Schombert et al. (2013), which found that the lack of bright H II regions in LSB galaxies can be explained as an artifact of small number statistics, rather than as a change in the LF itself.
Yet though each galaxy’s integrated LF appears similar, there are strong radial gradients in mean H luminosity in both M101 and NGC 5474. This is most likely a demonstration of the Schmidt Law: molecular gas density in M101 declines exponentially with radius (e.g. Kenney et al., 1991), hence the SFR declines accordingly (Kennicutt et al., 2007; Bigiel et al., 2008). Also, the azimuthally-averaged SFR and gas density within galaxies have a power law relationship (up to the threshold density; Kennicutt, 1998), hence it is not surprising that we see general radial declines in mean H flux with a large region-to-region scatter. A comparison with the THINGS H I map of M101 (Walter et al., 2008) also shows that regions with the highest H flux for their radius always cluster around high H I column density peaks. That the global H II region LFs of M101 and NGC 5474 (and possibly NGC 5477) appear similar thus seems a consequence of each having a similar density structure within its ISM.
If gas density alone imposes the radial dependence of H flux, it should affect the FUV flux in a similar way, assuming no dramatic changes in e.g. the IMF. Indeed, Figure 4 shows that the radial gradient in FFFUV in M101 is strongly reduced after the extinction correction is applied. NGC 5474 contains no strong gradient before correction; this remains mostly true after a correction is applied, although a mild positive gradient is induced, implying that perhaps we are slightly overcorrecting for extinction in this galaxy. We also find that FFFUV and FFUV are uncorrelated after applying an extinction correction in either galaxy. Therefore, it may be that any radial trend in mean FFFUV in either galaxy can be attributed to extinction.
The scatter in FFFUV also appears roughly constant with environment, from M101’s inner disk, to its outer disk, to NGC 5474, and possibly even NGC 5477 (though with only 14 total H II regions, any measure of scatter in this galaxy will be highly uncertain). In tandem, this implies that star formation is ignorant of the global environment; other than the available fuel, it does not seem to know whether it is taking place in a low mass galaxy, a high density inner disk, or a low density outer disk. We test these observations explicitly in the next section.
4.2. Statistical Analysis
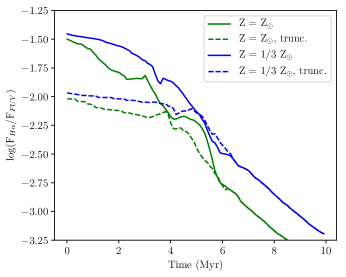
The intrinsic FFFUV ratio is mainly driven by the number of massive O and B stars. If present, they are the primary source of the ionizing radiation that powers the H emission. A truncated IMF would result in fewer massive stars being born, reducing the maximum possible FFFUV. We show this in Figure 7 via evolutionary tracks of FFFUV in single-burst models from Starburst99 (Leitherer et al., 1999) for two different metallicities. We show both a standard Kroupa IMF (solid lines; Kroupa, 2001), and a Kroupa IMF truncated at 30 M⊙ (truncations as low as 20 M⊙ have been suggested, e.g., Bruzzese et al., 2015). The tracks diverge clearly at early times (6 Myr, set by the lifespans of the most massive stars), with the truncated IMF tracks peaking at much lower FFFUV as expected. If a change in the IMF occurs at a given radius in a galaxy, the distribution of allowed values of FFFUV in the H II region population will adjust accordingly. Lower variation in the region-to-region dust content in outer disks would result in a similar change, once bulk radial trends are taken into account. Such behavior ought to be observable, therefore, in the scatter of bulk extinction-corrected FFFUV within different populations of H II regions, assuming that variations in the median FFFUV can be fully attributed to extinction effects.
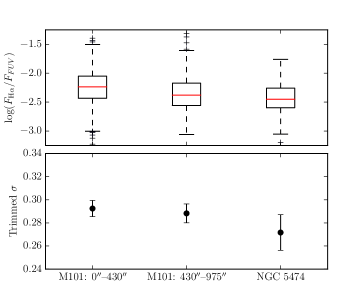
We display the medians and two measures of the scatter in FFFUV in Figure 8 for three regions: M101’s inner disk (inside of ), M101’s outer disk (outside of ), and the more massive companion NGC 5474. The inner/outer disk boundaries in M101 are marked on both Figures 4 and 6, for reference.
In the top panel of Figure 8, we show box and whisker diagrams for these three regions. As a reminder, the boxes span the 1st through 3rd quartiles of the data (Q1 and Q3), and the whiskers span to 1.5 the interquartile range. Medians are shown in red, and outliers as ’s. In the bottom panel, we show the values of the trimmed standard deviation () for the same three regions. This is the standard deviation of the sample trimmed of its top and bottom 5% of values, multiplied by a corrective factor ( for 5% trimming; Breiman, 1973; Huber, 1981; Morrison et al., 1990) to ensure that and (the standard deviation of the whole sample) are measuring the same parameter in the case of purely Gaussian data. We use over for its robustness to outliers, such as extremely luminous H II regions or the handful of DIG regions that might have made it into the final sample; other such robust estimators of scatter (such as the median absolute deviation) give similar results. The error bars on are simply the standard error on the standard deviation, which is equal to for sample size .
After we apply our extinction correction, the median values of FFFUV for all three regions are: -2.2350.013, -2.3790.015, and -2.4510.029, respectively. While this implies statistically significant differences in the medians from region to region, we give only the standard errors (which are equivalent to bootstrapped errors, despite the slight non-Gaussianity of the data). Systematic errors on the GALEX-calibrated IRX- extinction correction are larger (of order 0.1 mag, excluding uncertainties in the transformation from FUVNUV color to ; Cortese et al., 2006), which does not include methodological uncertainty inherent in applying this correction on average in radial bins. The differences in the medians between all three regions are also smaller than the standard deviations in FFFUV (), again implying that most of the gradient in FFFUV in M101 can likely be explained by extinction alone.
Similar box widths in Figure 8, as well as similar values of , also suggest that the scatter in FFFUV among the three regions are equal. We therefore compare the sample variances using Levene’s Test (Levene, 1960). This test assesses whether or not the quantity , where is the mean of the i-th group, is equal between groups. It is hence similar to the F-test in that it assesses equality of variances between populations, but it is more robust to non-Gaussianity and higher in statistical power (e.g. Lim & Loh, 1996). The mean can be replaced with a more robust statistic, such as the median (e.g. Brown & Forsythe, 1974); we use the trimmed mean, defined analogously to the trimmed standard deviation.
We show the results of this test in Table 1 for the following comparisons: M101’s inner disk to its outer disk, M101’s inner disk to NGC 5474, M101’s outer disk to NGC 5474, and all three simultaneously. is the value of the test statistic, while the p-value is defined in the standard way for confidence . In all four tests, we cannot reject the null hypothesis that the variances in FFFUV in all three environments are equal. While, for philosophical reasons, this does not by itself prove that the variances are equal, these results in conjunction with the similarity in values of and widths of the box plots for each region strongly imply that this is the case. We verified that this result is not sensitive to the definition of the outer disk; the conclusion remains true for choices anywhere between 300″ (the point at which the H surface brightness profile begins to decline; Martin & Kennicutt, 2001) and 600″ (roughly the Holmberg radius, R26.5; Mihos et al., 2013).
| TEST: | In-Out | In-5474 | Out-5474 | All |
|---|---|---|---|---|
| W | 0.293 | 0.009 | 0.052 | 0.147 |
| p-value | 0.588 | 0.924 | 0.821 | 0.863 |
While the comparisons between the regions of M101 and NGC 5474 seem immune to the choice of inner disk–outer disk boundary, large uncertainties in regions with smaller sample sizes could make it harder to draw such a strong conclusion. We thus further tested this through a bootstrapping experiment. For each definition of the inner disk–outer disk boundary, we randomly sampled values of FFFUV from either the inner or outer disk, with equal to NGC 5474’s sample size. We then ran Levene’s Test again between the downsampled M101 population and NGC 5474. We repeated each sampling test 10000 times; in all tests, the resulting p-values were 0.05 between 93% and 97% of the time, providing evidence that the results of the previous tests using the full samples were not an artifact of sample size.
While these results are robust to the choice of inner disk–outer disk boundary, we find that the lowest p-value was obtained using 300″ rather than 430″ (p0.14 vs. 0.59, respectively). By splitting the disk into three parts, we found that the region within 300″–430″ does have significantly higher scatter in FFFUV. Figure 4 shows that this region has a low density of H II regions relative to the rest of the disk. It also appears dynamically distinct; it lies roughly at co-rotation with the inner disk spiral arms (Waller et al., 1997), and is the site of a severe kink in the H I rotation curve (Meidt et al., 2009). This is also the location of a pocket of high velocity gas in the galaxy’s northeast (Walter et al., 2008; Mihos et al., 2012) and a region with a high velocity dispersion (Walter et al., 2008). Dynamical effects may thus have influenced the H II region population in this particular area (a high gas velocity dispersion, for example, may inhibit star formation; Kennicutt, 1989).
Aside from this unusual region, however, we find that once extinction is taken into account, both the median FFFUV and the scatter in FFFUV shows no significant variation with environment in the M101 Group. This supports our initial conjecture that, aside from gas density (which affects the intensity of the star formation), star formation on short timescales is blind to environment.
4.3. Comparisons with Starburst99 Models
If both the median and scatter in the FFFUV ratio in H II region populations is constant with environment, once extinction is taken into account, one might question how much room is left for variations in the IMF. We explore this question through comparisons with Starburst99 (Leitherer et al., 1999) models, which we show in Figure 9.
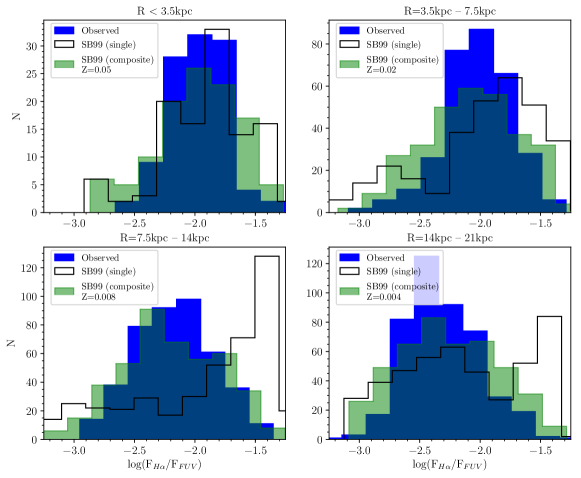
Blue histograms in Figure 9 show the distributions of FFFUV in H II regions in four radial bins within M101, uncorrected for extinction. In order to compare our data with Starburst99 models, we chose these bins such that their mean metallicities (measured from the H II region metallicity values supplied by Scowen et al., 1992, which range from 5 solar to solar) corresponded to the metallicity options available in Starburst99. While Starburst99 does not include the effects of stochastic sampling from the IMF, given our low resolution the majority of the regions we sample are likely massive enough to be above the stochastic limit (at M101, below F -15, e.g. Hermanowicz et al., 2013), hence these effects should not be important.
To generate model samples, we first create model evolutionary tracks of H flux (using the output H luminosity) and FUV flux (by convolving the output model spectrum at each timestep with the FUV transmission curve) normalized to unit mass for each of the four metallicities. To create a realistic cluster sample, we create a random distribution of masses following a power law with a slope of -2 (e.g. Lada & Lada 2003; Hunter et al. 2003; Weidner et al. 2004; we note that the results are robust for any reasonable choice of the slope value), uniformly sample the model fluxes in time between 0 and 10 Myr, and multiply these mass-normalized fluxes by the randomly generated cluster masses to produce a range of model cluster fluxes. We then apply extinctions to these model fluxes at random, drawn from the dataset by Scowen et al. (1992) within the appropriate radial bins, and then trim the generated model regions to ensure that the distribution of model H fluxes matches that of the data in each radial bin. We also reject model regions with FUV fluxes below the observational limit. The results are shown as the empty histograms in Figure 9.
It can be easily seen in Figure 9 that these distributions provide a poor match to the data in all radial bins. As noted in Section 3.2, our choice of photometry aperture (45) corresponds to 150 pc at M101’s distance, and is hence large enough to potentially include multiple H II regions (as well as surrounding DIG). We verified this through visual comparison with archival HST H imaging of M101 (GO13773, PI Chandar), and found that our apertures contain typically 4–5 individual H II regions. Adjacent H II regions should be similar in metallicity, but may not be uniform in age; the Orion Nebula complex, for example, contains four stellar associations within a 100 pc radius that span ages from 0–10 Myr (Brown et al., 1994), arguing that any individual H II region complex identified in our sample may actually consist of multiple clusters with varying ages.
Indeed, we found that we could reproduce the observed distributions much more successfully by using model clusters generated by adding together individual Starburst99 models of varying ages, where is drawn from a Poissonian distribution with expectation . These are shown via the green histograms in Figure 9, where we have adopted a standard Kroupa IMF. While we cannot exactly reproduce the true distributions of FFFUV in any radial bin, this is perhaps not surprising given the large number of assumptions we have made (single metallicities per radial bin, randomly sampled extinction values, etc.). Still, the median values of the model distributions are close to the true values (within 0.1 dex in all radial bins), and the models tend to share the skewed Gaussian appearance of the true distributions. Given the qualitative nature of these comparisons, however, we must address two caveats.
First, we note that in order to reproduce the observed distributions in the two outermost radial bins, we must employ H and FUV flux cuts on both the low and high ends. We find that if we trim only low fluxes, to match our observational limits, we cannot reproduce the distributions of FFFUV in the two outermost radial bins regardless of which IMF we choose. Pure random sampling from the cluster mass function results in too many bright clusters for these outermost regions of M101. This result is in agreement with Pflamm-Altenburg et al. (2013).
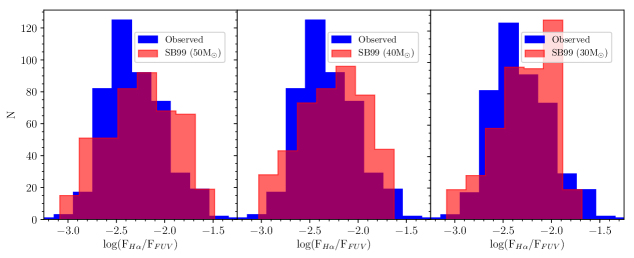
Second, even with these cuts the match appears poorest in the two outermost bins. As has been previously argued, because outer disks seem to lack molecular gas and show extremely inefficient star formation, the IMF in such environments may be biased toward low mass stars (e.g. Meurer et al., 2009; Pflamm-Altenburg et al., 2009; Bigiel et al., 2010). Hence we attempted to determine whether or not a truncated IMF provided a better match to this bin. This is shown in Figure 10, where we compare the distribution of FFFUV values in the lowest metallicity (outermost) radial bin to three different models, truncated at 50 M⊙ (left panel), 40 M⊙ (middle panel), and 30 M⊙ (right panel). Again, these models are averages of typically 4-5 model regions. We find that 50M⊙ is the lowest truncation mass we can use in order to produce satisfactory qualitative agreement with the data. Below this mass, the model distributions of FFFUV tend to be skewed strongly to the left and consistently lack high FFFUV tails. The lower the truncation mass, the sharper the cutoff at high FFFUV.
Figure 7 provides an explanation: the time evolution of FFFUV for truncated IMFs shows a plateau at early ages, the length of which depends on the lifetime of the highest mass star, beyond which FFFUV begins to decline. The plateau value itself also depends on the mass, such that lower truncation masses plateau at lower values of FFFUV. The standard Kroupa IMF model, by contrast, shows a steady decline over a larger range of FFFUV values; the decay in FFFUV reflects the larger range of contributing stellar masses, hence the larger range of stellar lifespans. Uniform sampling in time from the truncated distributions thus results in a distribution of FFFUV that is strongly peaked at the plateau value. Extinction adjusts the model values of FFFUV slightly higher, but is not strong enough in the outermost bin to create a noticeable high-FFFUV tail.
In summary, we find that while IMFs truncated as low as 50 M⊙ can qualitatively reproduce the observed distributions of FFFUV in H II regions throughout M101, they produce no better agreement than a standard Kroupa IMF.
5. Discussion
We have shown that the distribution of the FFFUV ratio in H II region populations, aside from extinction effects, does not change with environment in the M101 Group. We have also shown that we can model the observed distributions of FFFUV in H II regions throughout the M101 Group without invoking a truncated IMF. The makeup of stellar populations ionizing H II regions throughout the M101 Group therefore appears ignorant of the local surface mass density; only the intensity of star formation changes.
We thus consider the possible origin of trends in FFFUV with e.g. galaxy stellar mass and central surface brightness found by other authors (e.g. Lee et al., 2009; Meurer et al., 2009). Because these studies focus on the integrated H and FUV fluxes of galaxies—which includes compact H II regions, DIG, and diffuse FUV emission—we consider how the DIG, diffuse FUV emission, and bias in measurement techniques might each contribute to the observed trends in integrated FFFUV of whole galaxies. Finally, we discuss our results in the context of the M101 Group itself, particularly its tidal interaction history, and consider whether or not our results for this group can be generalized to other systems.
5.1. On the Observed Trends of Integrated FFFUV
If the IMF does not change with environment, as we have argued, why then do many studies find that FFFUV integrated over galaxies, or azimuthally averaged in wide radial bins, is lower in low density environments (e.g. Gil de Paz et al., 2005; Thilker et al., 2005; Lee et al., 2009; Meurer et al., 2009; Goddard et al., 2010)? Because the integrated FFFUV includes all sources of H and FUV emission, from H II regions to DIG to diffuse FUV with no H counterpart, changes in integrated FFFUV can result from many different factors, from variations in the IMF, to stochastic sampling of the IMF in low mass clusters, to a non-uniform SFH (e.g. Lee et al., 2009; Pflamm-Altenburg et al., 2009; Alberts et al., 2011; Barnes et al., 2011, 2013; Weisz et al., 2012; da Silva et al., 2014).
We have shown that variation in the IMF is unlikely within the M101 Group. Given our low resolution, most (90%) of the H II region complexes we identified have fluxes above where stochastic sampling ought to be important (e.g. Hermanowicz et al., 2013). However, a non-uniform SFH could could result in abundant populations of FUV-emitting stars with no H counterpart, specifically if such populations are remnants of a fading burst of star formation. Therefore, given that FFFUV is roughly constant in H II regions, we test for an overabundance of FUV relative to H by comparing the fractions of diffuse H emission (or the DIG fraction, hereafter ) and diffuse FUV emission (hereafter, ). We define “diffuse” emission as any H or FUV emission located outside of what we have defined as H II regions, for simplicity; hence, we measure and by masking out H II regions.
For the purposes of this study, we are concerned mainly with the relative values of the diffuse fractions between environments, hence it is important only that we measure and in a consistent manner for each environment. However, given that we base our mask on the low-resolution GALEX imaging, it is useful to compare our value of with that found in other studies to estimate how much of the DIG directly adjacent to H II regions we could be masking. Given our canonical mask (45 apertures), we find a DIG fraction of 33%. Our masking thus appears more aggressive than previous studies of the DIG (e.g. Thilker et al., 2002, who found a DIG fraction of 43% in M101), implying that with our canonical mask we are isolating the most diffuse part of the DIG. Changing the mask aperture by 15 yields changes in and of of 20%.
To test the influence of this masking on the relative fractions of DIG and diffuse FUV , we measured the azimuthally averaged radial profile of FFFUV in the DIG in both M101 and NGC 5474. We found that both galaxies display a distinct downward trend in FFFUV with radius—implying dominant diffuse FUV emission in their outer disks—which persists even when using an unrealistically aggressive mask that results in 6% for M101. Therefore, our masking procedure does not appear to influence the results we present here. We defer a more detailed discussion of the DIG in the M101 Group to a forthcoming paper.
While the expectation is that high relative to should yield lower integrated FFFUV ratios, we find that this is not always the case, implying that there may be methodological bias at play as well in measuring integrated properties of galaxies and regions of galaxies. Specifically, a bias may be incurred when using flux-weighted values over, e.g., areal-weighted values of H and FUV flux.
| Region: | M101 | Inner M101 | Outer M101 | NGC 5474 | NGC 5477 |
|---|---|---|---|---|---|
| 0.33 | 0.34 | 0.28 | 0.17 | 0.20 | |
| 0.56 | 0.51 | 0.60 | 0.42 | 0.45 | |
| FFFUV | -1.98 | -2.08 | -1.95 | -2.29 | -2.14 |
| FFFUV, corr. | -2.21 | -2.22 | -2.21 | -2.48 | -2.22 |
Note. — Rows are: fraction of H flux from the DIG (1), fraction of diffuse FUV emission (2), integrated FFFUV (3), and integrated FFFUV corrected for extinction (4). Systematic uncertainties, which dominate, are discussed in the text.
In Table 2, we give diffuse fractions in five environments in the M101 Group: M101 as a whole, M101’s inner disk, M101’s outer disk, its more distant companion NGC 5474, and its nearby dIrr companion NGC 5477. We measure both and in an identical manner, hence they are comparable regardless of uncertainty in e.g. the choice of H II region mask. Additionally, for each region we give integrated values of FFFUV before and after applying an extinction correction. In this case, we apply an integrated correction, measured using the integrated FUVNUV colors of each region, as is typically done in galaxy survey studies (e.g., Lee et al., 2009; Meurer et al., 2009).
Comparison of the diffuse fractions in H and FUV indicate that diffuse FUV emission is more prevalent compared to DIG in M101’s outer disk and in both companion galaxies. This concurs with a visual examination of the images; in M101’s outer disk, for example, we find many large (several kiloparsec wide) patches of diffuse FUV emission that have no H counterpart in our difference image. The areal covering fraction of diffuse FUV emission appears larger than the DIG covering fraction across the whole outer disk, while in the inner disk, the covering fractions of both are roughly equal. Quantitatively, this is observable as a larger outer disk scalelength in the FUV compared to the H, such as is typically seen in other XUV disks (Gil de Paz et al., 2005; Thilker et al., 2005; Goddard et al., 2010).
However, the integrated values of FFFUV do not reflect this. Despite the larger fractions of older FUV-emitting populations in M101’s outer disk and in the two companion galaxies, after correcting for extinction, only NGC 5474 shows a significantly different value of integrated FFFUV. This appears to be an artifact of the flux-weighted measurement; in NGC 5474, we find that the brightest 10% of H II regions (only 16 regions) contribute nearly 60% of the galaxy’s total H flux. Thus, if something is systematically different about these few regions—age, dust content—compared to the remaining H II regions in the galaxy, this difference will drive the galaxy’s flux-weighted mean FFFUV ratio to an unrepresentative value. In NGC 5474, the brightest H II regions have redder FUVNUV colors (0.05 compared to 0.1 in the dimmer regions). Because we derive the extinction based on the UV color, these regions are measured as dustier environments; if so, the extinction correction may be overcompensating for dust throughout NGC 5474 and driving the integrated FFFUV down.
This is demonstrated in an alternative way in M101’s outer disk. As in NGC 5474, the brightest regions in M101’s outer disk are redder in UV color (0.05 compared to 0.2), hence potentially dustier, and again contribute a large fraction of the region’s total H flux (40%). Before applying an extinction correction, the median FFFUV value of all of the H II regions in M101’s outer disk is -2.32, but the flux-weighted mean value of H II regions is -2.09. Flux-weighting thus drives the integrated FFFUV ratio of H II regions in M101’s outer disk to a higher value, as it is biased by the brighter, redder regions, in direct analogy with the integrated FFFUV value of NGC 5474.
As such, it is unclear whether or not the trends in integrated FFFUV with stellar mass, SFR, and surface brightness noted in other studies result from physical changes or purely from systematics induced by the flux-weighted measurements. Regardless, the M101 Group is a well-studied system, with constraints on stellar populations throughout its disk and constraints on its tidal interaction history with its companions (e.g. Beale & Davies, 1969; Rownd et al., 1994; Waller et al., 1997; Mihos et al., 2013). We can therefore make more specific conclusions about how M101’s local environment may have influenced the star formation taking place in its outer disk and companions, and consider whether or not these conclusions can be generalized to other similar systems. We discuss this further in the following section.
5.2. The M101 Group As a Case Study
We have shown that in the M101 Group, H II regions have roughly constant FFFUV distributions regardless of their environment. We have also shown that diffuse FUV emission, with no H counterpart, is abundant in M101’s outer disk and its two companions, implying widespread populations of slightly older O and B stars in the field, similar to other XUV disks (e.g. Gil de Paz et al., 2005; Thilker et al., 2005). We argue here that this can be explained in the context of M101’s interaction history, and consider whether or not star formation in the low density environments of the M101 Group could be representative of low density environments as a whole.
In general, the origin of field O and B stars is not yet clear. They may form in-situ (de Wit et al., 2005; Lamb et al., 2010; Oey et al., 2013), form within H II regions but be ejected at high velocity (Gies, 1987; Moffat et al., 1998; de Wit et al., 2005), or they may be young clusters that have fully succeeded in clearing out gas and dust from their birth H II regions. In a study of diffuse FUV emission in the interarm regions of M101’s inner disk, Crocker et al. (2015) found that the majority is likely emitted by 10–50 Myr old stellar populations that have drifted from their birthplaces in spiral arms. Because these stars are carried by the disk’s underlying rotation, the difference between the rotation speed and the spiral arm pattern speed determines how far they might travel from a given spiral arm; one might expect stars to remain very close to spiral arms near corotation, for instance.
UV light scattered into our line of sight by dust contributes a sizeable fraction of the diffuse UV as well (upward of 60%; Crocker et al., 2015), but only in the vicinity of spiral arms; in a field adjacent to a spiral arm, Crocker et al. (2015) estimate that the UV flux contributed by scattered light drops by a factor of roughly 1.5 over a distance of 1.5 kpc. This, along with lower dust content, implies that diffuse FUV in M101’s outer disk contains very little scattered light. For example, in the galaxy’s northeast, we find large patches (several kpc on a side) of diffuse FUV located some 5–10 kpc from the nearest spiral arm, and some a similar distance from the nearest H II region. This FUV emission thus appears to be a remnant of a previous episode of star formation, which either formed in-situ or migrated from elsewhere in the disk. The largest such patch (2 kpc in radius, detected at significance in the FUV) has an FUVNUV color of 0.6; in a model of color evolution in integrated populations by Boissier et al. (2008), young populations maintain an FUVNUV color of 0.0 while SF is ongoing, and reach 0.6 roughly 200 Myr after star formation begins to decline (neglecting extinction, although extinction may be safely neglected in outer disks). In the Milky Way, populations of O and B stars have radial velocity dispersions of order 10 km s-1 (Binney & Merrifield, 1998), thus can easily disperse over 2 kpc in radius in 200 Myr. This diffuse FUV-emitting starlight thus likely formed in a localized burst a few hundred Myr ago and is now beginning to fade. We find many other such patches of diffuse FUV throughout M101’s outer disk with similarly red colors (0.4–0.6), implying similar origins.
M101’s disturbed morphology implies that it suffered a recent tidal interaction. From integrated colors in its outer disk, Mihos et al. (2013) proposed that this morphology resulted from a fly-by encounter with its more distant companion NGC 5474 some 300 Myr ago, resulting in a brief and currently fading burst of star formation. After 300 Myr, even the NUV light begins to fade; H emission would thus be scarce, as it is in the diffuse FUV patches discussed above. Follow-up HST imaging of stellar populations in M101’s northeast plume region are consistent with this star formation timeline (Mihos et al. in prep.), providing strong support that star formation in M101’s outer disk was induced by an interaction. This in turn shows that M101’s outer disk does not have a uniform SFH. If NGC 5474 was the culprit in the interaction, it too should have seen a starburst on the same timescale, hence it too should have a non-uniform SFH. The M101 Group hence provides a fairly clear example of an FUV-dominated outer disk resulting from a fading, tidally induced starburst; from this perspective, too, it is not necessary to invoke changes in the IMF to explain the star-forming properties of the M101 Group.
Is this scenario generalizable to other systems? XUV disks are often suggested to be tidal in origin (Gil de Paz et al., 2005; Thilker et al., 2005, 2007), or else are created through gas accretion into the outer disk (Lemonias et al., 2011). Also, the UV emission in XUV disks is typically concentrated in filments reminiscent of spiral structure (Thilker et al., 2007). While outer disks may typically be stable against spiral arm formation, we can consider the longevity of a set of spiral arms induced in an outer disk by a tidal interaction, hence the longevity of XUV disks in general. As a rough estimate, let us assume that spiral arms in outer disks are not self-sustaining due to high disk stability (e.g. Kennicutt, 1989) and so lose their coherency over one dynamical time; in M101 at 16 kpc (roughly where we demarcate its outer disk), this is 500 Myr (assuming a rotation speed of 190 km s-1; Meidt et al., 2009). Star formation persists in M101 out to 40 kpc, where a dynamical time is 1.3 Gyr. As such, if galaxies like M101 suffer only one interaction in their lifetimes capable of producing an XUV disk, assuming a total lifetime of 10 Gyr, there would be a 5–13% probability that we would witness it in this state at . A study by Lemonias et al. (2011) found that XUV disks exist in 4–14% of galaxies out to ; if M101 can be considered representative (it is slightly brighter than L∗ in the V-band; de Vaucouleurs et al., 1991), then the average galaxy need suffer only 1–2 interactions capable of producing XUV disks in their lifetimes to explain the frequency of XUV disks in the local universe. Whether or not this is reasonable depends on how specific the parameters of the interactions must be in order to produce an XUV disk (mass ratio, relative inclination, relative velocities, etc.), but this simple argument suggests that all XUV disks may be explainable through tidal interactions with satellites.
Even in purely isolated systems, the global stability of outer disks requires that some manner of perturbation is still necessary to initiate star formation there (e.g. substructure in the dark matter halo; Bush et al., 2010). If star formation in dwarf galaxies results mainly from e.g. supernova feedback (van Zee et al., 1997), some manner of perturbation would be required to initiate it in the first place. This general dependence on external forces, rather than on potentially long-lived, regularly rotating spiral features or bars, implies that star formation in low density environments may always be subject to stochasticity, hence an assumption of constant star formation over Gyr timescales in such environments could be highly suspect. As more and more systems are studied, and as finer and finer resolution SFHs are obtained of these systems, the nature of star formation and the evolution of galaxies should begin to become clear.
6. Summary
We have performed a study of star formation across all environments in the nearby M101 Group—M101’s inner disk, its outer disk, and its two lower mass companions—using both new deep H narrow-band imaging and archival UV data (GALEX NGS and PI data; Bianchi et al., 2003; Bigiel et al., 2010), in order to test whether or not star formation physics (specifically the IMF) changes with environment. We have chosen to study only the H-emitting H II regions in these environments, in order to compare only populations young enough to retain their most massive stars.
We have performed photometry on all H II regions in M101, NGC 5474, and NGC 5477 in order to measure their FFFUV ratios, which should be systematically low in the absence of massive (20–100 ) stars. We find that the median FFFUV ratio across all populations of H II regions in the M101 Group does not vary signficantly, once bulk radial extinction trends are taken into account. In addition to the median, however, we also find that the scatter in FFFUV does not vary significantly with environment. While typical H II region fluxes do decline with radius in M101 and its larger companion NGC 5474, their near constant distribution of FFFUV ratios implies that the populations of ionizing stars even in the fainter outer disk H II regions are being sampled from the same IMF as in the inner disk. The decline in mean H II region flux may thus be attributable primarily to a decline in mean surface gas density alone, rather than any significant change in the cloud-to-cloud physics of star formation.
Using Starburst99 models (Leitherer et al., 1999), we attempted to determine whether or not a truncated IMF was necessary to reproduce the observed distributions of H II regions in any radial bin in M101. We find that, while we are able to qualitatively reproduce these distributions using IMFs truncated at the high mass end (50 ), we are able to just as successfully reproduce the distributions of FFFUV using a standard Kroupa IMF, regardless of the local surface brightness. It therefore appears that, at least when comparing bulk populations, it is unnecessary to invoke changes to the IMF to explain the properties of the H II regions in M101.
Assuming the IMF is universal, we further investigate the origin of trends in integrated FFFUV with surface brightness, SFR, and stellar mass found by other authors (e.g. Thilker et al., 2005; Boselli et al., 2009; Lee et al., 2009; Meurer et al., 2009; Goddard et al., 2010). Because the FFFUV ratios of H II regions do not change throughout the M101 Group, we compare the relative fractions of diffuse H and FUV emission, and find that indeed, diffuse FUV emission with no H counterpart—hence no extremely young, massive stars—is more prevalent in lower surface density regions. This implies that such regions suffered a recent but now fading burst of star formation, hence are not necessarily continuously forming new stars; low integrated FFFUV ratios in these low density regions may thus result from a bursty or otherwise non-uniform SFH. However, we have also shown that using flux-weighted FFFUV or flux-weighted extinction corrections can bias the value of the integrated FFFUV in galaxies, particularly if the bulk of the H or FUV intensity emerges from a small number of bright H II regions. We thus advise caution in future such studies with regard to how integrated FFFUV is measured and corrected for extinction.
Finally, we consider whether or not the M101 Group could be exceptional or whether our results are more broadly applicable. Previous studies have shown that star formation in M101’s outer disk was likely triggered by a tidal interaction several hundred Myr ago (Mihos et al., 2013). This lends credence to the interpretation that the abundant populations of FUV-emitting stars with no H counterpart are remnants of a now fading burst of star formation. Additionally, we have shown that if interaction-induced star formation in outer disks persists over only one dynamical time, it may still be long-lived enough to account for the low frequency (4–14%; Lemonias et al., 2011) of XUV disks observed in the local universe. Therefore, assuming the conditions necessary to create XUV disks through tidal interactions are not oddly specific, it is not unreasonable to consider that all XUV disks may be tidally induced. If so, this would imply that star formation in low density environments only differs from star formation in high density environments in that it requires outside perturbation to be initiated. This implies in turn that star formation at low density is subject to greater stochasticity than star formation at high density; assuming a uniform SFH in the low density regime may be unwise.
7. Acknowledgements
This work has been supported by the National Science Foundation, through award 1108964 to J.C.M., as well as through award 1211144 to P.H. This work made use of Numpy, Scipy (Oliphant, 2007), MatPlotLib (Hunter, 2007), astroML (VanderPlas et al., 2012), and the community-developed core Python package for astronomy, Astropy (Astropy Collaboration et al., 2013). We would like to thank Heather Morrison for many helpful discussions regarding the statistical analyses presented in this work, as well as Stacy McGaugh, Sally Oey, and Daniella Calzetti for helpful discussions about extinction, star formation physics, and star formation tracers. We would also like the thank the anonymous referee for a very thorough and helpful review, which we feel greatly improved this manuscript.
Facilities: CWRU:Schmidt - The Burrell Schmidt of the Warner and Swasey Observatory, Case Western Reserve University; GALEX
References
- (1)
- Aihara et al. (2011) Aihara, H., Allende Prieto, C., An, D., et al. 2011, ApJS, 193, 29
- Alberts et al. (2011) Alberts, S., Calzetti, D., Dong, H., et al. 2011, ApJ, 731, 28
- Astropy Collaboration et al. (2013) Astropy Collaboration, Robitaille, T. P., Tollerud, E. J., et al. 2013, A&A, 558, A33
- Bakos et al. (2008) Bakos, J., Trujillo, I., & Pohlen, M. 2008, ApJ, 683, L103
- Barker et al. (2007) Barker, M. K., Sarajedini, A., Geisler, D., Harding, P., & Schommer, R. 2007, AJ, 133, 1125
- Barnes et al. (2011) Barnes, K. L., van Zee, L., & Skillman, E. D. 2011, ApJ, 743, 137
- Barnes et al. (2013) Barnes, K. L., van Zee, L., & Dowell, J. D. 2013, ApJ, 775, 40
- Beale & Davies (1969) Beale, J. S., & Davies, R. D. 1969, Nature, 221, 531
- Bertin & Arnouts (1996) Bertin, E., & Arnouts, S. 1996, A&AS, 117, 393
- Bianchi et al. (2003) Bianchi, L., Madore, B., Thilker, D., Gil de Paz, A., & GALEX Science Team 2003, Bulletin of the American Astronomical Society, 35, 91.12
- Bigiel et al. (2008) Bigiel, F., Leroy, A., Walter, F., et al. 2008, AJ, 136, 2846
- Bigiel et al. (2010) Bigiel, F., Leroy, A., Walter, F., et al. 2010, AJ, 140, 1194
- Binney & Merrifield (1998) Binney, J., & Merrifield, M. 1998, Galactic astronomy / James Binney and Michael Merrifield. Princeton, NJ : Princeton University Press, 1998. (Princeton series in astrophysics)
- Boissier et al. (2008) Boissier, S., Gil de Paz, A., Boselli, A., et al. 2008, ApJ, 681, 244-257
- Bolatto et al. (2011) Bolatto, A. D., Leroy, A. K., Jameson, K., et al. 2011, ApJ, 741, 12
- Bonnell et al. (2004) Bonnell, I. A., Vine, S. G., & Bate, M. R. 2004, MNRAS, 349, 735
- Boselli et al. (2009) Boselli, A., Boissier, S., Cortese, L., et al. 2009, ApJ, 706, 1527
- Bottema et al. (1987) Bottema, R., Shostak, G. S., & van der Kruit, P. C. 1987, Nature, 328, 401
- Breiman (1973) Breiman, L. 1973, Statistics with a View toward Applications (Houghton Mifflin, Boston)
- Bressan et al. (2012) Bressan, A., Marigo, P., Girardi, L., et al. 2012, MNRAS, 427, 127
- Brown et al. (1994) Brown, A. G. A., de Geus, E. J., & de Zeeuw, P. T. 1994, A&A, 289, 101
- Brown & Forsythe (1974) Brown, B. W., & Forsythe, A. B. 1974, Robust tests for equality of variances, J. Amer. Statist. Assoc., 69, 364
- Bruzzese et al. (2015) Bruzzese, S. M., Meurer, G. R., Lagos, C. D. P., et al. 2015, MNRAS, 447, 618
- Burkholder et al. (2001) Burkholder, V., Impey, C., & Sprayberry, D. 2001, AJ, 122, 2318
- Bush et al. (2010) Bush, S. J., Cox, T. J., Hayward, C. C., et al. 2010, ApJ, 713, 780
- Calzetti et al. (2005) Calzetti, D., Kennicutt, R. C., Jr., Bianchi, L., et al. 2005, ApJ, 633, 871
- Calzetti (2001) Calzetti, D. 2001, PASP, 113, 1449
- Cortese et al. (2006) Cortese, L., Boselli, A., Buat, V., et al. 2006, ApJ, 637, 242
- Courtes & Cruvellier (1961) Courtes, G., & Cruvellier, P. 1961, Publications of the Observatoire Haute-Provence, 5
- Crocker et al. (2015) Crocker, A. F., Chandar, R., Calzetti, D., et al. 2015, ApJ, 808, 76
- Croxall et al. (2016) Croxall, K. V., Pogge, R. W., Berg, D. A., Skillman, E. D., & Moustakas, J. 2016, ApJ, 830, 4
- da Silva et al. (2014) da Silva, R. L., Fumagalli, M., & Krumholz, M. R. 2014, MNRAS, 444, 3275
- Davidge (2003) Davidge, T. J. 2003, AJ, 125, 3046
- Davidge (2010) Davidge, T. J. 2010, ApJ, 718, 1428
- de Vaucouleurs et al. (1991) de Vaucouleurs, G., de Vaucouleurs, A., Corwin, H. G. Jr., Buta, R. J., Paturel, G., & Fouqué, P. 1991, Third Reference Catalogue of Bright Galaxies (Springer(New York))
- de Wit et al. (2005) de Wit, W. J., Testi, L., Palla, F., & Zinnecker, H. 2005, A&A, 437, 247
- Debattista et al. (2006) Debattista, V. P., Mayer, L., Carollo, C. M., et al. 2006, ApJ, 645, 209
- Donas et al. (1987) Donas, J., Deharveng, J. M., Laget, M., Milliard, B., & Huguenin, D. 1987, A&A, 180, 12
- Dopita & Sutherland (2003) Dopita, M. A., & Sutherland, R. S. 2003, Astrophysics of the diffuse universe, Berlin, New York: Springer, 2003
- Dyson & Williams (1980) Dyson, J. E., & Williams, D. A. 1980, New York, Halsted Press, 1980. 204 p.
- Elmegreen & Hunter (2015) Elmegreen, B. G., & Hunter, D. A. 2015, ApJ, 805, 145
- Ferguson et al. (1996) Ferguson, A. M. N., Wyse, R. F. G., Gallagher, J. S., III, & Hunter, D. A. 1996, AJ, 111, 2265
- Ferguson et al. (1998) Ferguson, A. M. N., Gallagher, J. S., & Wyse, R. F. G. 1998, AJ, 116, 673
- Finlator et al. (2000) Finlator, K., Ivezić, Ž., Fan, X., et al. 2000, AJ, 120, 2615
- García-Ruiz et al. (2002) García-Ruiz, I., Sancisi, R., & Kuijken, K. 2002, A&A, 394, 769
- Garcia-Segura & Franco (1996) Garcia-Segura, G., & Franco, J. 1996, ApJ, 469, 171
- Gies (1987) Gies, D. R. 1987, ApJS, 64, 545
- Gil de Paz et al. (2005) Gil de Paz, A., Madore, B. F., Boissier, S., et al. 2005, ApJ, 627, L29
- Goddard et al. (2010) Goddard, Q. E., Kennicutt, R. C., & Ryan-Weber, E. V. 2010, MNRAS, 405, 2791
- Greenawalt et al. (1998) Greenawalt, B., Walterbos, R. A. M., Thilker, D., & Hoopes, C. G. 1998, ApJ, 506, 135
- Gunawardhana et al. (2011) Gunawardhana, M. L. P., Hopkins, A. M., Sharp, R. G., et al. 2011, MNRAS, 415, 1647
- Haffner et al. (1999) Haffner, L. M., Reynolds, R. J., & Tufte, S. L. 1999, ApJ, 523, 223
- Haffner et al. (2009) Haffner, L. M., Dettmar, R.-J., Beckman, J. E., et al. 2009, Reviews of Modern Physics, 81, 969
- Heckman et al. (1995) Heckman, T., Krolik, J., Meurer, G., et al. 1995, ApJ, 452, 549
- Helmboldt et al. (2005) Helmboldt, J. F., Walterbos, R. A. M., Bothun, G. D., & O’Neil, K. 2005, ApJ, 630, 824
- Helmboldt et al. (2009) Helmboldt, J. F., Walterbos, R. A. M., Bothun, G. D., O’Neil, K., & Oey, M. S. 2009, MNRAS, 393, 478
- Hermanowicz et al. (2013) Hermanowicz, M. T., Kennicutt, R. C., & Eldridge, J. J. 2013, MNRAS, 432, 3097
- Hoopes et al. (1996) Hoopes, C. G., Walterbos, R. A. M., & Greenwalt, B. E. 1996, AJ, 112, 1429
- Hoopes et al. (1999) Hoopes, C. G., Walterbos, R. A. M., & Rand, R. J. 1999, ApJ, 522, 669
- Hoopes & Walterbos (2000) Hoopes, C. G., & Walterbos, R. A. M. 2000, ApJ, 541, 597
- Hoopes et al. (2001) Hoopes, C. G., Walterbos, R. A. M., & Bothun, G. D. 2001, ApJ, 559, 878
- Hoversten & Glazebrook (2008) Hoversten, E. A., & Glazebrook, K. 2008, ApJ, 675, 163-187
- Huber (1981) Huber, P. J. 1981, Robust Statistics (Wiley, New York)
- Hunter & Gallagher (1986) Hunter, D. A., & Gallagher, J. S., III 1986, PASP, 98, 5
- Hunter & Plummer (1996) Hunter, D. A., & Plummer, J. D. 1996, ApJ, 462, 732
- Hunter et al. (2003) Hunter, D. A., Elmegreen, B. G., Dupuy, T. J., & Mortonson, M. 2003, AJ, 126, 1836
- Hunter et al. (2010) Hunter, D. A., Elmegreen, B. G., & Ludka, B. C. 2010, AJ, 139, 447
- Hunter et al. (2011) Hunter, D. A., Elmegreen, B. G., Oh, S.-H., et al. 2011, AJ, 142, 121
- Hunter (2007) Hunter, J. D. 2007, Computing in Science & Engineering, 9, 90
- Kellar et al. (2012) Kellar, J. A., Salzer, J. J., Wegner, G., Gronwall, C., & Williams, A. 2012, AJ, 143, 145
- Kenney et al. (1991) Kenney, J. D. P., Scoville, N. Z., & Wilson, C. D. 1991, ApJ, 366, 432
- Kennicutt (1983) Kennicutt, R. C., Jr. 1983, ApJ, 272, 54
- Kennicutt (1989) Kennicutt, R. C., Jr. 1989, ApJ, 344, 685
- Kennicutt et al. (1994) Kennicutt, R. C., Jr., Tamblyn, P., & Congdon, C. E. 1994, ApJ, 435, 22
- Kennicutt (1998) Kennicutt, R. C., Jr. 1998, ApJ, 498, 541
- Kennicutt et al. (2007) Kennicutt, R. C., Jr., Calzetti, D., Walter, F., et al. 2007, ApJ, 671, 333
- Kennicutt et al. (2008) Kennicutt, R. C., Jr., Lee, J. C., Funes, J. G., et al. 2008, ApJS, 178, 247-279
- Kennicutt & Evans (2012) Kennicutt, R. C., & Evans, N. J. 2012, ARA&A, 50, 531
- Kornreich et al. (1998) Kornreich, D. A., Haynes, M. P., & Lovelace, R. V. E. 1998, AJ, 116, 2154
- Koyama et al. (2015) Koyama, Y., Kodama, T., Hayashi, M., et al. 2015, MNRAS, 453, 879
- Kroupa (2001) Kroupa, P. 2001, MNRAS, 322, 231
- Lada & Lada (2003) Lada, C. J., & Lada, E. A. 2003, ARA&A, 41, 57
- Laine et al. (2016) Laine, J., Laurikainen, E., & Salo, H. 2016, A&A, 596, A25
- Lamb et al. (2010) Lamb, J. B., Oey, M. S., Werk, J. K., & Ingleby, L. D. 2010, ApJ, 725, 1886
- Larson (1973) Larson, R. B. 1973, MNRAS, 161, 133
- Lee et al. (2009) Lee, J. C., Gil de Paz, A., Tremonti, C., et al. 2009, ApJ, 706, 599-613
- Lee et al. (2011) Lee, J. C., Gil de Paz, A., Kennicutt, R. C., Jr., et al. 2011, ApJS, 192, 6
- Leitherer et al. (1999) Leitherer, C., Schaerer, D., Goldader, J. D., et al. 1999, ApJS, 123, 3
- Lemonias et al. (2011) Lemonias, J. J., Schiminovich, D., Thilker, D., et al. 2011, ApJ, 733, 74
- Leroy et al. (2012) Leroy, A. K., Bigiel, F., de Blok, W. J. G., et al. 2012, AJ, 144, 3
- Levene (1960) Levene, H. 1960, Robust tests for equality of variances. In Contributions to Probability and Statistics (I. Olkin, ed.) 278-292, Stanford Univ. Press, Palo Alto, CA
- Lim & Loh (1996) Lim, T. S., & Loh, W. Y. 1996, Computational Statistics & Data Analysis, 22, 287
- Madsen et al. (2006) Madsen, G. J., Reynolds, R. J., & Haffner, L. M. 2006, ApJ, 652, 401
- Martin & Kennicutt (2001) Martin, C. L., & Kennicutt, R. C., Jr. 2001, ApJ, 555, 301
- Massey & Foltz (2000) Massey, P., & Foltz, C. B. 2000, PASP, 112, 566
- Massey et al. (1988) Massey, P., Strobel, K., Barnes, J. V., & Anderson, E. 1988, ApJ, 328, 315
- McGaugh & Bothun (1994) McGaugh, S. S., & Bothun, G. D. 1994, AJ, 107, 530
- McGaugh & de Blok (1997) McGaugh, S. S., & de Blok, W. J. G. 1997, ApJ, 481, 689
- Meidt et al. (2009) Meidt, S. E., Rand, R. J., & Merrifield, M. R. 2009, ApJ, 702, 277
- Meurer et al. (1995) Meurer, G. R., Heckman, T. M., Leitherer, C., et al. 1995, AJ, 110, 2665
- Meurer et al. (1999) Meurer, G. R., Heckman, T. M., & Calzetti, D. 1999, ApJ, 521, 64
- Meurer et al. (2009) Meurer, G. R., Wong, O. I., Kim, J. H., et al. 2009, ApJ, 695, 765
- Meurer (2017) Meurer, G. R. 2017, Formation and Evolution of Galaxy Outskirts, 321, 172
- Mihos et al. (2012) Mihos, J. C., Keating, K. M., Holley-Bockelmann, K., Pisano, D. J., & Kassim, N. E. 2012, ApJ, 761, 186
- Mihos et al. (2013) Mihos, J. C., Harding, P., Spengler, C. E., Rudick, C. S., & Feldmeier, J. J. 2013, ApJ, 762, 82
- Mihos et al. (2017) Mihos, J. C., Harding, P., Feldmeier, J. J., et al. 2017, ApJ, 834, 16
- Minchev et al. (2011) Minchev, I., Famaey, B., Combes, F., et al. 2011, A&A, 527, A147
- Moffat et al. (1998) Moffat, A. F. J., Marchenko, S. V., Seggewiss, W., et al. 1998, A&A, 331, 949
- Morrison et al. (1990) Morrison, H. L., Flynn, C., & Freeman, K. C. 1990, AJ, 100, 1191
- Morrissey et al. (2007) Morrissey, P., Conrow, T., Barlow, T. A., et al. 2007, ApJS, 173, 682
- Oey et al. (2013) Oey, M. S., Lamb, J. B., Kushner, C. T., Pellegrini, E. W., & Graus, A. S. 2013, ApJ, 768, 66
- Oliphant (2007) Oliphant, T. E. 2007, Computing in Science & Engineering, 9, 10
- Pflamm-Altenburg & Kroupa (2008) Pflamm-Altenburg, J., & Kroupa, P. 2008, Nature, 455, 641
- Pflamm-Altenburg et al. (2009) Pflamm-Altenburg, J., Weidner, C., & Kroupa, P. 2009, MNRAS, 395, 394
- Pflamm-Altenburg et al. (2013) Pflamm-Altenburg, J., González-Lópezlira, R. A., & Kroupa, P. 2013, MNRAS, 435, 2604
- Pilyugin et al. (2014) Pilyugin, L. S., Grebel, E. K., & Kniazev, A. Y. 2014, AJ, 147, 131
- Quireza et al. (2006) Quireza, C., Rood, R. T., Bania, T. M., Balser, D. S., & Maciel, W. J. 2006, ApJ, 653, 1226
- Rand (1996) Rand, R. J. 1996, ApJ, 462, 712
- Rand (1997) Rand, R. J. 1997, ApJ, 474, 129
- Relaño et al. (2012) Relaño, M., Kennicutt, R. C., Jr., Eldridge, J. J., Lee, J. C., & Verley, S. 2012, MNRAS, 423, 2933
- Reynolds et al. (1977) Reynolds, R. J., Roesler, F. L., & Scherb, F. 1977, ApJ, 211, 115
- Reynolds (1985) Reynolds, R. J. 1985, ApJ, 298, L27
- Reynolds (1990) Reynolds, R. J. 1990, The Galactic and Extragalactic Background Radiation, 139, 157
- Roškar et al. (2008) Roškar, R., Debattista, V. P., Quinn, T. R., Stinson, G. S., & Wadsley, J. 2008, ApJ, 684, L79
- Roškar et al. (2012) Roškar, R., Debattista, V. P., Quinn, T. R., & Wadsley, J. 2012, MNRAS, 426, 2089
- Rownd et al. (1994) Rownd, B. K., Dickey, J. M., & Helou, G. 1994, AJ, 108, 1638
- Rudick et al. (2010) Rudick, C. S., Mihos, J. C., Harding, P., et al. 2010, ApJ, 720, 569
- Sánchez-Blázquez et al. (2009) Sánchez-Blázquez, P., Courty, S., Gibson, B. K., & Brook, C. B. 2009, MNRAS, 398, 591
- Sancisi (1976) Sancisi, R. 1976, A&A, 53, 159
- Schlafly & Finkbeiner (2011) Schlafly, E. F., & Finkbeiner, D. P. 2011, ApJ, 737, 103
- Schlegel et al. (1998) Schlegel, D. J., Finkbeiner, D. P., & Davis, M. 1998, ApJ, 500, 525
- Schmidt (1959) Schmidt, M. 1959, ApJ, 129, 243
- Schombert et al. (2013) Schombert, J., McGaugh, S., & Maciel, T. 2013, AJ, 146, 41
- Schönrich & Binney (2009) Schönrich, R., & Binney, J. 2009, MNRAS, 399, 1145
- Schruba et al. (2011) Schruba, A., Leroy, A. K., Walter, F., et al. 2011, AJ, 142, 37
- Scowen et al. (1992) Scowen, P. A., Dufour, R. J., & Hester, J. J. 1992, AJ, 104, 92
- Seibert et al. (2005) Seibert, M., Martin, D. C., Heckman, T. M., et al. 2005, ApJ, 619, L55
- Sellwood & Binney (2002) Sellwood, J. A., & Binney, J. J. 2002, MNRAS, 336, 785
- Silk & Werner (1969) Silk, J., & Werner, M. W. 1969, ApJ, 158, 185
- Skillman (1987) Skillman, E. D. 1987, NASA Conference Publication, 2466
- Slater et al. (2009) Slater, C. T., Harding, P., & Mihos, J. C. 2009, PASP, 121, 1267
- Spitzer & Jenkins (1975) Spitzer, L., Jr., & Jenkins, E. B. 1975, ARA&A, 13, 133
- Spitzer & Tomasko (1968) Spitzer, L., Jr., & Tomasko, M. G. 1968, ApJ, 152, 971
- Sullivan et al. (2004) Sullivan, M., Treyer, M. A., Ellis, R. S., & Mobasher, B. 2004, MNRAS, 350, 21
- Thilker et al. (2002) Thilker, D. A., Walterbos, R. A. M., Braun, R., & Hoopes, C. G. 2002, AJ, 124, 3118
- Thilker et al. (2005) Thilker, D. A., Bianchi, L., Boissier, S., et al. 2005, ApJ, 619, L79
- Thilker et al. (2007) Thilker, D. A., Bianchi, L., Meurer, G., et al. 2007, ApJS, 173, 538
- Toomre (1964) Toomre, A. 1964, ApJ, 139, 1217
- Torres-Peimbert et al. (1974) Torres-Peimbert, S., Lazcano-Araujo, A., & Peimbert, M. 1974, ApJ, 191, 401
- van der Hulst & Huchtmeier (1979) van der Hulst, J. M., & Huchtmeier, W. K. 1979, A&A, 78, 82
- van der Hulst et al. (1987) van der Hulst, J. M., Skillman, E. D., Kennicutt, R. C., & Bothun, G. D. 1987, A&A, 177, 63
- van der Hulst et al. (2001) van der Hulst, J. M., van Albada, T. S., & Sancisi, R. 2001, ASP Conf. Ser. 240, Gas and Galaxy Evolution, ed. J.E. Hibbard, M. Rupen, & J.H. van Gorkum (San Francisco, CA: ASP), 451
- van der Kruit (1987) van der Kruit, P. C. 1987, A&A, 173, 59
- VanderPlas et al. (2012) VanderPlas, J., Connolly, A. J., Ivezic, Z., & Gray, A. 2012, Proceedings of Conference on Intelligent Data Understanding (CIDU), pp. 47-54, 2012., 47
- Vandervoort (1970) Vandervoort, P. O. 1970, ApJ, 161, 87
- van Eymeren et al. (2011) van Eymeren, J., Jütte, E., Jog, C. J., Stein, Y., & Dettmar, R.-J. 2011, A&A, 530, A30
- van Zee et al. (1997) van Zee, L., Haynes, M. P., Salzer, J. J., & Broeils, A. H. 1997, AJ, 113, 1618
- Vlajić et al. (2009) Vlajić, M., Bland-Hawthorn, J., & Freeman, K. C. 2009, ApJ, 697, 361
- Vlajić et al. (2011) Vlajić, M., Bland-Hawthorn, J., & Freeman, K. C. 2011, ApJ, 732, 7
- Vogel et al. (1995) Vogel, S. N., Weymann, R., Rauch, M., & Hamilton, T. 1995, ApJ, 441, 162
- Waller et al. (1997) Waller, W. H., Bohlin, R. C., Cornett, R. H., et al. 1997, ApJ, 481, 169
- Walter et al. (2008) Walter, F., Brinks, E., de Blok, W. J. G., et al. 2008, AJ, 136, 2563-2647
- Walterbos & Braun (1994) Walterbos, R. A. M., & Braun, R. 1994, ApJ, 431, 156
- Watkins et al. (2014) Watkins, A. E., Mihos, J. C., Harding, P., & Feldmeier, J. J. 2014, ApJ, 791, 38
- Watkins et al. (2016) Watkins, A. E., Mihos, J. C., & Harding, P. 2016, ApJ, 826, 59
- Weidner et al. (2004) Weidner, C., Kroupa, P., & Larsen, S. S. 2004, MNRAS, 350, 1503
- Weisz et al. (2012) Weisz, D. R., Johnson, B. D., Johnson, L. C., et al. 2012, ApJ, 744, 44
- Whitmore et al. (2011) Whitmore, B. C., Chandar, R., Kim, H., et al. 2011, ApJ, 729, 78
- Wood & Reynolds (1999) Wood, K., & Reynolds, R. J. 1999, ApJ, 525, 799
- Zaritsky & Christlein (2007) Zaritsky, D., & Christlein, D. 2007, AJ, 134, 135
- Zasov & Simakov (1988) Zasov, A. V., & Simakov, S. G. 1988, Astrophysics, 29, 518
- Zheng et al. (2015) Zheng, Z., Thilker, D. A., Heckman, T. M., et al. 2015, ApJ, 800, 120
- Zurita et al. (2002) Zurita, A., Beckman, J. E., Rozas, M., & Ryder, S. 2002, A&A, 386, 801