Laboratoire de Physique Théorique de la Matière Condensée, CNRS UMR - Université Pierre et Marie Curie, Place Jussieu, Paris Cedex , France
MOLTECH-Anjou, CNRS UMR - Université d’Angers, Bâtiment K, Angers Cedex, France
RIKEN, Hirosawa -, Wako, Saitama -, Japan
Institute for Molecular Science, Okazaki, Aichi -, Japan
Department of Physics, Toho University, Miyama --, Funabashi, Chiba -, Japan
Magnetotransport phenomena, materials for magnetotransport Quantum Hall effects, magnetoresistance Polymers, organic compounds (including organic semiconductors)
Aperiodic quantum oscillations of particle-hole asymmetric Dirac cones
Abstract
We report experimental measurements and theoretical analysis of Shubnikov–de Haas (SdH) oscillations in a Dirac cone system: the -(BEDT-TTF)2I3 organic metal under hydrostatic pressure. The measured SdH oscillations reveal anomalies at high magnetic fields where the oscillations periodicity is lost above . We interpret these unusual results within a theoretical model that takes into account intrinsic distortions of the -(BEDT-TTF)2I3 Dirac cones such as a parabolic particle-hole asymmetric correction. Others possible causes, such as a cone tilting or a Zeeman effect, are carefully ruled out. The observations are consistent among -(BEDT-TTF)2I3 samples with different Fermi levels.
pacs:
75.47.-mpacs:
73.43.Qtpacs:
72.80.Le1 Introduction
The isolation of graphene in 2004 [1, 2] opened a new field of research for condensed matter physicists, called Dirac physics that continues to fascinate today. Belonging to the family of the first synthesized quasi D organic conductors, the -(BEDT-TTF)2I3 (I3) material, which consists of an alternation of insulating planes (iodine planes) and conductive planes (BEDT-TTF planes), has been known and studied since the 1980’s [3, 4, 5, 6, 7]. However, a renewed interest in this salt has followed the highlighting of Dirac charge carriers emerging under hydrostatic pressure [8]. Indeed, band-structure calculations and magnetotransport experiments have revealed the presence of Dirac fermions under high pressure () in I3. However, Dirac physics in I3 differs from that in graphene by several aspects. First of all, the Dirac cones in I3 are tilted leading to a renormalization of the cone velocity, which is one order of magnitude smaller than in graphene [8, 9, 10, 11], due also to a larger lattice spacing. Then, contrary to the case of graphene, its three-dimensional layered structure renders an experimental control in I3 of the homogenous Fermi level, e.g. by the application of a gate voltage, extremely difficult. Finally, in terms of charge carriers, the I3 physical properties are more complicated than in graphene due to a coexistence between Dirac and massive fermions in the vicinity of the Fermi level. This coexistence of different carrier types, theoretically predicted by ab initio band-structure calculations [12], has recently been verified experimentally by electronic transport measurements, performed in the classical regime [13, 14].
In this paper, we present magnetotransport measurements of two types of I3 crystals under high hydrostatic pressure (), that is in the presence of Dirac fermions, and in the quantum regime. At low magnetic fields, we observe typical SdH oscillations in the I3 magnetoresistance, as already reported in the literature [15]. Beyond this standard behavior of the SdH oscillations, we show that, at higher magnetic fields (), these measured quantum oscillations become unusual with a deviation from their periodicity. This means that the usual Landau plot (i.e. the index of minima in the magnetoresistance as a function of ) is no longer linear in the high field limit. This kind of particular behavior has very recently been seen for surface states of 3D topological insulator samples [16, 17, 18]. However, here we show that the effect is much stronger in I3 than in topological insulators.
The remainder of the paper is organized as follows. In the first part, we present the experimental setup and the results of the magnetotransport measurements, performed in the quantum regime. In the second part, in order to interpret these particular experimental results, we develop a theoretical model based on the specificity of the I3 band structure.
2 Experimental transport measurements in the quantum regime
Single crystals of I3 were synthesized by electrocrystallisation. In this study, two kinds of sample have been measured: a thick crystal (sample A) and thin crystals fixed onto a polyethylene naphthalate (PEN) substrate (samples B). Their typical size is in the (a-b) plane with a thickness (c direction) of and for the samples A and B, respectively. The temperature has been controled by means of a dilution fridge. The magnetoresistance (longitudinal signal) and the Hall resistance (transverse signal) have been measured under a magnetic field oriented along the c direction, perpendicular to the I3 conductive planes. The magnetic field was swept between to , at fixed temperature around and under high hydrostatic pressure between and . The resistance measurements have been performed simultaneously, using a low-frequency ac lock-in technique, with different types of contacts geometry. For the sample A, we used six gold contacts deposited by Joule evaporation on both sides of the sample and, for the samples B, a Hall cross with eight electrical contacts. The insets of Fig. 1 show the images of the measured sample A and one measured sample B. The hydrostatic pressure was applied at room temperature in a NiCrAl clamp cell using Daphne silicone oil as pressure-transmitting medium and was determined at room temperature by a manganine resistance gauge in the pressure cell, close to the sample.
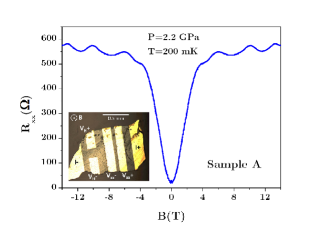
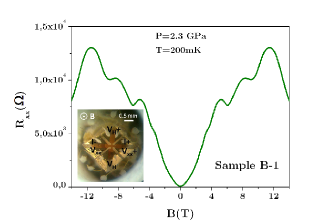
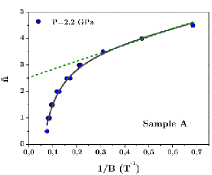
Typical results of the magnetotransport measurements in the quantum regime are presented in Fig. 1. To correct the alignment mismatch of the patterned contacts, the longitudinal resistance has been symmetrized with respect to the magnetic field . We observe clearly the appearance of quantum oscillations on the classical parabolic contribution of the I3 magnetoresistance (see Fig. 1). Are these measured quantum oscillations periodic, as usual SdH oscillations? Are Dirac carriers at the origin of these oscillations? To answer these two questions, our analysis is based on the study of the magnetoresistance signal and is similar to the one presented in reference [15]. We plotted the index of the oscillations peaks (integer for the minima and half-integer for the maxima) as a function of the inverse of their magnetic field position and we obtained the Landau plots, for both I3 crystal types, presented in Fig. 2.
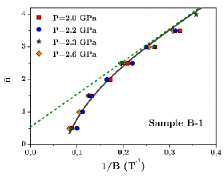
In the range of the studied pressure, the effect of the latter is negligible (see Fig. 2, bottom).
At low magnetic fields, the data points are aligned on the Landau plots, and the measured quantum oscillations are thus indeed -periodic SdH oscillations. Using the usual associated theory [19], the main harmonic of the oscillating part of the magnetoresistance can be written as
| (1) |
where is the magnetic frequency of the oscillations and is the phase offset associated with the Berry phase, which is for massive fermions and for Dirac fermions [20, 2]. Notice furthermore that is not necessarily quantized and can take a continuous value between and in the case of more complex band structures [18, 21]. With the previous choice for the index of the oscillations peaks, the intercept of the Landau plot indicates directly the phase offset (). The linear extrapolations of our data in the low magnetic field region of the Landau plots give a half-integer , namely a Berry phase equal to , for both measured I3 crystal types. So, Dirac fermions are involved in the measured quantum oscillations in agreement with the previous reported results [15]. Moreover, the magnetic frequency – the slope of the linear fit – is equal to and to for sample A and the B-type samples, respectively. Also, this magnetic frequency is an intrinsic signature of the charge carriers density, . Indeed, these two quantities are related by the following mathematical expression: , where is the flux quantum and the numerical factor comes from the four-fold valley and spin degeneracy. By applying this formula, we find for sample A, which corresponds to a value well within previous experimental studies of undoped thick crystals [5, 13] and doped thin crystals [15]. Meanwhile, for the B type samples, we find in agreement with the ref. [15].
The most salient feature in our magnetotransport data in Fig. 2 is the deviation from the linear behavior at high magnetic fields ( T), where the SdH oscillations are no longer -periodic. The theoretical explanation of this deviation is the object of the following section.
3 Theoretical interpretation of the measured SdH oscillations
Several theoretical explanations can be invoked to explain the loss of periodicity at high magnetic fields. First, we could think of identifying a magnetic frequency to a given charge carrier type depending on , similarly, for example, to a recent analysis of SdH oscillations measured in some topological insulator samples [22]. In the I3 case, we would have then a first magnetic frequency due to the Dirac carriers and a second one due to the massive carriers. We can dismiss this hypothesis because the smooth change of periodicity that we have measured (see Fig. 2) is not compatible with the appearance of a second charge carriers type involved in the oscillations at a precise magnetic field value.
Secondly, we could envision a modification of the periodicity due to a cone tilting effect. Previous theoretical works showed that taking into account only the I3 Dirac cone tilt gives the same Landau levels structure as in the graphene case with a mere renormalization of the cone velocity [, where is the dimensionless tilt parameter of typical value in the range of 111The precise value for the tilt parameter is yet under debate and, to the best of our knowledge, has not been clearly determined.] [9, 10, 11]. This means that the cone tilting alone preserves the periodicity of the quantum oscillations for any field values and does not allow one to explain the experimental results.
In a third scenario, we could consider a Zeeman effet. In a first approximation, in I3, this effet is negligible as the -factor is close to [23] (see also part of the supplementary material). Moreover, theoretical calculations show that the effect of taking into account this Zeeman contribution leads to a correction of the Landau plot which has the opposite curvature compared to measurements (for more calculation details, see the supplementary material, part ). This third hypothesis is therefore not satisfactory either.
The experimental results described above indicate that it is a behavior proper to the band structure of I3 which was probed at high magnetic fields. Indeed, in two different I3 crystal types, one thick (sample A) and the others thin ones fixed onto a PEN substrate (samples B), the same qualitative deviation from the usual SdH theory appears. The origin of this unusual behavior resides then in the intrinsic properties of the I3: contrary to the case of an ideal linear cone, the Dirac cone is distorted in the I3 band structure under pressure [12]. In order to investigate the role of the particular band structure of I3 on its quantum oscillations and a possible deviation from their periodicity, let us consider the following Hamiltonian (for a given valley and spin projection):
| (2) |
where [24] is directly the renormalized cone velocity and is the gauge-invariant kinetic momentum. For simplicity, we neglect here the explicit role of the Dirac cone tilt and absorb it into the renormalized velocity.
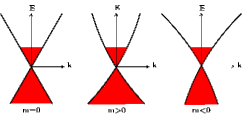
The first term of Eq. (2), which describes the usual Dirac carriers such as in graphene, is completed by a curvature term which formalizes the distortion of the I3 Dirac cone. The mass parameter of this curvature term can be positive or negative, depending on the curvature concavity as presented in Fig. 3. Note that this Hamiltonian breaks particle-hole symmetry, in agreement with previous published results [25, 26] [the possibility of a term in our phenomenological model, which preserves particle-hole symmetry, has been ruled out because it gives a curvature of the Landau plot with a wrong concavity as compared to the experimental results – see part of the supplementary material]. Hamiltonian (2) was also used to describe graphene in [27] and is very close to the Rashba model [28]. Here, we only consider the inner – and neglect the outer – Fermi surface, as done for surface states of 3D topological insulators and contrary to the Rashba model, see discussion and Fig. 2 in [18].
From Eq. (2), the Landau levels can readily be calculated [21, 27, 28, 29]
| (3) |
where , and the Landau level index is a positive integer such as (for , independently of the valley, see part of the supplementary material for more details). The positive part of Eq. (3) corresponds to the conduction-band contribution and, the negative part, to that of the valence band. We remind that the maxima of both the magnetoconductance and the magnetoresistance correspond to half-filled Landau levels, i.e to peaks in the density of states[20, 30]. They appear when , where is the Fermi energy. So, we have the following relation between the usual experimental and theoretical Landau level index convention: .
By inverting Eq. (3), the index is rewritten as a function of the Fermi energy and the magnetic field . In the case of the I3, the energy parameter is fixed during the crystals growth and can be positive or negative, depending on the natural doping induced by the samples fabrication methods. The Landau level index is then only a function of the magnetic field :
| (4) |
with .
Finally, knowing that the parabolic distortion term of the Hamiltonian (2) is a correction compared to the Dirac cone term, we performed an expansion in powers of (i.e. at small ) of Eq. (4) and we obtained an approximate expression of the Landau level index as a function of the magnetic field , with two fitting parameters and :
| (5) |
with
| (6) |
The first term of Eq. (5) is the magnetic frequency responsible for the usual SdH theory dependence on , while the second term is the curvature which represents the deviation from this dependence, and therefore the periodicity. Notice furthermore that the constant, -field independent, offset (proportional to ) is here, in agreement with Dirac carriers.
We applied this phenomenological model to our magnetotransport measurements and the result of the fit is presented in Fig. 2 for both measured I3 crystal types. There is a good agreement between the theoretical fit and the experimental data (see Fig. 2), moreover the obtained value is in agreement with the low-field linear slope. In Table 1 are listed the quantities , and deduced from the two fitting parameters. The mass parameter , which describes the intrinsic distortion of the I3 Dirac cone is well found to be roughly the same (within the fitting uncertainty) for both types of I3 samples (see Table 1) by choosing (for details of the fitting, see the supplementary material, part ). Then, and have the same sign and the nature of the doping (hole or electron doping) is also the same for both measured I3 crystal types. The Fermi temperature in the case of the samples B is higher than that of the sample A, which indicates a more important doping in the B-type samples. This is a consequence of the PEN substrate as had been stated elsewhere[15].
| Quantity | Sample A | Samples B |
|---|---|---|
4 Conclusion
To conclude, we presented I3 magnetotransport measurements performed on two different sample types, in the quantum regime and under high hydrostatic pressure. We mesured quantum SdH oscillations in the I3 magnetoresistance and unveil an unusual behavior under high magnetic fields with a loss of the characteristic periodicity above . We show, within a theoretical model that takes into account deviations from the linear shape of the I3 Dirac cones, that this anomaly can be attributed to a parabolic band correction breaking particle-hole symmetry. For both measured I3 sample types, there is a good agreement between the experimental data and the theoretical fit, which gives reasonable and consistent fit parameters. Indeed, we find a curvature parameter independent (within the fitting uncertainty) from the measured I3 sample type with different Fermi levels. The proposed interpretation then provides a suitable background to understand these unusual experimental results. We can also note that the distortion of the band structure Dirac cones is at quite low energies which would be a challenge for an independent comparison with ab initio band-structure calculations.
Acknowledgements.
We acknowledge G. Montambaux, A. Murani, F. Piéchon, S. Tchoumakov and L. Veyrat for fruitful discussions. This work was partly supported by Grants-in-Aid for Scientific Research (No., No.H and No.H) from the Ministry of Education, Culture, Sports, Science and Technology, Japan and Nanotechnology Platform Program (Molecule and Material Synthesis) of the Ministry od Education, Culture, Sports, Science and Technology (MEXT), Japan.References
- [1] \NameNovoselov K. S., Geim A. K., Morosov S. V., Jiang D., Katsnelson M.I., Grigorieva I. V., Dubonos S. V. Firsov A. A. \REVIEWNature (London)4382005197.
- [2] \NameZhang Y., Tan Y. W., Stormer H. Kim P. \REVIEWNature (London)4382005201.
- [3] \NameMishima T., Ojiro T., Kajita K., Nishio Y. Iye Y. \REVIEWSynth. Met.701995771.
- [4] \NameTajima N., Tamura M., Nishio Y., Kajita K. Iye Y. \REVIEWJ. Phys. Soc. Jpn.692000543.
- [5] \NameTajima N., Sugawara S., Nishio Y., Kajita K. \REVIEWJ. Phys. Soc. Jpn.752006051010.
- [6] \NameTajima N., Sugawara S., Kato R., Nishio Y., Kajita K. \REVIEWPhys. Rev. Lett.1022009176403.
- [7] \NameKino H.Miyazaki T. \REVIEWJ. Phys. Soc. Jpn.752006034704.
- [8] \NameKobayashi A., Katayama S., Suzumura Y., Fukuyama H. \REVIEWJ. Phys. Soc. Jpn.762007034711.
- [9] \NameGoerbig M. O., Fuchs J. N., Montambaux G., Piéchon F. \REVIEWPhys. Rev. B.782008045415.
- [10] \NameGoerbig M. O., Fuchs J. N., Montambaux G., Piéchon F. \REVIEWEurophys. Lett.85200957005.
- [11] \NameProskurin I., Ogata M., Suzumura Y. \REVIEWPhys. Rev. B.912015195413.
- [12] \NameAlemany P., Pouget J. P., Canadell E. \REVIEWPhys. Rev. B.852012195118.
- [13] \NameMonteverde M., Goerbig M. O., Auban-Senzier P., Navarin F., Henck H., Pasquier C. R., Mézière C. Batail P. \REVIEWPhys. Rev. B.872013245110.
- [14] \NameNavarin F., Tisserond E., Auban-Senzier P., Mézière C., Batail P., Pasquier C. Monteverde M. \REVIEWPhysica B.4602014257.
- [15] \NameTajima N., Yamauchi T., Yamaguchi T., Suda M., Kawasugi Y., Yamamoto H. M., Kato R., Nishio Y. Kajita K. \REVIEWPhys. Rev. B.882013075315.
- [16] \NameQu D. X., Hor Y. S., Xiong J., Cava R. J. Ong N. P. \REVIEWScience3292010821.
- [17] \NameRen Z., Taskin A. A., Sasaki S., Segawa K. Ando Y \REVIEWPhys. Rev. B.822010241306.
- [18] \NameWright A. R. McKenzie R. H. \REVIEWPhys. Rev. B.872013085411.
- [19] \NameShoenberg D. \BookMagnetic oscillations in metals \EditorCambridge Monographs on Physics \PublCambridge University Press, New York \Year1984.
- [20] \NameColeridge P. T. Stoner R. \REVIEWPhys. Rev. B.3919891120.
- [21] \NameGoerbig M. O., Montambaux G. Piéchon F. \REVIEWEurophys. Lett.105201457005
- [22] \NameVeyrat L., Iacovella F., Dufouleur J., Nowka C., Funke H., Yang M., Escoffier W., Goiran M., Eichler B., Schmidt O. G., Büchner B., Hampel S. Giraud R. \REVIEWNano Lett.1520157503.
- [23] \NameKinoshita N., Tokumoto M., Anzai H. Saito G. \REVIEWJ. Phys. Soc. Jpn.5419854498.
- [24] \NameTajima N., Sato M., Sugawara S., Kato R., Nishio Y. Kajita K. \REVIEWPhys. Rev. B.822010121420.
- [25] \NameTajima N., Sugawara S., Tamura M., Kato R., Nishio Y. Kajita K. \REVIEWEurophys. Lett.80200747002.
- [26] \NameTajima N., Nishio Y. Kajita K. \REVIEWCrystals22012643.
- [27] \NameSuprunenko Y. F., Gorbar E. V., Loktev V. M. Sharapov S. G. \REVIEWLow Temp. Phys.342008812
- [28] \NameBychkov Yu. A. Rashba E. I. \REVIEWJETP Lett.39198478
- [29] \NameWang Z., Fu Z.-G., Wang S.-X. Zhang P. \REVIEWPhys. Rev. B822010085429
- [30] \NameAndo T. \REVIEWJ. Phys. Soc. Jpn.371974622.