The most ancient spiral galaxy: a 2.6-Gyr-old disk with a tranquil velocity field
Abstract
We report an integral-field spectroscopic (IFS) observation of a gravitationally lensed spiral galaxy A1689B11 at redshift . It is the most ancient spiral galaxy discovered to date and the second kinematically confirmed spiral at . Thanks to gravitational lensing, this is also by far the deepest IFS observation with the highest spatial resolution ( 400 pc) on a spiral galaxy at a cosmic time when the Hubble sequence is about to emerge. After correcting for a lensing magnification of 7.2 0.8, this primitive spiral disk has an intrinsic star formation rate of 22 2 yr-1, a stellar mass of 109.8±0.3 and a half-light radius of kpc, typical of a main-sequence star-forming (SF) galaxy at . However, the H kinematics show a surprisingly tranquil velocity field with an ordered rotation ( = 200 12 km s-1) and uniformly small velocity dispersions ( = 23 4 km s-1and = 15 2 km s-1). The low gas velocity dispersion is similar to local spiral galaxies and is consistent with the classic density wave theory where spiral arms form in dynamically cold and thin disks. We speculate that A1689B11 belongs to a population of rare spiral galaxies at that mark the formation epoch of thin disks. Future observations with JWST will greatly increase the sample of these rare galaxies and unveil the earliest onset of spiral arms.
Subject headings:
cosmology: observations — galaxies: formation — galaxies: evolution — galaxies: high-redshift — galaxies: spiral1. Introduction
One of the most common features of disk galaxies in the local universe is the presence of prominent spiral arms. Among millions of galaxies charted in the local universe, 70% exhibit spiral arms (e.g., Nair & Abraham, 2010; Willett et al., 2013). However, the number density of spiral galaxies decreases dramatically at high redshift (Conselice, 2014; Elmegreen & Elmegreen, 2006). For example, only one spiral galaxy has been spectroscopically confirmed at (Law et al., 2012).
Spiral arms serve important purposes in galaxy formation and evolution: they are sites of star formation and are intimately associated with the formation of the thin and thick disk (Elmegreen, 2011; Conselice, 2014; Martinez-Medina et al., 2015). Spiral arms play an active role in driving the radial and azimuthal mixing of the metals, redistributing angular momentum, and smoothing out small-scale mass distributions (e.g., Sellwood & Binney, 2002; Sellwood, 2014; Grand et al., 2015, 2016). The number and pitch angle of spiral arms are strongly correlated with the mass distribution of the disk and can be a powerful tool to constrain the bulge and black hole masses (Athanassoula et al., 1987; Kennicutt, 1981; Elmegreen & Elmegreen, 1990; Berrier et al., 2013; Dobbs & Baba, 2014; Seigar et al., 2014; Davis et al., 2015, 2017). The onset of spiral structures offers crucial insights into the origin of the Hubble sequence (Driver et al., 1998; Cen, 2014; Genel et al., 2015).
The necessary and sufficient conditions for spiral arm formation remain inconclusive, despite major developments in the 1960s and decades of studies (e.g., Toomre, 1977; Athanassoula, 1984; Sellwood, 2011; Dobbs & Baba, 2014). Popular mechanisms for spiral arm formation are largely based on early analytical works: e.g., the density wave theory (Lindblad, 1960; Lin & Shu, 1964; Kalnajs, 1971), swing amplifications (Goldreich & Lynden-Bell, 1965; Julian & Toomre, 1966), and bars and tidal interactions (Kormendy & Norman, 1979; Salo & Laurikainen, 1993). These three mechanisms are not mutually exclusive and have mixed observational successes (e.g., Sellwood, 2011; D’Onghia et al., 2013; Shu, 2016; Pour-Imani et al., 2016). Whether spiral arms are long-lived patterns or transient features is still hotly debated in theory and poorly constrained in observations (Sellwood & Binney, 2002; Sellwood, 2011). The progress in the theory of spiral arm formation is slow and current efforts primarily focus on nearby galaxies (Dobbs & Baba, 2014).
Breakthroughs can come from observations of high-redshift galaxies when spiral arms are in the early stages of formation. All classic analytical models of spiral arm formation assume an infinitesimally thin and cold disk in a stable rotation (e.g., Toomre, 1977; Bertin & Arnouts, 1996; Rafikov, 2001; Sellwood, 2014). It is unclear if this assumption holds at high redshift. Compared to local galaxies, high-redshift disks are gas-rich, globally unstable, and tend to have larger velocity dispersions and thicker disks (e.g., Freeman & Bland-Hawthorn, 2002; Elmegreen & Elmegreen, 2006; Law et al., 2007; Tacconi et al., 2013; Glazebrook, 2013; Wisnioski et al., 2015; Johnson et al., 2017; Zhou et al., 2017). The role of the interstellar medium (ISM) and gas feedback in shaping spiral arms is usually over-simplified in local galaxies, but could become increasingly important and complicated at high redshift (e.g., Bertin & Romeo, 1988; Elmegreen & Thomasson, 1993; Wada et al., 2011; Ghosh & Jog, 2015). Spiral arms are also sensitive to external processes such as bars, galaxy mergers, and gas accretion, all of which are different at high redshift (Sellwood, 2004; Wada et al., 2011; Martig et al., 2012; Dobbs & Baba, 2014). Studying spiral galaxies at a dynamically hostile cosmic time has the unique advantage of probing the most sensitive factor(s) responsible for spiral arm formation.
Spiral galaxies are rarely observed at (Elmegreen & Elmegreen, 2006; Law et al., 2012; Conselice, 2014). A minor-merger triggered face-on spiral at remains the only thoroughly studied case in the literature (Law et al., 2012). Previous data show that spiral arms are less well-developed and more chaotic beyond (Abraham & van den Bergh, 2001). The onset of spiral structures in galaxies is proposed to occur at , when disks have developed a cool stellar component in a rotation-dominated disk (Elmegreen & Elmegreen, 2014). However, indirect observational evidence shows that the Hubble sequence may already be in place at (Wuyts et al., 2011), implying an even earlier onset of spiral arms.
Observational difficulties in identifying spiral arms at high redshift might have contributed to the rarity of spiral galaxies at . In the local universe, spiral arms are visually classified through qualitative inspection of morphologies (e.g., Hubble, 1926; Reynolds, 1927; Sandage, 2005). This visual classification scheme suffers strongly from observational biases caused by degraded resolution, cosmological surface brightness dimming, band shifting and imaging depth at high redshift (Abraham et al., 1996a; Giavalisco et al., 1996; Hibbard & Vacca, 1997; Conselice et al., 2000, 2011). For example, spiral features can only be reliably identified for galaxies in the Hubble Ultra Deep Field (UDF) that have major axes larger than 10 pixels (Elmegreen et al., 2005). Most galaxies at have half-light radii of (Allen et al., 2016), making the identification and quantification of spiral features such as the number of arms and pitch angles challenging (Shields et al., 2015). More studies like van den Bergh et al. (2002) focusing on testing the visibility of spiral arms at high redshift are required before concluding the actual number density of spiral galaxies at .
In addition to observational biases, cosmological simulations suggest a few physical processes at that hinder the formation of spiral arms. Earlier cosmological simulations suggest that the paucity of spiral galaxies at can be ascribed to high merger rates (Hammer et al., 2009), high gas accretion rates and multiple low angular momentum inflow cold streams (Cen, 2014). Some cosmological simulations report that grand-design spirals are in place by 3 (Fiacconi et al., 2015) and the high-redshift spirals most likely originated from swing amplifications triggered by satellites. Detailed observations of spiral galaxies at high redshift will enable meaningful investigations into these physical processes that remain elusive in simulations.
Gravitationally lensed galaxies with adaptive-optics (AO) aided observations have pioneered the measurement of physical properties of high-redshift galaxies (e.g., Swinbank et al., 2007; Stark et al., 2008; Jones et al., 2010a; Yuan et al., 2011, 2012, 2015; Swinbank et al., 2015). The lensing magnification allows selection of less massive systems and measurements on smaller physical scales than magnitude-limited studies. The spatial resolution in gravitational lensing observations can reach a few times 10-100 pc, important for minimizing beam-smearing effect and resolving star clusters (e.g., Jones et al., 2010b; Yuan et al., 2013a; Livermore et al., 2015; Vanzella et al., 2017; Rigby et al., 2017). In this paper, we report the integral-field spectroscopic (IFS) observation of a gravitationally lensed spiral galaxy A1689B11 at . It is the second spectroscopically confirmed spiral galaxy at and is 10 times less massive than the spiral galaxy of Law et al. (2012).
This paper is organized as follows. Section 2 describes our IFS observation, data analysis and lens models. Section 3 describes our results from the IFS data and derived physical properties of A1689B11. In Section 4 we discuss the nature of A1689B11 and compare it to other galaxy samples. We summarize and conclude in Section 5. Throughout this paper, we adopt a standard CDM cosmology with , and H km s-1 Mpc-1. At the redshift of , 1 corresponds to a physical scale of 8.2 kpc.
2. Observations and Data Reduction
2.1. Spiral Galaxy Candiate A1689B11
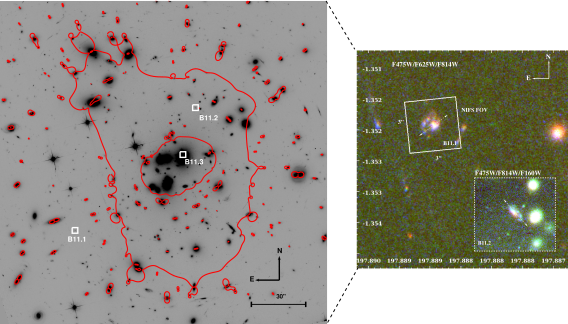
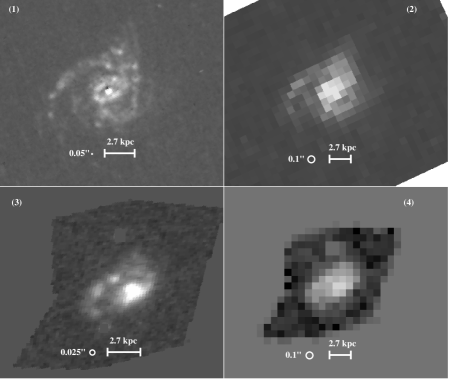
The spiral galaxy candidate (hereafter A1689B11) was first recorded as “source 11” with a photometric redshift of in the strong-lensing analysis of the galaxy cluster Abell 1689 (Broadhurst et al., 2005). Source 11 is gravitationally lensed into two highly magnified images B11.1 and B11.2, and a central image B11.3 (Figure 1). Broadhurst et al. (2005) was the first to point out the spiral feature of A1689B11 and speculated it would be the highest redshift spiral galaxy if confirmed. The first spectroscopic redshift of was provided in Limousin et al. (2007) based on rest-frame UV spectroscopy with Keck/LRIS. The detection of H lines at was reported in the near-infrared (NIR) multi-slit survey of Yuan et al. (2013b). This work presents the NIR IFS observation of image B11.1 (Figure 1). The imaging and photometric data used in this work are obtained from the Hubble Space Telescope (HST; proposal IDs: 11802, 9289, 11710) and the Spitzer Space Telescope archives (program ID: 20439).
2.2. NIFS/Gemini Observations and Data Reduction
AO aided NIR integral field spectroscopic observations with NIFS (Near-infrared Integral-Field Spectrograph; McGregor et al., 2003) were conducted between March 2013 and March 2014 on the Gemini North telescope under excellent weather conditions (average seeing 05, airmass 1-1.6). Our total allocated observational time was 13.5hrs in band 1 (program ID: GN-2013A-Q-23-64). The observation implemented a dithering pattern of “ABAABA” or “AB”, i.e., 33-50% of the target exposure time was spent on sampling sky frames in order to facilitate a good sky background subtraction. The observation centered on image B11.1 instead of B11.2 because of the laser-guide star requirement of NIFS. The coordinates of the pointing center are given in Table 1. The field of view of NIFS is 30 30, with 29 slitlets, each 01 wide. NIFS delivers a spectral resolving power of R 5300 in the K band, corresponding to a rest-frame Gaussian velocity resolution of 24 km s-1.
The data were reduced using a varied Gemini IRAF package following standard procedures (e.g., Storchi-Bergmann et al., 2009). This IRAF package produces sky-subtracted, telluric-corrected and flux-calibrated datacubes. Each individual 900s exposure was spatially aligned based on the brightest H spaxels and co-added based on a mean sigma-clipping procedure. The 1 error datacubes were generated during the sigma-clipping process. We used the star HIP67004 of spectral type A0V for telluric correction and flux calibration. The systematic uncertainties in the flux calibration is estimated to be within 20%. A total of on-source exposures were obtained in the K-band with an angular resolution of 0.1″, corresponding to a median physical scale of 400 pc on the source plane of A1689B11. Our observation reached a 3 H emission line surface brightness depth of 310-17 erg s-1 cm-2 arcsec-2.
The astrometry of the datacube is calibrated by assigning the HST coordinate of the galaxy center to the brightest spaxel in the wavelength-collapsed 2-dimensional (2D) NIFS image and rotating with the positional angle from the observation. The astrometric uncertainty of our IFS datacube is about one spaxel, i.e., 0.1.
2.3. Emission Line Fitting
Our K-band observation was originally planned to detect H and [N ii] lines. To analyze the IFS spectra, we first collapse the datacube in the wavelength dimension in the vicinity of the H line to create an H 2D map. We use the raw H 2D map to generate an initial 2D mask that flags spaxels with no obvious H line detections. We then manually inspect the spectrum of each individual spaxel and refine the mask with three types of visual flagging: (1) significant emission lines, (2) possible emission lines, and (3) no obvious emission lines. The visual inspection of the datacube is necessary in order to reject spaxels that are spurious for low signal-to-noise ratio (SNR) data. We use this visual mask to supervise our subsequent automatic emission line fitting procedure, i.e., we demand the fitting result to be consistent with our visual mask. For example, an emission line fitting result of SNR 5 should have a visual flag of (1), whereas a line detection of SNR should be consistent with a flag type of (3). Those with SNR should match the flag type of (2).
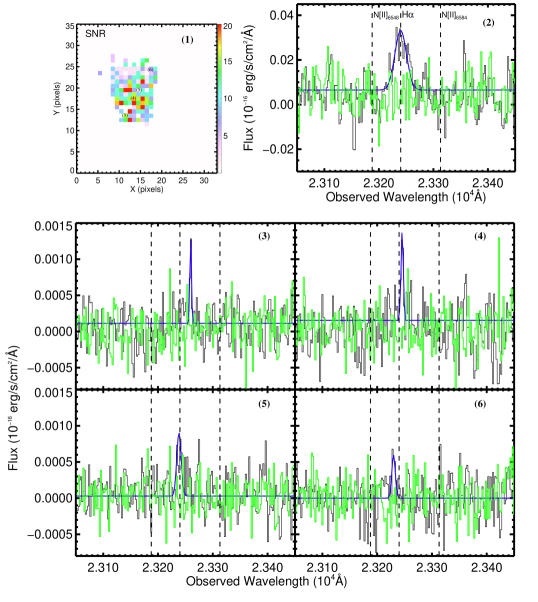
Our automatic emission line fitting procedure involves fitting Gaussian profiles simultaneously to three emission lines in each spaxel: [N ii]6548, 6583 and H (Figure 2). The line profile fitting is conducted using a minimization procedure weighted by the inverse of the variance spectrum. The fitting result is very sensitive to the weighting used. The 1 error datacube generated from the mean sigma-clipping procedure described in Section 2.2 does not provide good weighting to the emission line fitting, as it results in the SNR of the emission line being over-estimated and inconsistent with our visual mask flags. Instead we use the variance over a sky region devoid of emission lines as the weighting. We select a range of sky spaxels to generate a variance spectrum (green lines in Figure 2) for each spaxel using a bootstrap procedure. The SNR of the emission line fitting result is consistent with the visual mask. This weighting method is similar to that used in Leethochawalit et al. (2016) and is reasonable because the variance of the NIR data is usually dominated by sky residuals.
H lines are detected in 130 individual spaxels at 5 level (Figure 2, (1)). [N ii] lines are not detected above 3 in either individual spaxels or the integrated spectrum (Figure 2, (2)). Yuan et al. (2013b) report an [N ii] line detection on one of the four slits configured with different positional angles on B11.1 and B11.2, implying a spatial variation of metallicities. We extract a mock slit spectrum from our NIFS data based on the slit setup of Yuan et al. (2013b), but no [N ii] line is detected above 3. Deeper IFS data from our ongoing OSIRIS/Keck observation on image B11.2 will help to discern [N ii] lines and the spatial metallicity distribution of A1689B11. Figure 2 shows the H 2D SNR map and examples of single Gaussian fits to H emission lines of individual spaxels. An integrated spectrum from coadded spaxels is also presented in Figure 2 for comparison. Figure 2 highlights the necessity of high-spatial resolution in order to distinguish beam-smearing from intrinsic line width. It is also apparent from Figure 2 that the H lines detected on individual spaxels have very narrow widths (approaching the NIFS instrumental line width) and show systematic offsets in the centroids. The focus of this paper is to report the kinematics of H lines (see Section 3).
2.4. Gravitational Lens Modeling
Abell 1689 is one of the most studied lensing clusters with well-constrained mass models. We use the best-fit model from Limousin et al. (2007) and the software Lenstool111https://projets.lam.fr/projects/lenstool/wiki (Kneib et al., 1993; Jullo et al., 2007) to reconstruct the source-plane properties of A1689B11.
We show the lensing configuration and critical lines of A1689B11 in Figure 1 (left). A1689B11 is lensed into a three-image system: B11.1, B11.2 and B11.3. Image B11.2 lies in between the tangential and the radial critical line, resulting in a large flux magnification factor () and a relatively undistorted image (i.e., equally magnified in the major and the minor axis). Our NIFS observation is centered on the less magnified () image B11.1. B11.1 is magnified more in the minor axis direction, making it appear more face-on than the intrinsic image. The geometric magnification for image B11.1 is 4 (along the minor axis) 1.8 (along the major axis). A demagnified central image B11.3 is predicted by the lens model and also observed to be overlapping with one of the brightest cluster members of Abell 1689 (Broadhurst et al., 2005; Limousin et al., 2007).
The statistical error of the lens modeling is estimated from a set of Markov Chain Monte Carlo (MCMC) realizations implemented in Lenstool and is typically 10% for Abell 1689. Both multiple images (B11.1 and B11.2) yield consistent source-plane morphologies and positions within 0.2″. Because B11.1 and B11.2 are not close to the critical lines, the systematic errors in the source-plane morphologies are small compared to the case of giant arcs. Our source-plane reconstructed morphologies are robust within the model statistical uncertainties. The NIFS datacube is reprojected to the source plane after being remapped to the HST coordinates using the calibrated astrometry. Emission line fitting analyses have been carried out on both the image and source plane and the results are self-consistent. We present both the image-plane and source-plane properties in the following sections.
3. Analysis and Results
3.1. NIFS Data Analysis
3.1.1 NIFS H Map and Kinematics
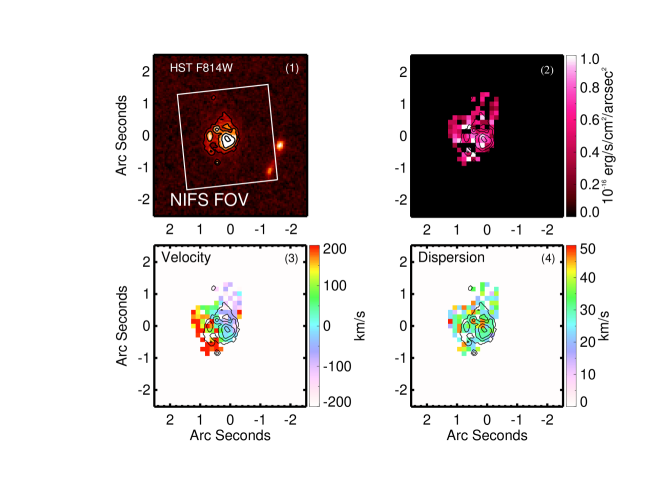
In Figure 3 we show the 2D H flux intensity map and 2D H kinematic maps on the observed frame (image plane), i.e., before lensing reconstruction. To facilitate the comparison with HST images, we mark the extent of HST broad-band detections in contours in all panels. We use the HST/F814W band image as an example because it has the deepest exposure among all HST filter observations. We include the morphology of other HST bands in Section 3.2.
In order to preserve the spatial resolution offered by lensing and because we have sufficient detections on individual spaxels, we do not attempt to bin the original IFS datacube. The NIFS maps in Figure 3 are un-smoothed and include only data with SNR 5. H emission lines are detected throughout the HST contours; H emission lines are relatively stronger near the galaxy core and star forming clumps in the spiral arm.
The rest-frame line-of-sight velocity 2D map is derived from the H line centroids with respect to the systematic redshift and the velocity dispersion map from the H Gaussian line width. We use the median H line center to calculate the systematic redshift. The instrumental profile has been subtracted in quadrature from the best-fit Gaussian width to derive the intrinsic line width. Figure 3 shows a systematic rotation and uniformly small velocity dispersion across the disk on the observed plane.
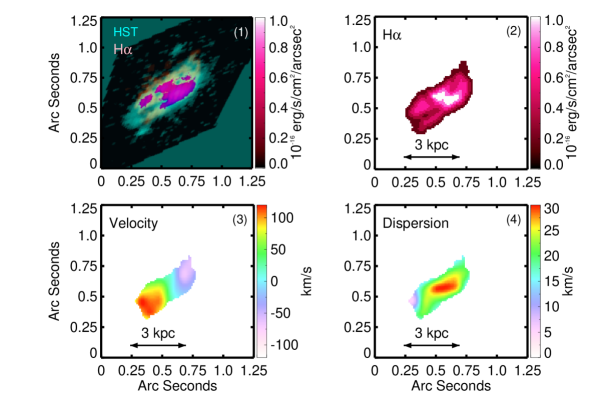
The intrinsic morphology and NIFS measurements are shown in source-plane maps in Figure 4. We use a grid subsampling of on the image-plane and on the source-plane in Lenstool to optimize the spatial resolution of the source-plane reconstruction. The source-plane HST ACS image in Figure 4 is unbinned and has a pixel scale of 0.005 after subsampling. The source-plane NIFS datacube is rebinned adaptively by 5-11 pixels to allow for H line fitting of SNR 5 in each bin. Note that because of the difference in the point spread function (PSF) on the image and source planes, the improvement in the source-plane SNR is usually less than what the magnification map predicts. On average we achieve a source-plane spatial resolution of 150 pc on the HST ACS images and 400 pc on the NIFS 2D maps.
The source-plane 2D velocity map in Figure 4 clearly shows a velocity gradient consistent with a systematic rotation. The velocity dispersion is enhanced slightly in the kinematic center due to beam-smearing from the rotation. We estimate a maximum beam-smearing effect at the kinematic center to be 24 km s-1 based on the velocity map of panel (3) in Figure 4, consistent with the 2D velocity dispersion map of panel (4). We do not see any significant spatial correlation of the H intensity map with the velocity dispersion map. Figure 4 confirms that A1689B11 has a uniformly low velocity dispersion across the disk on the source-plane. The mean velocity dispersion averaged over all spaxels is = 23 4 km s-1. Excluding the central spaxels that are affected most by beam-smearing, the average velocity dispersion on the outer disks is = 15 2 km s-1.
3.1.2 Disk Model Fitting
We use an empirically motivated arctangent function from Courteau (1997) to model the 2D velocity field:
| (1) |
The source-plane line-of-sight velocity is related to the intrinsic velocity by the inclination angle :
| (2) |
The source-plane radius vector is related to the intrinsic radius vector by:
| (3) |
where is the positional angle. For the definition of and , we use the same convention as GALFIT (Peng et al., 2010), i.e., is to the north (up), and to the east (left); is face-on and is edge-on.
The seven free parameters of the 2D disk model are thus: central velocity , inclination , position angle , disk dynamic center (, ), turn-over radius , and asymptotic velocity . Note that is close to zero if the median H line center is a good approximation for the central velocity. The best-fit model is obtained using a minimization procedure similar to that described in Jones et al. (2010b). We use the statistical 1 errors from the emission line fitting to compute the . The uncertainties of the best-fit parameters are estimated by perturbing the model until the increases by one standard deviation from the best-fit model.
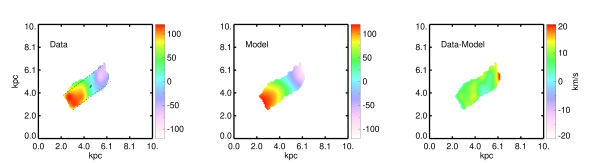
Figure 5 shows the best-fit 2D disk model and the residual maps. The reduced of our best-fit model is 2.1 and the best-fit parameters are: asymptotic velocity = 200 12 km s-1, turn-over radius = 1.7 0.1 kpc, inclination angle degrees, and positional angle degrees. The kinematic center is marked on Figure 5 and is consistent with the brightest intensity from both the H image and the HST broad-band images within 0.1.
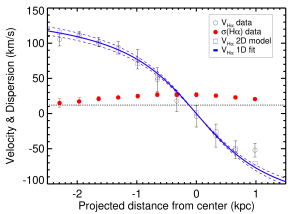
We can also use Eq. (1) to fit the 1D rotation curve. We extract the 1D rotation velocities using a 0.8 slit along the major axis with the PA and the kinematic center from the best-fit 2D model (see Figure 5, left panel). The seven-parameter 2D model then reduces to a five-parameter 1D model. In Figure 6, each data point represents one resolution element (0.1) binned along the slit and the error bars are the standard deviation of each data bin. We show the best-fit 1D rotation curve and its 1 variations in Figure 6. We find that the best-fit parameters from the 1D model are consistent with the 2D disk model within statistical errors. Note that we have also tested fitting a 3D disk model such as Di Teodoro & Fraternali (2015) to the datacube. Unfortunately, we do not have sufficient SNR per spaxel for a reliable fit of the 3D model. Our 2D and 1D disk model provides a reasonably good fit to the data. Overall, a regular rotating disk model is sufficient to explain the velocity field of A1689B11. The small residuals on the edge of the disk (Figure 5 and Figure 6) are most likely due to under-estimation of the observational noise.
The simple 2D disk model does not consider beam-smearing and variations of the velocity dispersion. However, as discussed in Section 3.1.1, the disk shows a uniformly low velocity dispersion and the beam-smearing does not contribute significantly to the shape of the velocity field. We show the 1D velocity dispersions (red points) along the kinematic major axis in Figure 6. The velocity dispersion in the galactic center is mildly enhanced due to beam-smearing effects. The dispersion on the outer disk is approaching the thermal broadening threshold (12 km s-1) of H emission line (black dotted line).
We discuss the kinematics of A1689B11 and compare it with other samples in Section 4.
3.2. HST morphologies
To compare our NIFS data with HST images in more detail, we analyze source-plane morphologies for all HST ACS and WFC3 bands. B11.1 and B11.2 are well-detected in all four IRAC bands from Spitzer. We do not gain resolved morphological knowledge from IRAC because of its poor spatial resolution ( 2.5, larger than the lensed images). Therefore IRAC data is only used when deriving global properties of A1689B11 in Section 3.3.
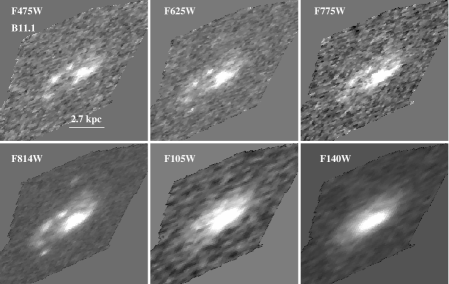
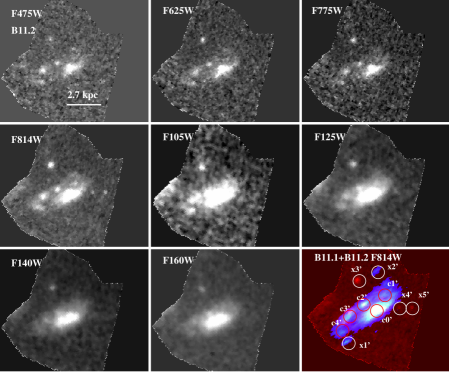
We take full advantages of the multiple images from gravitational lensing and combine information from both images B11.1 and B11.2 to derive the best source-plane morphology. B11.1 is covered by 6 filter bands (F475W, F625W, F775W, F814W, F105W, F140W) and B11.2 is covered by these bands plus the additional 2 bands of F125W and F160W. Source-plane morphologies for individual HST bands are reconstructed using the same method as implemented for the F814W image described in Section 3.1. The spiral features are more prominent in the HST/ACS optical images (0.05 resolution), whereas HST/WFC3 images (0.1 resolution) show mostly the central disk. We include source-plane morphologies for individual bands in the Appendix.
We perform GALFIT (Peng et al., 2010) on the source-plane images using a single exponential disk model. The fitting yields consistent morphological parameters for all bands of HST images and for both B11.1 and B11.2. The mean and standard deviation of the scale lengths () calculated from all 14 source-plane images are kpc, with an inclination angle of degrees and degrees. The single exponential disk model from GALFIT are in excellent agreement with geometric parameters derived from the NIFS kinematic 2D disk model (summarized in Table 1). For the convenience of comparing with various definitions of radius in literature, we convert to the half-light radius and the effective radius using the empirical relation of (Glazebrook, 2013). The half-light radius of A1689B11 is therefore kpc. The central area of A1689B11 shows significant H emission from our NIFS data and some elongated substructures in the HST ACS images (Figure 4; Appendix). The central area could be a superposition of a star cluster and a bulge/bar component. We experimented with adding a bulge component to the exponential disk, however the fitting does not converge for most of the images. We are currently investigating a more sophisticated procedure for the bulge-disk decomposition and our preliminary result shows a very small bulge component. We will report the full analysis in a future work focusing on the pitch-angle and bulge correlation of this spiral galaxy (Yuan, in preparation).
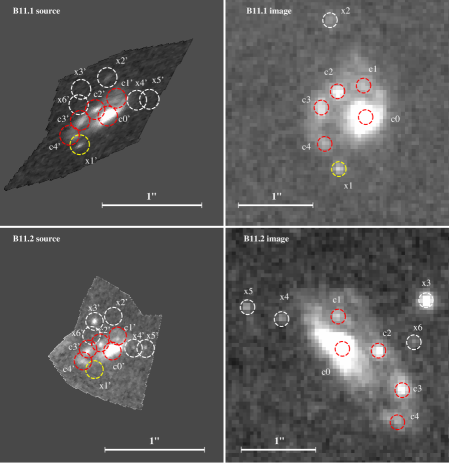
Because gravitationally lensed images cover an extended area, the probability of having contaminated foreground/background sources in the field of view of lensed images is larger than a non-lensed high- galaxy case. We cross-compare substructures on the source-plane images of B11.1 and B11.2 to reject clumps/knots that may not be associated with the spiral galaxy. We use the F814W HST images that have the deepest exposure and best spatial resolution for the cross-examination. Figure 7 demonstrates our clump identification and rejection procedure. We first manually identify bright clumps on the right panels of Figure 7. There are 7 clumps (c0-c4, x1, x2) marked for lensed image B11.1 and 9 clumps (c0-c4, x3, x4,x5, x6) for lensed image B11.2. We then predict the source-plane positions and brightnesses of the clumps (c0’-c4’, x1’-x6’) and cross-examine them in the left panels of Figure 7. Because lensing conserves surface brightness and images B11.1 and B11.2 cover similar intrinsic areas of the lensed galaxy, the resolved source-plane substructures of B11.1 and B11.2 should be identical from the same HST observation 222This method is not suitable in cases where the lensed images are crossed by critical lines, in which case the multiple lensed images may represent different parts of the intrinsic galaxy.. Source-plane clump brightness and positions that are not consistent within the uncertainties of lens models are considered as interlopers. For example, clump x2’ is identified initially on B11.1 but is not detected on B11.2 within the lensing position uncertainty (RMS=0.2) , we therefore reject clump x2’ and consider it as a foreground or background source. Similarly, clumps x4’ and x5’ identified initially on B11.2 are not detected on B11.1 and are rejected. For clump x1’ (yellow circles in Figure 7) that is initially identified on B11.1, there is a marginal 3 detection in the source-plane of B11.2, however, the lens model predicts a source-plane brightness that is 3 times brighter than what is observed. We therefore reject x1’ because of the inconsistency in flux magnification uncertainties ( 10-20%). Note that clumps/knots that are identified as foreground/background objects in this lensing analysis are at significantly different cosmological distances from the source galaxy and are therefore not satellites. The final combined morphologies of B11.1 and B11.2 are shown in the Appendix.
Finally, we use colors of the clumps as an alternative check for substructure identities.
We measure aperture photometry for all clumps in B11.1 in Figure 7 using HST broadband images.
A reliable (SNR5) photometry can only be measured for six clumps across a minimal of 3 bands: c0’-c4’ and x2’. We then carry out Spectral Energy Distributions (SEDs) fitting for
the clumps using the software LE PHARE (Ilbert et al., 2010).
We fix the redshift at and use the stellar population synthesis models of Bruzual & Charlot (2003). We choose an initial mass function (IMF) of
Chabrier (2003) and the Calzetti et al. (2000) attenuation law, with E ranging from 0 to 2 and an exponentially decreasing star formation history.
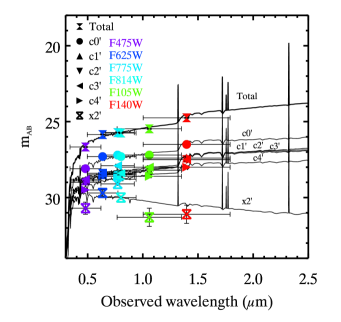
The best-fit SEDs are shown in Figure 8. Clumps c0’-c4’ show similar SEDs, whereas x2’ has a very different SED, consistent with our lensing source-plane position analysis that
x2’ is most likely an interloper. We also show in Figure 8 the best-fit SED for the total photometry of B11.1 (Section 3.3).
In total, we confirm 5 bona fide clumps (c0’-c4’) for A1689B11.
There are significant H emissions detected on the central clump c0’ and on clump c2’ on the spiral arm; H lines are also detected on clump c1’ and c3’ on the spiral arm (see Figure 4).
A detailed analysis on individual clump properties will be reported in a separate work when we combine our ongoing OSIRIS/Keck data analysis on image B11.2.
Our preliminary result shows that the sizes ( pc) and surface star forming densities ( yr-1 kpc-2) of the clumps are comparable
to high-redshift SF galaxies and are in the intermediate range of what has been reported for clumpy galaxies (e.g., Genzel et al., 2011; Jones et al., 2010b; Livermore et al., 2015).
3.3. Star formation Rate, Stellar and Dynamic Mass
We estimate the total stellar mass from the SED fitting of broadband photometries from the HST ACS and the Spitzer IRAC data (details in Yuan et al., 2013b) (best-fit SED shown in Figure 8). The best-fit stellar mass for A1689B11 is = 109.8±0.3 and the best-fit extinction value is E(B-V)stellar = 0.22. The total dust-corrected SFR from the SED fitting is SFRSED = 22 3 yr-1. All values have been corrected for the lensing flux magnification. The dust-uncorrected SFR from the total H fluxes of our NIFS observations is SFR = 3.9 0.4 yr-1. Using the nebular dust extinction = 0.73 from (Yuan et al., 2013b) and the nebular attenuation curve of Cardelli et al. (1989), the dust-corrected SFR from H is SFRHα = 22 2 yr-1, in agreement with SFRSED. The total stellar mass and SFR of A1689B11 are consistent with a SF galaxy on the mass-SFR relation (the main-sequence) within the 0.3 dex 1 scatter (e.g., Zahid et al., 2012) of the relation. The total SFR of A1689B11 is 10-20 times higher than a typical spiral galaxy of similar masses at .
Because we do not have spatially resolved dust attenuation measurements, the following estimation of SFR surface density is indirect and based on a few assumptions. Assuming the spatially resolved is similar to the global measured from the slit data of Yuan et al. (2013b), then the average SFR surface density is SFR = 0.3 yr-1 kpc-2. This value of SFR is in the intermediate range of SF galaxies and is 1-2 orders of magnitude higher than local SF galaxies (e.g., Swinbank et al., 2012; Fisher et al., 2017; Zhou et al., 2017). Assuming a simple Schmidt-Kennicutt (KS) relation (Kennicutt, 1998), we convert SFR into a gas surface density of gas 158 pc-2. Assuming the surface area of the gas is , where R is the radius where H are detected ( 1.7 kpc), we then derive a gas fraction ( = /(+)) of 18%. The is in the lower range of star-forming galaxies at but still significantly higher than local SF galaxies (e.g., Tacconi et al., 2013). We compute the Toomre -parameter (Toomre, 1964) for a gas-dominated disk as defined by , where is the epicyclic frequency of the galaxy’s rotation, is the gas velocity dispersion, and is the surface mass density. To compute , we assume a Keplerian disk so that , where is the angular frequency. The calculated at the half-light radius is . Adopting km s-1, we find gas 0.7 for A1689B11. The small is commonly measured in clumpy high-redshift SF galaxies and is consistent with the scenario that large SF clumps form in the violent disk instability (Genzel et al., 2011; Law et al., 2012; Glazebrook, 2013; Shibuya et al., 2016). We caution that the intrinsic SFR can easily change by a factor of two because of the unknown dust attenuation. The systematic errors related to the methodology of deriving and are also highly uncertain and proper calculation requires estimation of the Mach number and molecular gas observations (e.g., Federrath et al., 2017b).
The dynamical mass assuming a rotationally supported disk is = 2rot/ =1010.2±0.1, where is the asymptotic velocity and the radius is the turn-over radius from the 2D disk model (Section 3.1.2). The ratio of the dynamical mass to the stellar mass for the inner 2 kpc is therefore . Taken the as the sum of dark matter and baryonic matter, then the inferred dark matter mass fraction within the inner 2 kpc (compatible to ) is . The value of is in the typical range of local late-type spiral galaxies of similar and much larger than the massive baryon-dominated clumpy disk galaxies at 2 (Genzel et al., 2017; Lang et al., 2017). However, this conclusion is subject to uncertain observational and methodological errors of . For example, by simply propagating the errors of and , we obtain . In addition, in order to decompose the contributions of the baryonic disk and the dark matter halo to the total rotation curve, assumptions on the mass-to-light ratio (M/L) and scale-height of the stellar disk have to be made (e.g, Aniyan et al., 2016), both are difficult to constrain for our galaxy. We therefore caution again that values derived in these two paragraphs are dominated by systematic errors and should be interpreted with some caution.
4. Discussion
4.1. Spiral arms vs merger
The morphology of A1689B11 is indicative of a prototype spiral arm but not conclusive. The clumpy morphology is also suggestive of a merger. However, by combining the morphology with the high-spatial resolution kinematics presented in this work, we rule out the merger scenario for A1689B11.
Distinguishing mergers from isolated disks is extremely tricky at high redshift. Neither morphological nor kinematic classifications alone can unambiguously exclude mergers. Morphological classifications of mergers rely on footprints of interactions such as bridges, tidal tails and double nuclei. These features can be easily missed at high redshift because of surface brightness dimming, size evolution and band shifting (e.g., Hibbard & Vacca, 1997; Hung et al., 2015). High-redshift galaxies are clumpier and show more irregular structures than local galaxies, further complicating the visual characterization of mergers (Elmegreen et al., 2007). Kinematic classifications assume that isolated disks exhibit smooth velocity gradients whereas mergers show more asymmetric and chaotic kinematic features (Shapiro et al., 2008; Dicaire et al., 2008; Colina et al., 2005). However, this assumption does not consider post-coalescence mergers which may also display disk-like kinematics (Bellocchi et al., 2012). A “morpho-kinematic” classification that combines the morphological and kinematic criteria is proposed as a more robust approach (Rodrigues et al., 2017).
The velocity field of A1689B11 is consistent with a rotating isolated disk based on current morphological and kinematic classification schemes. We first use the kinematic criteria of the SINS survey (Shapiro et al., 2008) and derive and from the 2D velocity and velocity dispersion map. We find and , placing A1689B11 in the isolated disk region of the versus diagram. The unique clump identification method presented in Section 3.2 rejects most of the minor-merger like features as either foreground or background sources. For clumps that do associate with A1689B11, their velocities are consistent with rotating along with the main disk and their velocity dispersions do not show deviations from the rest of the disk, inconsistent with the scenario that the clumps are mergers. To further rule out the scenario of post-coalescence mergers, we apply the five “morpho-kinematic” criteria of Rodrigues et al. (2017). We find that A1689B11 satisfies all five criteria of an isolated rotating disc: (1) the velocity map has a single velocity gradient (Section 3.1.2 and Figure 5); (2) ( for A1689B11); (3) there is a -peak coinciding with the centre of rotation (Section 3.1.2 and Figure 4); (4) there is no mismatch between the kinematic and morphological PAs, i.e., ( for A1689B11, Section 3.1.1 and 3.2; Table 1); and (5) The rotation center matches the stellar mass center within 0.4 (0.1 for A1689B11; Section 3.1.1 and 3.2; Figure 5). Based on these arguments, we therefore exclude mergers as the origin of A1689B11.
4.2. Spiral arms vs clumpy disks and irregulars
Spiral galaxies and irregular galaxies are two distinct morphological classes in the local universe (e.g., Hubble, 1926). However, as the general morphology of distant galaxies becomes more chaotic and irregular (e.g., Abraham et al., 1996a, b; Conselice et al., 2005; Elmegreen et al., 2007; Shibuya et al., 2016), spirals and clumpy/irregular galaxies do not have to be mutually exclusive at high redshift. For example, studies focused on spiral morphologies show that spiral structures are highly disturbed and arms are less well-developed at at (Abraham & van den Bergh, 2001; Elmegreen et al., 2005). The less well-defined spiral structures at high redshift could be caused by either intrinsic evolutions and/or observational biases.
Spiral arms are the main sites of star formation in the local universe. The brightness, sizes and surface densities of star forming regions are much larger at high redshift (e.g., Elmegreen et al., 2005; Jones et al., 2010b; Genzel et al., 2011; Swinbank et al., 2012; Fisher et al., 2014). The size and brightness of the star forming clumps in the spiral arm of A1689B11 are comparable to those of clumpy SF galaxies (Yuan, in preparation), producing a much clumpier appearance than local spiral arms. In addition, A1689B11 is gravitationally lensed; the reconstructed source-plane morphology is much sharper than a non-lensed case, making it look different from most 2 SF galaxies.
To demonstrate the effect of large star forming clumps and observational effects such as surface brightness dimming and gravitational lensing on the appearance of spiral arms at high redshift, we manually redshift a local spiral galaxy to and compare its redshifted morphology with the lensed and non-lensed case of A1689B11 (Figure 9). The local spiral galaxy template () is chosen from the DYNAMO (DYnamics of Newly-Assembled Massive Objects) sample. The DYNAMO sample is a local analog of turbulent, clumpy disk galaxies at high redshift (Green et al., 2010, 2014; Bassett et al., 2014). is one of the few galaxies in the DYNAMO sample that have a spiral morphology. has similar half-light radius ( kpc), star forming clump size and brightness as A1689B11 (Fisher et al., 2017). We use the HST H narrow-band image (pixel size ) of as it best represents the clumpy SF morphology (Figure 9, panel (1)). Figure 9-panel (2) illustrates the mocked HST/WFC3 (pixel size ) morphology of at . We assume no intrinsic size evolution because the DYNAMO sample consists of compact objects in the local universe, analogous to the sizes of galaxies . Because is nearly face-on, the morphology of A1689B11 is deprojected in panels (3) and (4) for a better comparison. Panel (3) of Figure 9 shows the best source-plane reconstructed morphology of A1689B11 based on the HST/F814W band image. Owing to gravitational lensing, the effective spatial resolution on the source-plane is increased by a factor of 2-3 and the SNR of the image increased by 7. To compare with the non-lensed image of at , we show in panel (4) what A1689B11 would have looked like without lensing magnification in the HST/WFC3 IR band.
Panel (1) and (2) of Figure 9 underline the importance of separating observational effects from intrinsic evolution of spiral arms. In the local universe, spiral galaxies are divided into three classes based on the number of arms: grand-design (two-arm), many-arm (multiple distinct global arms), and flocculent (multiple less distinct arms) (e.g., Elmegreen et al., 1982; Hart et al., 2017). According to the local image of Figure 9-panel (1), is classified as a many-arm spiral, as are more than half of the local spiral galaxy population (Davis et al., 2014). As a result of surface brightness dimming, would be mostly likely classified as a rare one-arm spiral that are only seen in of local spirals (Davis et al., 2014). It is possible that A1689B11 has more arms like , but only the longest arm is visible at this redshift and with this magnification.
Panel (3) and (4) of Figure 9 demonstrate the power of gravitational lensing in bringing the otherwise unseen spiral structures into focus. The spiral structure is still detectable in the redshifted image of , whereas the spiral arm of A1689B11 is barely distinguishable in the un-lensed case of panel (4). Note that although and A1689B11 share similar galaxy size and SF clump brightness, is 10 times more massive than A1689B11 and has a large H velocity dispersion of 50 km s-1. There is noticeable differences in the morphological appearance of panel (3) and (4), implying that the intrinsic spiral structures of A1689B11 are less well-developed than . While a detailed comparison of the host properties of and A1689B11 is beyond of the focus of the current paper, Figure 9 simply demonstrates that the morphology of A1689B11 is consistent with a spiral galaxy. The effect of gravitational lensing, surface brightness dimming and larger SF regions at high-redshift combined together to make the somewhat unique appearance of A1689B11.
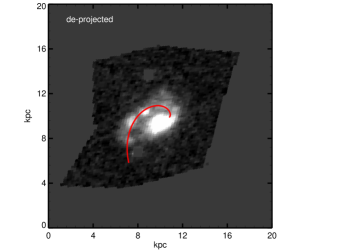
Finally, separating spiral arms from clumpy irregular morphologies requires a quantitative classification scheme. Such a scheme is not available yet at high redshift. For example, there are two geometric parameters that are commonly used in quantifying local spiral arms: the number of arms (or harmonic modes) and the pitch angle. A large fraction of local spirals can be modeled by superpositions of logarithmic spiral functions. Based on this, automatic spiral arm finding and logarithmic function fitting tools have been developed and applied in local galaxy surveys (e.g., Davis et al., 2012; Davis & Hayes, 2014; Shields et al., 2015; Hart et al., 2017). Our on-going effort of testing and adapting these tools at high-redshift will help to quantify spiral arms and to separate spiral from irregular structures objectively. We show in Figure 10 a preliminary best-fit logarithmic spiral function created by manually masking pixels that form the spiral arm. We find a large pitch angle () for the arm. We test the automated arm detection and fitting routine of SpArcFiRe (Davis & Hayes, 2014) on A1689B11 and notice that the number of arms and pitch angle depend sensitively on the bulge-disk decomposition, lensing PSF reconstruction and masking of noise. We will report the pitch angle analysis in our future work (Yuan, in preparation). To conclude, we favor the interpretation of a spiral galaxy with primitive spiral arms developing in A1689B11 instead of a merger or an irregular galaxy.
4.3. Comparison with other samples
The total SFR (22 yr-1) and stellar mass (109.8 ) place A1689B11 as a typical SF main-sequence galaxy at . However, the kinematic properties of A1689B11 are quite “mature” compared to a SF galaxies and are more akin to local spiral galaxies.
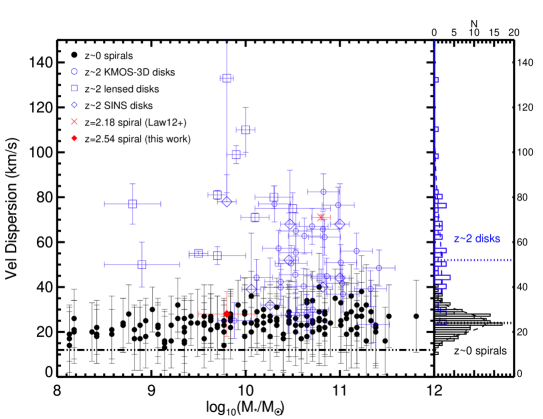
We compare the gas velocity dispersion and stellar mass of A1689B11 with other samples in Figure 11. We collect H gas velocity dispersion measurements on disk galaxies from a few representative IFS surveys at : the SINS disks (Förster Schreiber et al., 2006, 2009; Cresci et al., 2009), the KMOS-3D disks (Wisnioski et al., 2015), and gravitationally lensed galaxies (Jones et al., 2010b; Livermore et al., 2015). Only the rotation-dominated () disks from these surveys are shown. The sample is taken from a local reference sample of rotating spiral galaxies with H velocity dispersion measurements (Epinat et al., 2010).
The local spirals have low H velocity dispersions irrespective of their stellar masses. There is a large spread in velocity dispersions of disks, with a median value that is 2.5 times larger than local spirals. We also mark the thermal broadening of H emitting gas ( K) as the minimal velocity dispersion that can be measured from the H line. The systematic uncertainty in comparing velocity dispersions across samples could also contribute to the large scatter in high-redshift samples. The major systematics come from the method used to correct for beam-smearing, the disk model, and the radius at which the velocity dispersion is measured and the weighting used. The velocity dispersion of A1689B11 is considerably lower than lensed galaxies of similar masses. It is also much lower than the median of all samples. The large () of A1689B11 is similar to local spirals and 2-5 times larger than the median value of SF galaxies at (e.g., Cresci et al., 2009; Swinbank et al., 2017).
One of the major observational results from IFS surveys of high-redshift () galaxies is that the intrinsic gas velocity dispersions as usually measured from optical ionized gas are significantly higher than local SF galaxies (e.g., Law et al., 2009; Lehnert et al., 2009; Förster Schreiber et al., 2009; Genzel et al., 2011; Wisnioski et al., 2015). Popular explanations for the enhanced velocity dispersions include star formation feedback (Lehnert et al., 2009; Green et al., 2014), gravitational instability (Agertz et al., 2009; Ceverino et al., 2010), a combination of star formation feedback driven and gravitationally driven turbulence (Krumholz & Burkhart, 2016; Krumholz et al., 2017), a multitude of physical drivers of turbulence (Federrath & Klessen, 2012; Federrath et al., 2017a) and cosmological cold gas accretion (Dekel et al., 2009; Bournaud & Elmegreen, 2009; Genzel et al., 2011; Genel et al., 2012).
If the ionized gas turbulence of A1689B11 is directly driven by energy ejected from star formation through supernova, then its SFR surface density suggests a velocity dispersion of km s-1(e.g., Lehnert et al., 2009; Green et al., 2014), depending on how the energy is dissipated into the ISM and assuming a conservative supernova feedback efficiency of 0.25 (Dib et al., 2006; Zhou et al., 2017). In this simple model, the small velocity dispersion of A1689B11 would imply that the supernova feedback efficiency is a factor of 2 lower than local galaxies, which is difficult to explain.
In the slightly more complicated feedback driven turbulence model of Krumholz & Burkhart (2016), where is a function of SFR and , the small velocity dispersion of A1689B11 can be reproduced at a , matching our rough estimation of in Section 3.3. The gravity driven turbulence model of Krumholz & Burkhart (2016) is disfavored because the small would require an unrealistically large gas fraction (). Future direct observations of molecular gas and dust maps of A1689B11 would provide a more robust measurement on and gas fraction to distinguish various turbulence driven models.
We also show in Figure 11 the location of the spiral galaxy BX442 at from Law et al. (2012). BX442 has a high velocity dispersion ( 70 km s-1) and is thought to have a short-lived spiral triggered by a minor merger (Law et al., 2012). Two conditions must be satisfied according to the minor-merger trigger mechanism. First the galaxy must be massive enough to stabilize the formation of an extended disk. Second, a nearby merging satellite must be properly orientated and sufficiently massive to excite the spiral feature. A1689B11 is 10 times less massive than BX442 and is not consistent with a merging system as discussed in Section 4.1. Even if the minor merger scenario works for BX442, an alternative mechanism is required to account for the existence of A1689B11.
4.4. Spiral Arm and Thin Disk formation
Being an outlier in both the velocity dispersion distribution and morphology (spiral structure) of high-redshift galaxies, A1689B11 provides a few interesting angles to revisit the formation of spiral arms.
Classic theories of spiral arm formation require a dynamically cool and thin disk. In the paradigm of the density wave theory, the amplitude of the induced density wave becomes too weak if the gas velocity dispersion is too high or if the disk is too thick (e.g., Lin & Shu, 1964; Bertin & Lin, 1996; Elmegreen & Thomasson, 1993; Rafikov, 2001; Bottema, 2003; Sellwood, 2014). In the alternative theory of swing amplification or self-gravitational instability, a large velocity dispersion (in the context of a large Toomre- parameter) dampens the amplification and a thick disk reduces the disturbance gravity that are seeds of the swing amplification (e.g., Julian & Toomre, 1966; Elmegreen & Thomasson, 1993; Bottema, 2003; Sellwood, 2014). In the local universe, almost all spiral arms reside in the thin disk (scale height 200-300 pc) with a dynamically cool stellar ((star) km/s) and gas component ((H) km/s) (Glazebrook, 2013). For stellar disks that are dynamically “warm” and have a non-negligible thickness, spiral activity develops mostly in the cold gas component (Bertin & Lin, 1996). The exceptions are mergers or bar induced spirals, where the external driver plays a more important role than internal disk dynamics (e.g., Kormendy & Norman, 1979; Bottema, 2003; Dobbs et al., 2010).
Both the density wave and swing amplification theory have seen a certain degree of success in explaining local spirals where the model assumptions are easily satisfied. The logarithmic spiral function predicted from the density wave theory has been widely used and confirmed in observations of local spirals, whereas swing amplification is commonly used to explain transient and less regular spirals. The main difference is that density wave theory predicts quasi-steady long-lived arms (wave arm) and swing amplification or its various form of gravitational instability predicts short-lived reoccurring arms (material arm). It is difficult to constrain the lifetime of the spiral arm observationally, thus hard to distinguish the two theories (e.g., Sellwood, 2011). Current simulations seem to prefer either swing amplification or merger in explaining the formation of spiral arms at high redshift (e.g., Law et al., 2012; Fiacconi et al., 2015). For example, self-gravitational instability and fragmentation has been proposed to model the local DYNAMO spiral (Section 4.2) that has a high velocity dispersion and clumpy SF regions analogous to high-redshift disks (Inoue & Yoshida, 2017). Minor merger is thought to trigger the short-lived spiral structure of BX442 (Law et al., 2012).
It is reasonable to expect that the quasi-steady spiral arm from the density wave theory is suppressed at high redshift because of the high gas velocity dispersions and geometrically thick disks (Cresci et al., 2009; Elmegreen & Elmegreen, 2006). The rarity of spirals at could be partly accounted for by the short-lived arms from either gravitational instability or mergers. On the other hand, the discovery of a dynamically cool disk like A1689B11 could mean that the condition for the classic density wave spirals to develop can exist at . The small velocity dispersion of A1689B11 is indicative of a thin disk (Figure 11). Our preliminary fitting of a logarithmic spiral function (Figure 10) is consistent with a density wave triggered primitive spiral arm of A1689B11. We speculate that A1689B11 belongs to a population of rare spiral galaxies at that mark the earliest epoch of thin disk formation (Freeman & Bland-Hawthorn, 2002; Kraljic et al., 2012; Freeman, 2012; Elmegreen et al., 2017). Note that the spiral structure of A1689B11 would not be visible with current observational capacity without gravitational lensing (Figure 9). Future observations with the James Webb Space Telescope (JWST) will help to reveal this population and investigate the earliest onset of spiral arms and thin disks.
4.5. The origin of spiral arms in cosmological zoom-in simulations
Modern theoretical efforts in understanding the origin of spiral arms have focused on semi-analytic or N-body simulations in isolated disks (e.g., Wada et al., 2011; Baba et al., 2013; D’Onghia et al., 2013; D’Onghia, 2015). Cosmological simulations do not have sufficient resolutions to trace the detail dynamics of spiral arms, however, it is interesting to explore the spiral arm formation from the context of cosmological simulations where the role of environment is included.
Recent cosmological zoom-in simulations (Cen, 2014) provide valuable insights into the emergence of the Hubble sequence across cosmic time. Cen (2014) shows the rich physics of cold gas accretion dynamics onto galaxies and evolutionary trends. At , the average in-situ cold gas accretion streams through the galactic halo virial sphere surface can be characterized by: (1) multiple cold streams, (2) high accretion rates, (3) low angular momenta, and (4) high gas densities. Among these four parameters, it is suggested that spiral structures are most sensitive to (1) the number of concurrent streams in the gas accretion. Flocculent spirals only begin to significantly appear at when the number of major gas streams are about two to three and two-arm grand-design spiral galaxies appear at 1 when the number of major cold streams reduces to one. In the framework of Cen (2014), the average number of gas streams decreases from high to low redshift. However, at each redshift, there is a distribution of in-situ environments pertaining to the range of cold streams. It is therefore possible to find “evolved” spiral galaxies at high- and “unevolved” high-redshift analog galaxies at low- at the tail of the environmental distributions.
In the framework of Cen (2014), spiral A1689B11 may be formed in an in-situ environment that is characterized by probably one major stream with high accretion rates and gas densities for an extended period of time. Because the number of significant cold streams is correlated with the degree of interactions among galaxies, it is expected that the velocity dispersion of the stellar disk would be positively correlated with the number of cold streams (Cen, 2014). This scenario is consistent with accretion energy being one of the main drivers of the turbulence in disks at 2 (e.g., Birnboim & Dekel, 2003; Dekel et al., 2009; Bournaud & Elmegreen, 2009; Genel et al., 2012).
However, galaxy growth through cold-mode accretion has been challenged by other cosmological simulations (e.g., Nelson et al., 2013; Genel et al., 2014). Whether the Hubble sequence originates from the cold flow process or other mechanisms such as mergers and feedback is highly controversial (e.g., Genel et al., 2015). Moreover, extra care must be given when studying the origin of the spiral arms in cosmological simulations. Spiral features in current cosmological simulations may originate from unphysical perturbations and are sensitive to the resolution and the detailed prescriptions of ISM models. With a larger sample of high-redshift spirals in observations and larger volumes of cosmological zoom-in simulations with sub-pc resolutions, we should be able to answer the question of whether the in-situ environment plays a critical role in the formation of spiral galaxies.
| RA (J2000) | 13:11:33.336 |
|---|---|
| DEC(J2000) | -01:21:06.9 |
| Spectroscopic data measurements: | |
| Redshift (zHα) | 2.540 |
| Velocity dispersion (, mean) | 23 4 km s-1 |
| Velocity dispersion (, outer disk 1-2 kpc) | 15 2 km s-1 |
| Star formation rate (SFRHα) | 22 2 yr-1 |
| Dust attenuation (E(B-V)) | 0.73 |
| GALFIT/exponential disk best-fit: | |
| Inclination () | 55 10 degrees |
| Position angle (PA) | -36 6 degrees |
| Scale length () | 1.30.4 kpc |
| Half-light radius () | 2.60.7 kpc |
| Effective radius () | 2.00.4 kpc |
| 2D velocity disk model best-fit: | |
| Inclination (,velocity) | 51 2 degrees |
| Position angle (PA,velocity) | -37 2 degrees |
| Radius rotation (, velocity) | 1.7 0.1 kpc |
| Rotation Velocity () | 200 12 km s-1 |
| Inferred physical parameters: | |
| Star formation rate (SFRSED) | 22 3 yr-1 |
| Stellar mass () | 109.8±0.3 |
| Dynamical mass () | 1010.2 |
| Average SFR surface density (SFR) | 0.3 yr-1 kpc-2 |
| Average gas surface density (gas) | 158 pc-2 |
| Gas fraction () | 0.18 |
| Toomre parameter Qgas | 0.7 |
Notes. — All values have been corrected for lensing magnifications. PA are defined as: PA=0 when the major axis is up and positive if rotated counterclockwise. Assumptions for inferred values are described in Section 3.
5. Summary and Future Work
We report NIFS/Gemini observations on a gravitationally lensed spiral galaxy A1689B11. It is the highest redshift spiral galaxy observed with the highest spatial resolution and spectroscopic depth to date. A1689B11 shows a primitive spiral arm that is scarcely seen in other galaxies at . Regarding the SFR, size and stellar mass, A1689B11 is representative of a 2 SF galaxy. In contrast, the H kinematic field shows striking similarities to isolated late-type spiral galaxies. It shows an ordered rotation ( = 200 12 km s-1) and uniformly small velocity dispersions ( = 23 4 km s-1and = 15 2 km s-1). The low gas velocity dispersion is consistent with the classic density wave theory that spiral arms form in dynamically cold and thin disks. We speculate that A1689B11 belongs to a population of rare spiral galaxies at that mark the formation epoch of thin disks. Future observations with JWST will help to reveal this population and investigate the earliest onset of spiral arms.
Our follow-up work include a detailed study on the angular momentum and SF clump properties by including our recent OSIRIS observation on the more magnified image B11.2 of A1689B11. We are exploring a more robust method of bulge/disk decomposition of A1689B11 and plan to investigate the bulge to pitch angle correlation in a follow-up paper (Yuan, in prep). Our on-going IFS observations on a larger sample of non-lensed spiral galaxies ( 30) at that we recently discovered will help to validate/reject our speculations about the origin and number density of spiral galaxies like A1689B11.
References
- Abraham et al. (1996a) Abraham, R. G., Tanvir, N. R., Santiago, B. X., Ellis, R. S., Glazebrook, K., & van den Bergh, S. 1996a, MNRAS, 279, L47
- Abraham & van den Bergh (2001) Abraham, R. G., & van den Bergh, S. 2001, Science, 293, 1273
- Abraham et al. (1996b) Abraham, R. G., van den Bergh, S., Glazebrook, K., Ellis, R. S., Santiago, B. X., Surma, P., & Griffiths, R. E. 1996b, ApJS, 107, 1
- Agertz et al. (2009) Agertz, O., Teyssier, R., & Moore, B. 2009, MNRAS, 397, L64
- Allen et al. (2016) Allen, R. J., et al. 2017, ApJ, 834, 11
- Aniyan et al. (2016) Aniyan, S., Freeman, K. C., Gerhard, O. E., Arnaboldi, M., & Flynn, C. 2016, MNRAS, 456, 1484
- Athanassoula (1984) Athanassoula, E. 1984, Phys. Rep., 114, 319
- Athanassoula et al. (1987) Athanassoula, E., Bosma, A., & Papaioannou, S. 1987, A&A, 179, 23
- Baba et al. (2013) Baba, J., Saitoh, T. R., & Wada, K. 2013, ApJ, 763, 46
- Bassett et al. (2014) Bassett, R., et al. 2014, MNRAS, 442, 3206
- Bellocchi et al. (2012) Bellocchi, E., Arribas, S., & Colina, L. 2012, A&A, 542, 54
- Berrier et al. (2013) Berrier, J. C., et al. 2013, ApJ, 769, 132
- Bertin & Arnouts (1996) Bertin, E., & Arnouts, S. 1996, A&AS, 117, 393
- Bertin & Lin (1996) Bertin, G., & Lin, C. C. 1996, Spiral structure in galaxies a density wave theory, Cambridge, MA MIT Press, 1996 Physical description x, 271 p. ISBN0262023962
- Bertin & Romeo (1988) Bertin, G., & Romeo, A. B. 1988, A&A, 195, 105
- Birnboim & Dekel (2003) Birnboim, Y., & Dekel, A. 2003, MNRAS, 345, 349
- Bottema (2003) Bottema, R. 2003, MNRAS, 344, 358
- Bournaud & Elmegreen (2009) Bournaud, F., & Elmegreen, B. G. 2009, ApJ, 694, L158
- Broadhurst et al. (2005) Broadhurst, T., et al. 2005, ApJ, 621, 53
- Bruzual & Charlot (2003) Bruzual, G., & Charlot, S. 2003, MNRAS, 344, 1000
- Calzetti et al. (2000) Calzetti, D., Armus, L., Bohlin, R. C., Kinney, A. L., Koornneef, J., & Storchi-Bergmann, T. 2000, ApJ, 533, 682
- Cardelli et al. (1989) Cardelli, J. A., Clayton, G. C., & Mathis, J. S. 1989, ApJ, 345, 245
- Cen (2014) Cen, R. 2014, ApJ, 789, L21
- Ceverino et al. (2010) Ceverino, D., Dekel, A., & Bournaud, F. 2010, MNRAS, 404, 2151
- Chabrier (2003) Chabrier, G. 2003, PASP, 115, 763
- Colina et al. (2005) Colina, L., Arribas, S., & Monreal-Ibero, A. 2005, ApJ, 621, 725
- Conselice (2014) Conselice, C. J. 2014, ARA&A, 52, 291
- Conselice et al. (2000) Conselice, C. J., Bershady, M. A., & Jangren, A. 2000, ApJ, 529, 886
- Conselice et al. (2005) Conselice, C. J., Blackburne, J. A., & Papovich, C. 2005, ApJ, 620, 564
- Conselice et al. (2011) Conselice, C. J., Bluck, A. F. L., Ravindranath, S., Mortlock, A., Koekemoer, A. M., Buitrago, F., Grützbauch, R., & Penny, S. J. 2011, MNRAS, 417, 2770
- Courteau (1997) Courteau, S. 1997, AJ, 114, 2402
- Cresci et al. (2009) Cresci, G., et al. 2009, ApJ, 697, 115
- Davis et al. (2014) Davis, B. L., et al. 2014, ApJ, 789, 124
- Davis et al. (2012) Davis, B. L., Berrier, J. C., Shields, D. W., Kennefick, J., Kennefick, D., Seigar, M. S., Lacy, C. H. S., & Puerari, I. 2012, ApJS, 199, 33
- Davis et al. (2017) Davis, B. L., Graham, A. W., & Seigar, M. S. 2017, MNRAS, 471, 2187
- Davis et al. (2015) Davis, B. L., et al. 2015, ApJ, 802, L13
- Davis & Hayes (2014) Davis, D. R., & Hayes, W. B. 2014, ApJ, 790, 87
- Dekel et al. (2009) Dekel, A., et al. 2009, Nature, 457, 451
- Di Teodoro & Fraternali (2015) Di Teodoro, E. M., & Fraternali, F. 2015, MNRAS, 451, 3021
- Dib et al. (2006) Dib, S., Bell, E., & Burkert, A. 2006, ApJ, 638, 797
- Dicaire et al. (2008) Dicaire, I., et al. 2008, MNRAS, 385, 553
- Dobbs & Baba (2014) Dobbs, C., & Baba, J. 2014, PASA, 31, 35
- Dobbs et al. (2010) Dobbs, C. L., Theis, C., Pringle, J. E., & Bate, M. R. 2010, MNRAS, 403, 625
- D’Onghia (2015) D’Onghia, E. 2015, ApJ, 808, L8
- D’Onghia et al. (2013) D’Onghia, E., Vogelsberger, M., & Hernquist, L. 2013, ApJ, 766, 34
- Driver et al. (1998) Driver, S. P., Fernández-Soto, A., Couch, W. J., Odewahn, S. C., Windhorst, R. A., Phillipps, S., Lanzetta, K., & Yahil, A. 1998, ApJ, 496, L93
- Elmegreen (2011) Elmegreen, B. G. 2011, in EAS Publications Series, Vol. 51, EAS Publications Series, ed. C. Charbonnel & T. Montmerle, 19–30
- Elmegreen & Elmegreen (2006) Elmegreen, B. G., & Elmegreen, D. M. 2006, ApJ, 650, 644
- Elmegreen et al. (2017) Elmegreen, B. G., Elmegreen, D. M., Tompkins, B., & Jenks, L. G. 2017, ApJ, 847, 14
- Elmegreen & Thomasson (1993) Elmegreen, B. G., & Thomasson, M. 1993, A&A, 272, 37
- Elmegreen & Elmegreen (1990) Elmegreen, D. M., & Elmegreen, B. G. 1990, ApJ, 364, 412
- Elmegreen & Elmegreen (2014) Elmegreen, D. M., & Elmegreen, B. G., 2014, ApJ, 781, 11
- Elmegreen et al. (1982) Elmegreen, D. M., Elmegreen, B. G., & Dressler, A. 1982, MNRAS, 201, 1035
- Elmegreen et al. (2007) Elmegreen, D. M., Elmegreen, B. G., Ravindranath, S., & Coe, D. A. 2007, ApJ, 658, 763
- Elmegreen et al. (2005) Elmegreen, D. M., Elmegreen, B. G., Rubin, D. S., & Schaffer, M. A. 2005, ApJ, 631, 85
- Epinat et al. (2010) Epinat, B., Amram, P., Balkowski, C., & Marcelin, M. 2010, MNRAS, 401, 2113
- Federrath & Klessen (2012) Federrath, C., & Klessen, R. S. 2012, ApJ, 761, 156
- Federrath et al. (2017a) Federrath, C., et al. 2017a, in IAU Symposium, Vol. 322, The Multi-Messenger Astrophysics of the Galactic Centre, ed. R. M. Crocker, S. N. Longmore, & G. V. Bicknell, 123–128
- Federrath et al. (2017b) Federrath, C., et al. 2017b, MNRAS, 468, 3965
- Fiacconi et al. (2015) Fiacconi, D., Feldmann, R., & Mayer, L. 2015, MNRAS, 446, 1957
- Fisher et al. (2014) Fisher, D. B., et al. 2014, ApJ, 790, L30
- Fisher et al. (2017) Fisher, D. B., et al. 2017, MNRAS, 464, 491
- Förster Schreiber et al. (2009) Förster Schreiber, N. M., et al. 2009, ApJ, 706, 1364
- Förster Schreiber et al. (2006) Förster Schreiber, N. M., et al. 2006, ApJ, 645, 1062
- Freeman (2012) Freeman, K. 2012, Structure and Evolution of the Milky Way, ed. A. Miglio, J. Montalbán, & A. Noels, 137
- Freeman & Bland-Hawthorn (2002) Freeman, K., & Bland-Hawthorn, J. 2002, ARA&A, 40, 487
- Genel et al. (2012) Genel, S., Dekel, A., & Cacciato, M. 2012, MNRAS, 425, 788
- Genel et al. (2015) Genel, S., Fall, S. M., Hernquist, L., Vogelsberger, M., Snyder, G. F., Rodriguez-Gomez, V., Sijacki, D., & Springel, V. 2015, ApJ, 804, L40
- Genel et al. (2014) Genel, S., et al. 2014
- Genzel et al. (2017) Genzel, R., et al. 2017, Nature, 543, 397
- Genzel et al. (2011) Genzel, R., et al. 2011, ApJ, 733, 101
- Ghosh & Jog (2015) Ghosh, S., & Jog, C. J. 2015, MNRAS, 451, 1350
- Giavalisco et al. (1996) Giavalisco, M., Livio, M., Bohlin, R. C., Macchetto, F. D., & Stecher, T. P. 1996, AJ, 112, 369
- Glazebrook (2013) Glazebrook, K. 2013, PASA, 30, e056
- Goldreich & Lynden-Bell (1965) Goldreich, P., & Lynden-Bell, D. 1965, MNRAS, 130, 125
- Grand et al. (2015) Grand, R. J. J., Kawata, D., & Cropper, M. 2015, MNRAS, 447, 4018
- Grand et al. (2016) Grand, R. J. J., et al. 2016, MNRAS, 460, L94
- Green et al. (2010) Green, A. W., et al. 2010, Nature, 467, 684
- Green et al. (2014) Green, A. W., et al. 2014, MNRAS, 437, 1070
- Hammer et al. (2009) Hammer, F., Flores, H., Puech, M., Yang, Y. B., Athanassoula, E., Rodrigues, M., & Delgado, R. 2009, A&A, 507, 1313
- Hart et al. (2017) Hart, R. E., et al. 2017, MNRAS, 472,2263
- Hibbard & Vacca (1997) Hibbard, J. E., & Vacca, W. D. 1997, AJ, 114, 1741
- Hubble (1926) Hubble, E. P. 1926, ApJ, 64
- Hung et al. (2015) Hung, C.-L., et al. 2015, ApJ, 803, 62
- Ilbert et al. (2010) Ilbert, O., et al. 2010, ApJ, 709, 644
- Inoue & Yoshida (2017) Inoue, S., & Yoshida, N. 2017, arXiv:1706.01895
- Johnson et al. (2017) Johnson, H. L., et al. 2017, arXiv:1707.02302
- Jones et al. (2010a) Jones, T., Ellis, R., Jullo, E., & Richard, J. 2010a, ApJ, 725, L176
- Jones et al. (2010b) Jones, T. A., Swinbank, A. M., Ellis, R. S., Richard, J., & Stark, D. P. 2010b, MNRAS, 404, 1247
- Julian & Toomre (1966) Julian, W. H., & Toomre, A. 1966, ApJ, 146, 810
- Jullo et al. (2007) Jullo, E., Kneib, J.-P., Limousin, M., Elíasdóttir, Á., Marshall, P. J., & Verdugo, T. 2007, New Journal of Physics, 9, 447
- Kalnajs (1971) Kalnajs, A. J. 1971, ApJ, 166, 275
- Kennicutt (1981) Kennicutt, Jr., R. C. 1981, AJ, 86, 1847
- Kennicutt (1998) —. 1998, ApJ, 498, 541
- Kneib et al. (1993) Kneib, J. P., Mellier, Y., Fort, B., & Mathez, G. 1993, A&A, 273, 367
- Kormendy & Norman (1979) Kormendy, J., & Norman, C. A. 1979, ApJ, 233, 539
- Kraljic et al. (2012) Kraljic, K., Bournaud, F., & Martig, M. 2012, ApJ, 757, 60
- Krumholz & Burkhart (2016) Krumholz, M. R., & Burkhart, B. 2016, MNRAS, 458, 1671
- Krumholz et al. (2017) Krumholz, M. R., Burkhart, B., Forbes, J. C., & Crocker, R. M. 2017, arXiv:1706.00106
- Lang et al. (2017) Lang, P., et al. 2017, ApJ, 840, 92
- Law et al. (2012) Law, D. R., Shapley, A. E., Steidel, C. C., Reddy, N. A., Christensen, C. R., & Erb, D. K. 2012, Nature, 487, 338
- Law et al. (2007) Law, D. R., Steidel, C. C., Erb, D. K., Larkin, J. E., Pettini, M., Shapley, A. E., & Wright, S. A. 2007, ApJ, 669, 929
- Law et al. (2009) Law, D. R. et al. 2009, ApJ, 697, 2057
- Leethochawalit et al. (2016) Leethochawalit, N., Jones, T. A., Ellis, R. S., Stark, D. P., Richard, J., Zitrin, A., & Auger, M. 2016, ApJ, 820, 84
- Lehnert et al. (2009) Lehnert, M. D., Nesvadba, N. P. H., Le Tiran, L., Di Matteo, P., van Driel, W., Douglas, L. S., Chemin, L., & Bournaud, F. 2009, ApJ, 699, 1660
- Limousin et al. (2007) Limousin, M., et al. 2007, ApJ, 668, 643
- Lin & Shu (1964) Lin, C. C., & Shu, F. H. 1964, ApJ, 140, 646
- Lindblad (1960) Lindblad, P. O. 1960, Stockholms Observatoriums Annaler, 21, 4
- Livermore et al. (2015) Livermore, R. C., et al. 2015, MNRAS, 450, 1812
- Martig et al. (2012) Martig, M., Bournaud, F., Croton, D. J., Dekel, A., & Teyssier, R. 2012, ApJ, 756, 26
- Martinez-Medina et al. (2015) Martinez-Medina, L. A., Pichardo, B., Pérez-Villegas, A., & Moreno, E. 2015, ApJ, 802, 109
- McGregor et al. (2003) McGregor, P. J., et al. 2003, in Proc. SPIE, Vol. 4841, Instrument Design and Performance for Optical/Infrared Ground-based Telescopes, ed. M. Iye & A. F. M. Moorwood, 1581–1591
- Nair & Abraham (2010) Nair, P. B., & Abraham, R. G. 2010, ApJS, 186, 427
- Nelson et al. (2013) Nelson, D., Vogelsberger, M., Genel, S., Sijacki, D., Kereš, D., Springel, V., & Hernquist, L. 2013, MNRAS, 429, 3353
- Peng et al. (2010) Peng, Y., et al. 2010, ApJ, 721, 193
- Pour-Imani et al. (2016) Pour-Imani, H., Kennefick, D., Kennefick, J., Davis, B. L., Shields, D. W., & Shameer Abdeen, M. 2016, ApJ, 827, L2
- Rafikov (2001) Rafikov, R. R. 2001, MNRAS, 323, 445
- Reynolds (1927) Reynolds, J. H. 1927, The Observatory, 50, 185
- Rigby et al. (2017) Rigby, J. R., et al. 2017, ApJ, 843, 79
- Rodrigues et al. (2017) Rodrigues, M., Hammer, F., Flores, H., Puech, M., & Athanassoula, E. 2017, MNRAS, 465, 1157
- Salo & Laurikainen (1993) Salo, H., & Laurikainen, E. 1993, ApJ, 410, 586
- Sandage (2005) Sandage, A. 2005, ARA&A, 43, 581
- Seigar et al. (2014) Seigar, M. S., Davis, B. L., Berrier, J., & Kennefick, D. 2014, ApJ, 795, 90
- Sellwood (2004) Sellwood, J. A. 2004, Dynamics of Astrophysical Discs, 275
- Sellwood (2011) Sellwood, J. A. 2011, MNRAS, 410, 1637
- Sellwood (2014) Sellwood, J. A. 2014, Reviews of Modern Physics, 86, 1
- Sellwood & Binney (2002) Sellwood, J. A., & Binney, J. J. 2002, MNRAS, 336, 785
- Shapiro et al. (2008) Shapiro, K. L., et al. 2008, ApJ, 682, 231
- Shibuya et al. (2016) Shibuya, T., Ouchi, M., Kubo, M., & Harikane, Y. 2016, ApJ, 821, 72
- Shields et al. (2015) Shields, D. W., et al. 2015, arXiv:1511.06365
- Shu (2016) Shu, F. H. 2016, ARA&A, 54, 667
- Stark et al. (2008) Stark, D. P., Swinbank, A. M., Ellis, R. S., Dye, S., Smail, I. R., & Richard, J. 2008, Nature, 455, 775
- Storchi-Bergmann et al. (2009) Storchi-Bergmann, T., McGregor, P. J., Riffel, R. A., Simões Lopes, R., Beck, T., & Dopita, M. 2009, MNRAS, 394, 1148
- Swinbank et al. (2007) Swinbank, A. M., Bower, R. G., Smith, G. P., Wilman, R. J., Smail, I., Ellis, R. S., Morris, S. L., & Kneib, J.-P. 2007, MNRAS, 376, 479
- Swinbank et al. (2017) Swinbank, A. M., et al. 2017, MNRAS, 467, 3140
- Swinbank et al. (2012) Swinbank, A. M., Smail, I., Sobral, D., Theuns, T., Best, P. N., & Geach, J. E. 2012, ApJ, 760, 130
- Swinbank et al. (2015) Swinbank, M., et al. 2015, ApJ, 806, 17
- Tacconi et al. (2013) Tacconi, L. J., et al. 2013, ApJ, 768, 74
- Toomre (1964) Toomre, A. 1964, ApJ, 139, 1217
- Toomre (1977) Toomre, A. 1977, ARA&A, 15, 437
- van den Bergh et al. (2002) van den Bergh, S., Abraham, R. G., Whyte, L. F., Merrifield, M. R., Eskridge, P. B., Frogel, J. A., & Pogge, R. 2002, AJ, 123, 2913
- Vanzella et al. (2017) Vanzella, E., et al. 2017, MNRAS, 467, 4304
- Wada et al. (2011) Wada, K., Baba, J., & Saitoh, T. R. 2011, ApJ, 735, 1
- Willett et al. (2013) Willett, K. W., et al. 2013, MNRAS, 435, 2835
- Wisnioski et al. (2015) Wisnioski, E., et al. 2015, ApJ, 799, 209
- Wuyts et al. (2011) Wuyts, S., et al. 2011, ApJ, 742, 96
- Yuan et al. (2015) Yuan, T., Kobayashi, C., & Kewley, L. J. 2015, ApJ, 804, L14
- Yuan et al. (2013a) Yuan, T.-T., Kewley, L. J., & Rich, J. 2013a, ApJ, 767, 106
- Yuan et al. (2013b) Yuan, T.-T., Kewley, L. J., & Richard, J. 2013b, ApJ, 763, 9
- Yuan et al. (2012) Yuan, T.-T., Kewley, L. J., Swinbank, A. M., & Richard, J. 2012, ApJ, 759, 66
- Yuan et al. (2011) Yuan, T.-T., Kewley, L. J., Swinbank, A. M., Richard, J., & Livermore, R. C. 2011, ApJ, 732, L14+
- Zahid et al. (2012) Zahid, H. J., Dima, G. I., Kewley, L. J., Erb, D. K., & Davé, R. 2012, ApJ, 757, 54
- Zhou et al. (2017) Zhou, L., Federrath, C., Yuan, T., et al., 2017, MNRAS, 470, 4573