11email: baobabyoo@gmail.com 22institutetext: Department of Physics, State University of New York at Fredonia, 280 Central Ave, Fredonia, NY 14063 33institutetext: Harvard-Smithsonian Center for Astrophysics, 60 Garden Street, Cambridge, MA 02138, USA 44institutetext: Lunar and Planetary Laboratory, University of Arizona, Tucson, AZ 85721, USA 55institutetext: SKA Organisation, Jodrell Bank Observatory, Lower Withington, Macclesfield SK11 9DL, UK 66institutetext: Institute of Astronomy and Astrophysics, Academia Sinica, 11F of Astronomy-Mathematics Building, National Taiwan University, No 1, Sec., Roosevelt Road, Taipei, 10617 Taiwan 77institutetext: Astrophysics Research Institute, Liverpool John Moores University, IC2, Liverpool Science Park, 146 Brownlow Hill, Liverpool L3 5RF, UK 88institutetext: Instituto de Radioastronomía y Astrofísica, UNAM, A.P. 3-72, Xangari, Morelia, 58089, Mexico 99institutetext: Centre for Astrophysics Research, School of Physics, Astronomy and Mathematics, University of Hertfordshire, College Lane, Hatfield AL10 9AB, UK 1010institutetext: Institut de Ciències de l’Espai (IEEC-CSIC), Can Magrans, S/N, E-08193 Cerdanyola del Vallés, Catalonia, Spain 1111institutetext: Space Telescope Science Institute, Baltimore, MD 21218, USA 1212institutetext: Konkoly Observatory, Research Centre for Astronomy and Earth Sciences, Hungarian Academy of Sciences, Hungarian Academy of Science, Konkoly-Thege Miklósút 15-17, 1121 Budapest, Hungary 1313institutetext: Max-Planck-Institut för Astronomie, Königstuhl 17, D-69117 Heidelberg, Germany 1414institutetext: Institute of Fluid Mechanics and Heat Transfer, TU Wien, 1060 Vienna, Austria 1515institutetext: Department of Astrophysics, University of Vienna, Vienna 1180, Austria 1616institutetext: Research Institute of Physics, Southern Federal University, Rostov-on-Don 344090, Russia
A 1.3 mm SMA Survey of 29 Variable Young Stellar Objects
Abstract
Context. Young stellar objects (YSOs) may undergo periods of active accretion (outbursts), during which the protostellar accretion rate is temporarily enhanced by a few orders of magnitude. Whether or not these accretion outburst YSOs possess similar dust/gas reservoirs to each other, and whether or not their dust/gas reservoirs are similar as quiescent YSOs, are issues not yet clarified.
Aims. The aim of this work is to characterize the millimeter thermal dust emission properties of a statistically significant sample of long and short duration accretion outburst YSOs (i.e., FUors and EXors) and the spectroscopically identified candidates of accretion outbursting YSOs (i.e., FUor-like objects).
Methods. We have carried out extensive Submillimeter Array (SMA) observations mostly at 225 GHz (1.33 mm) and 272 GHz (1.10 mm), from 2008 to 2017. We covered accretion outburst YSOs located at 1 kpc distances from the solar system.
Results. We analyze all the existing SMA data of such objects, both published and unpublished, in a coherent way to present a millimeter interferometric database of 29 objects. We obtained 21 detections at 3- significance. Detected sources except for the two cases of V883 Ori and NGC 2071 MM3 were observed with 1′′ angular resolution. Overall our observed targets show a systematically higher millimeter luminosity distribution than those of the 0.3 Class II YSOs in the nearby (400 pc) low-mass star-forming molecular clouds (e.g., Taurus, Lupus, Upp Scorpio, and Chameleon I). In addition, at 1 mm our observed confirmed binaries or triple-system sources are systematically fainter than the rest of the sources even though their 1 mm fluxes are broadly distributed. We may have detected 30-60% millimeter flux variability from V2494 Cyg and V2495 Cyg, from the observations separated by 1 year.
Conclusions.
Key Words.:
Stars: formation — radio continuum: ISM — submillimeter: ISM — stars: variables: T Tauri, Herbig Ae/Be1 Introduction
|
|
|
|
|
|
|
|
|
|
|
|

|

|
|
|
|
|
|
|
|
|
|
|
|
|
|

|
|
|
Previous optical and infrared (OIR) monitoring observations have detected luminous outbursts from some young stellar objects (YSOs; for a recent review see Audard et al. 2014). These outbursts are commonly interpreted as due to a temporarily increased accretion rate onto the host YSO, resulting in an enhanced accretion shock luminosity. The YSOs which have longer outburst duration (a few tens of years or longer) are referred to as FU Orionis objects (FUors, hereafter) after the archetype source FU Ori (see Hartmann & Kenyon 1996 for a review). Those which have shorter outburst duration (a few hundred days to a few years), and sometimes present repetitive outburst events, are referred to as EXors after the archetype source EX Lupi (see Herbig 1977 for a review). We note that whether or not there is a well defined boundary to separate FUors and EXors is yet uncertain (e.g., Kóspál et al. 2011b). There are also objects which present OIR spectral features similar to FUors although no OIR outbursts events were detected for them in monitoring observations. They are referred to as FUor-like objects, of which the accretion outburst may have been onset before humans started to quantitatively record the OIR brightness (see discussion in Hartmann & Kenyon 1996). There are indirect evidences suggesting accretion bursts are common throughout the embedded stage, and that FUors are the optical manifestation of that process (e.g., Dunham & Vorobyov 2012 and references therein).
The OIR outburst events are rare, and a majority of them are located at several hundreds parsec distances from the solar system. In the early 1980s there were only a handful of YSOs with confirmed OIR outbursts. Thanks to the persistent OIR monitoring surveys to discover more of them over the last few decades, now it becomes possible to study a large sample of accretion outburst YSOs in systematic surveys. We refer to Audard et al. (2014) for a thorough summary about the emission properties of these accretion outburst YSOs at 100 m wavelengths.
|
 |
 |
 |
 |
 |
 |
 |
To understand the bulk properties of the cool gas/dust reservoirs which are feeding accretion outbursts (e.g., circumstellar disks, inner envelopes), observations in the dust optically thin regime (e.g., mm wavelengths) are necessary. Previous far infrared and submillimeter surveys of this type of YSOs were done with single-dish observations which lacked the angular resolution to properly resolve the dust emission and were affected by cloud contamination and dust optical depth effects (e.g., Sanders & Weintraub 2001; Green et al. 2013). There are numerous higher angular resolution interferometric observations at submillimeter and millimeter bands towards individual target sources (e.g., Lim & Takakuwa 2006; Alonso-Albi et al. 2009; Pérez et al. 2010; Kóspál 2011b; Dunham et al. 2012; Hales et al. 2015; Cieza et al. 2016; Kóspál et al. 2017; Lim et al. 2016; Liu et al. 2016a; Liu et al. 2017; Zurlo et al. 2017; Ruíz-Rodríuez et al. 2017). However, a systematic comparison of the (sub)millimeter emission property from high angular resolution observations is still lacking.
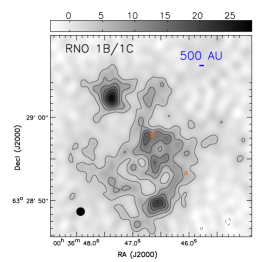
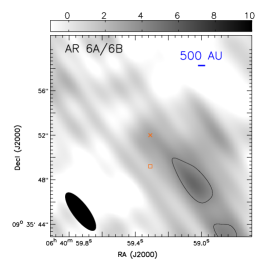
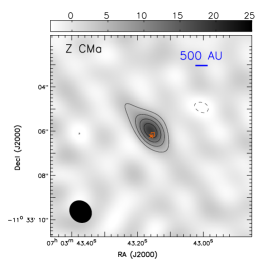
From our extensive observations using the Submillimeter Array (SMA)111 The Submillimeter Array is a joint project between the Smithsonian Astrophysical Observatory and the Academia Sinica Institute of Astronomy and Astrophysics, and is funded by the Smithsonian Institution and the Academia Sinica (Ho et al. 2004). we compile a sample of 29 accretion outburst YSOs (FUors, EXor, and FUor-like objects) except for the active accretion YSO IRAS 20588+5215N which has a less well clarified nature (Aspin et al. 2009). We have also processed the archival SMA observations of these types of objects. The observed target sources are summarized in Table 1. The selected target AR 6A/6B is a visual binary object, of which both of the host YSOs are FUor-like objects. For the visual binary Z CMa, one host protostar is a repetitive short-duration outburst YSO while the other is a FUor-like object. The sources RNO 1B and 1C were previously considered as binary outburst sources. However, they are 5000 AU apart and are in fact located in a condensed low-mass cluster-forming regions (e.g., Staude & Neckel 1991; Anglada et al. 1994; Quanz et al. 2007). They should be regarded as independent sources, of which the binarity is not yet resolved. We refer to Audard et al. (2014), Gramajo et al. (2014), and references therein for the properties of the selected target sources, and omit duplicating those descriptions.
Most of these observations were carried out at the central frequencies of 225 GHz (1.33 mm) and 271 GHz (1.1 mm), which can be compared with the recent Atacama Large Millimeter Array (ALMA) 1.33 mm surveys of Class II YSOs in the nearby molecular clouds, and can be compared with the 0.88 mm surveys after adopting certain assumed (sub)millimeter spectral indices (e.g., Carpenter et al. 2014; Ansdell et al. 2016; Pascucci et al. 2016; Ansdell et al. 2017; and see also Andrews et al. 2013). The majority of our target sources were observed with 1′′ synthesized beams, which is sufficient for tracing dust emission from their circumstellar disks and inner envelopes. The presented observations and the details of data reduction are introduced in Section 2. We summarize the spatially resolved structures, the continuum emission, and the time variability of millimeter fluxes of a subset of sources in Section 3.1, 3.2, and 3.3, respectively. The present paper intends to focus on presenting measurements. Nevertheless, we briefly provide our preliminary hypotheses to explain some identified features from our observations in Section 4. We defer the detailed analysis of (sub)millimeter spectral energy distributions (SEDs) to forthcoming papers. Our conclusion is given in Section 5. Appendix A presents a summary for our SMA observations. Appendix B introduces the millimeter flux variability of some sources which were observed in multiple epochs but have limited data quality. Appendix C archives the visibility amplitude distributions of some sources that are not addressed in the main text.
2 Observations
Extensive SMA observations at 1 mm band towards FU Orionis objects and EXors were carried out from 2008 to 2014, under the management of Michael Dunham (Project codes: 2011A-S030, 2013A-S085 , 2013B-S078, 2013B-S092, 2014A-S011, 2015A-S065, 2015B-S078), Hauyu Baobab Liu (Project codes: 2013B-A004, 2014B-A001), Tyler Bourke (Project code: 2008B-S002, 2013A-S057), Naomi Hirano (Project code: 2013A-A018), and Steve Longmore (2008A-S101, 2009A-S066). We also retrieved archival data of the two sources V883 Ori and V1647 Ori taken by Dave Principe (unknown project code) and un-identified PIs from 2004 to 2012. The observations of HBC 722 taken from project 2011A-S030 have been reported in Dunham et al. (2012). The observations of FU Ori taken from projects 2008B-S002 and 2013B-A004 have been reported in Liu et al. (2017). The observations of EXors taken from project 2014B-A001 have been reported in Liu et al. (2016a). A brief summary including all the observational setups is provided in Appendix A for the sake of the integrity of information. We have re-calibrated some of the already reported data or have re-imaged them for our present purposes.
Some of these observations were carried out with a track-sharing observational strategy. All of these observations utilized the Application-Specific Integrated Circuit (ASIC) correlator, which provided 4–8 GHz intermediate frequency (IF) coverages in the upper and the lower sidebands, with 48 spectral windows in each sideband. Some observations taken after January of 2015 further include the SMA Wideband Astronomical ROACH2 Machine (SWARM) correlator, which provided two additional spectral windows covering the 8-9.5 GHz and 10.5-12 GHz IFs, respectively. However, we omit using data in the 10.5-12 GHz IF because of poor response, which was also pointed out in Liu et al. (2016a). Not all of the presented observations were originally carried out for the same scientific purposes. In addition, some of these observations were taken utilizing filler observing time, during when the spectral tunings had to follow those of the regular time projects. Therefore, there are deviations of the central frequencies. Nevertheless, the local oscillator frequencies of most of these observations are either in the range of 224-225 GHz (1.33 mm; e.g., for simultaneously observing the 12CO 2-1 isotopologues), or are in the range of 271-272 GHz (1.10 mm; e.g., for simultaneously observing HCN/HCO+/N2H+ lines). We will conveniently refer to the former as 225 GHz observations, and the later as 272 GHz observations, since we do not have enough of accuracy to distinguish flux measurements at 1 GHz frequency offsets. The differences in the observing wavelength is not particularly significant in terms of our major science purpose of constraining the dust emission around 1 mm wavelength (more discussion in Section 3 and 4). For similar reasons, the projected baseline lengths covered by the observations of individual sources can be very different, which do have an impact on our interpretation. We will provide fair and relevant cautions at the related scientific analysis and discussion.
 |
 |
 |
 |
 |
We followed the standard data calibration strategy of SMA. The application of system temperature (T) information and the absolute flux, passband, and gain calibrations were carried out using the MIR IDL software package (Qi 2003). The absolute flux scalings were derived by comparing the visibility amplitudes of the gain calibrators with those of the absolute flux standard sources of SMA, which are planets or planet moons (i.e., the ‘Flux cal.’ column in Table 2). After calibration, the zeroth-order fitting of continuum levels from line-free channels and the joint weighted imaging of all continuum data were performed using the Miriad software package (Sault et al. 1995). We performed zeroth-order multi-frequency imaging combining the upper- and lower-sideband data, to produce sensitive continuum image at the central observing frequency (i.e., the local oscillator frequency). We used a 005 cell size and 2048 pixels in each spatial dimension when creating all images. The cell size is representative to the fit errors of any coordinates or image component sizes in general. Primary beam attenuation was corrected using the linmos task of the Miriad software package.
In most of our flux measurements, we quote a nominal 10% absolute flux error in the case that it is larger than the 1- thermal noise (in terms of Jy beam-1), and quote the 1- thermal noise in the rest of the cases. However, for some observations which were carried out in relatively poor weather conditions (e.g., 0.2, or in conditions with high phase dispersion), we quote up to 25% absolute flux error in the case that it is larger than the 1- thermal noise according to our experiences. We also note that for observations in high phase dispersion weather conditions, for example, some filler time observations at 6-7 pm Hawaii time, the baseline length dependent phase de-coherence (for more discussion see Pérez et al. 2010) can artificially cause the azimuthally-averaged visibility amplitude decrease with uv distance. In most of our observations, the effect of phase de-coherence is not significant in the short baselines, and therefore does not significantly bias our flux measurements. However, the degraded azimuthally-averaged visibility amplitudes can artificially make the sources appear slightly spatially resolved both in the image and in the visibility domain. In the following sections, we will clarify our concern about data quality and potential defects whenever they are relevant.
3 Results
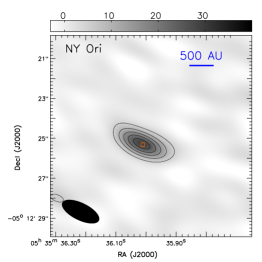
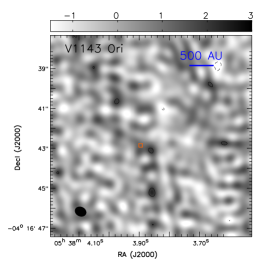
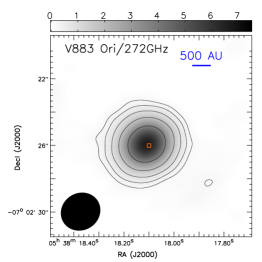
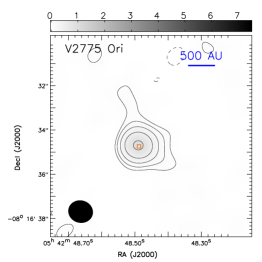
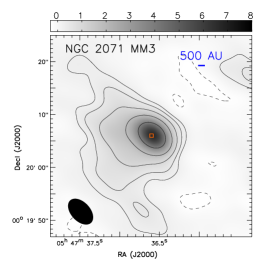
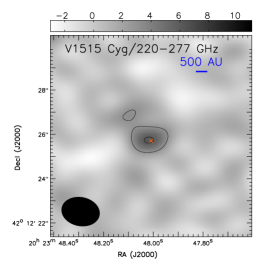
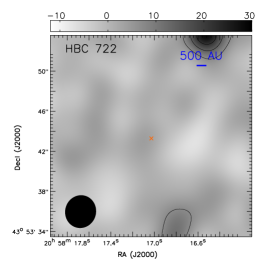
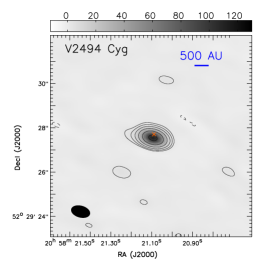
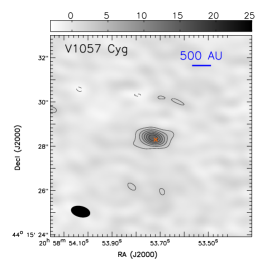
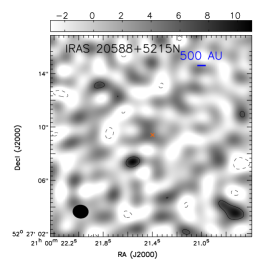
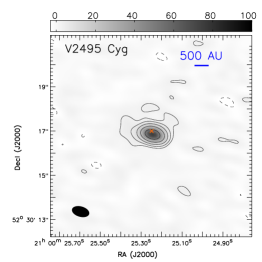
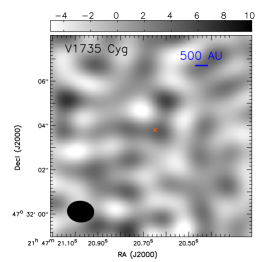
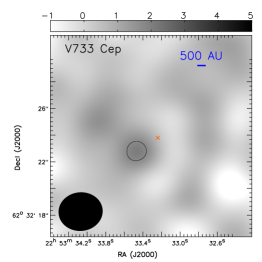
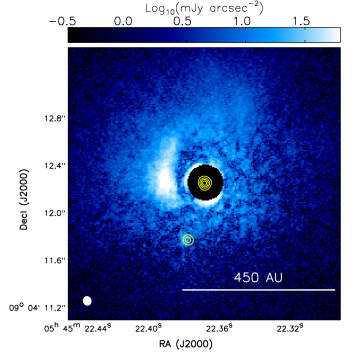
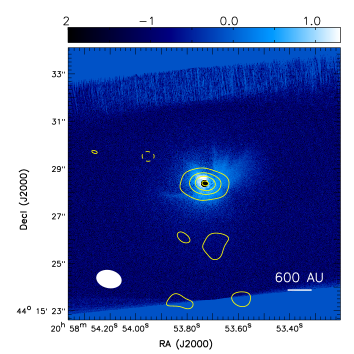
We present in Figure 1 and 2 the SMA images of the 1.3 or 1.1 mm continuum emission of the observed sources. For FU Ori, Z CMa and V1057 Cyg, we provide a comparison of our available millimeter images with the previously reported Subaru-HiCIAO near infrared coronagraphic polarization intensity images (Liu et al. 2016b) in Figure 3. Details of the resolved continuum emission structures are described in Section 3.1. The continuum flux measurements for the circumstellar material are introduced in Section 3.2. Our flux measurements are summarized in Table 1. Some of our target sources were observed at the same or similar frequencies in multiple epochs. We discuss their millimeter flux variability/stability in Section 3.3 and Appendix B. The visibility amplitudes for sources which are not discussed in the text are provided in Appendix C.
 |
 |
 |
 |
3.1 Continuum structures
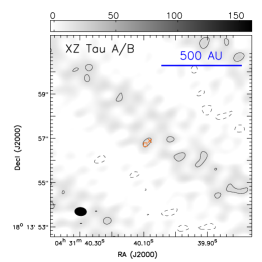
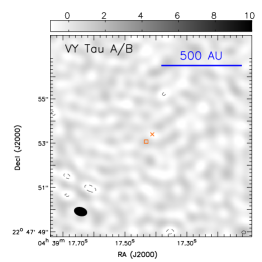
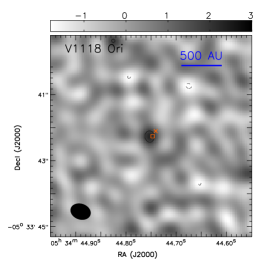
XZ Tau was observed with a short integration time thus was limited by the poor uv coverage. Since a very bright millimeter emission source HL Tau was located at the edge of the SMA field of view when we observed XZ Tau, our image of XZ Tau is very seriously confused with imaging defects. From Figure 1 we see that XZ Tau A and B are enclosed in a 3- contour. We tentatively consider that XZ Tau A and B are detected in the SMA observations, although the reported flux in Table 1 should be regarded as an upper limit due to the confusion. Osorio et al. (2016) reported that the 1.3 mm flux from the inner 3 AU radius around XZ Tau B is 72 mJy, although this source is located outside of the primary beam of their reported ALMA observations. The sources RNO 1B and 1C are located in a very condensed low-mass cluster-forming environment (Anglada et al. 1994; Quanz et al. 2007a; Juárez et al. in prep.) Our SMA observations towards these sources show that RNO 1C is associated with a 5000 AU scale clumpy gas/dust toroid; and RNO 1B is associated with a 5000 AU scale gas/dust arm which connects to the clumpy toroid from the south (Figure 1). Due to the limited angular resolution of our SMA observations, we cannot separate the millimeter emission of the cirucmstellar material of RNO 1B and 1C from these extended structures. Therefore, their millimeter fluxes are considered as upper limits. We do not detect millimeter continuum emission from VY Tau, V1143 Ori, AR 6a, AR 6b, HBC 722, IRAS 20588+5215N, V1735 Cyg, and V733 Cep.
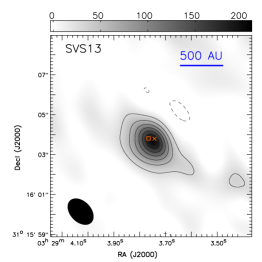
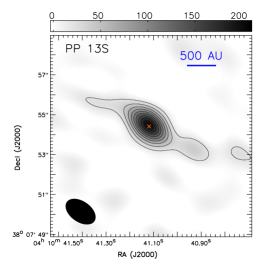
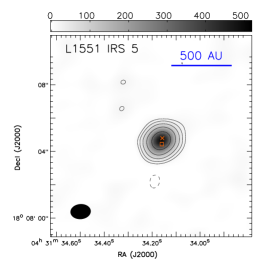
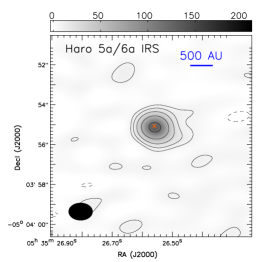
For the rest of the observed sources, SVS 13A, PP 13S, Haro 5a/6a IRS, V2775 Ori, NGC 2071 MM3, and Z CMa are resolved to be associated with 1000 AU scales, spatially asymmetric dust/gas structures, which may be the innermost parts of their residual circumstellar envelope. This is consistent with the fact that these sources were previously considered as Class I YSOs (Table 1). It is worth noting that such extended arm-like feature was also spatially resolved in the the Atacama Large Millimeter Array (ALMA) observations of 13CO 2-1 towards the nearby low-mass YSO, HL Tau (Yen et al. 2017; see also Welch et al. 2000). L1551 IRS 5 is associated with a 1000 AU scale envelope (e.g., Saito et al. 1996; Looney et al. 1997; Momose et al. 1998; Chou et al. 2014), which however was largely filtered out in our SMA continuum observations due to missing short-spacing data. The millimeter emission of the rest of the detected sources appears to be dominated by spatially compact (e.g., disk-like) structures; some of them are spatially marginally resolved (V883 Ori, NY Ori, V1057 Cyg). V2494 Cyg and V2495 Cyg present spatially unresolved compact sources immediately surrounded by spatially asymmetric or clumpy structures. The higher angular resolution (005-05) millimeter continuum observations of FU Ori, V883 Ori, V2775 Ori, XZ Tau and PP 13S have been reported by Hales et al. (2015), Liu et al. (2017), Cieza et al. (2016), Zurlo et al. (2017), Osorio et al. (2016), and Pérez et al. (2010).
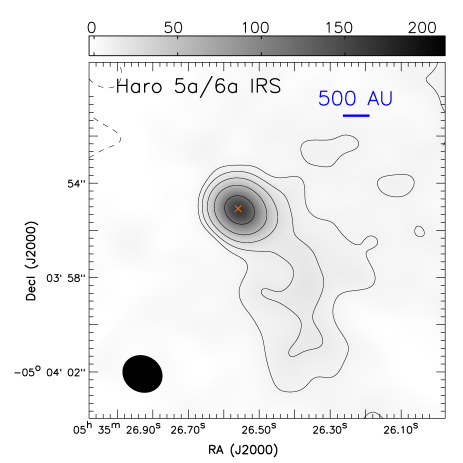
All objects with elongated emission appear to be of Class I type, implying possible interactions with parental clouds/filaments. Whether these elongated structures present injections of gas/dust from surroundings or ejections from the disk (e.g., Vorobyov 2016) remains to be understood (Akiyama et al. 2017, in prep.) In the SMA image created at lower angular resolution (Figure 3), the extended millimeter emission around Z CMa appears more significant and presents a 4000 AU scale arm-like structure extending from Z CMa toward the south. The previously reported arm-like structure around Z CMa in the near infrared polarization coronagraphic image (Canovas et al. 2015; Liu et al. 2016b) is projectedly the innermost part of this 4000 AU scale arm-like structure. The previous JCMT-SCUBA 450 m and 850 m continuum observations show that these structures are further connected with a 2′ (105 AU) scale elongated gas structure which has an east-west alignment (Sandell & Weintraub 2001). The lower angular resolution SMA image of Haro 5a/6a IRS also revealed a 3000 AU scale arm-like structure which extends from Haro 5a/6a IRS to the south (Figure 4). The dominant millimeter emission source around V1057 Cyg is spatially compact in our SMA observations. However, we detected several millimeter emission clumps south of it (Figure 3). The most significant one is marginally spatially resolved, which may have 500-1000 AU size scales. The previous JCMT-SCUBA 450 m and 850 m continuum observations show that V1057 Cyg is associated with a 2′ (7.2 104 AU) scale elongated gas structure which has a north-south alignment (Sandell & Weintraub 2001). SVS 13A and PP 13S are also connected with exterior gas filaments (Sandell & Knee 2001; Sandell & Weintraub 2001). Our SMA observations do not have fine enough uv coverages to address the detailed geometry of the extended emission on a few arcsecond scales around SVS 13A and PP 13S (Figure 1).
3.2 Millimeter fluxes
We measured millimeter fluxes of the detected sources in the image domain by performing two-dimensional Gaussian fits. The synthesized beams of individual SMA images, and the obtained millimeter source sizes, fluxes, and positions, are summarized in Table 1. We note that fitting fluxes from visibility amplitudes cannot be systematically applied to all of our targets, since some structures around them can significantly contribute to the visibility amplitudes, and it is not easy to subtract them off due to our limited uv coverage. Based on previous radio observations towards a subset of our sample (Rodriguez et al. 1990; Liu et al. 2017), and the previous surveys of radio emission from Class 0-III YSOs (e.g., Liu et al. 2014; Dzib et al. 2015), we consider the millimeter flux contributed from free-free emission to be negligible.
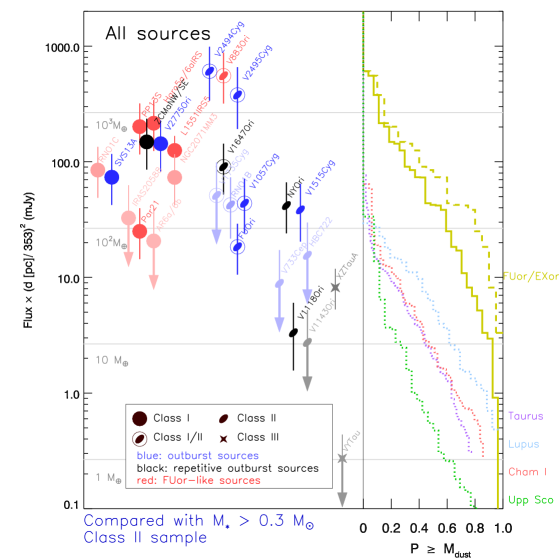
We measured the flux of the central compact source using the peak intensity per synthesized beam (i.e., the ‘peak intensity’ column from Table 1), as these values are approximately the same (as long as the spatial extension is absent or marginal), but the peak intensity measurements suffer less from contaminating emission from more extended components. Figure 5 compares the fluxes of the central compact objects embedded in the observed sources. The binary or multiple systems which cannot be spatially resolved with our SMA observations are presented with only one symbol. The integrated fluxes derived from two-dimensional Gaussian fits can be significantly biased by the extended structures, which also depend on the angular resolution of our images (for some discussion see Dunham et al. 2014). On the other hand, we found that the ‘peak intensity’ returned from the two-dimensional Gaussian fit tends to be very close to the maximum pixel value in the image, which is less or not sensitive to angular resolution in most of our observed cases. However, for the case of L1551 IRS 5, we quoted its ‘integrated flux’ instead since it is located at a nearer distance (140 pc) than most of the observed sources. The shortest uv distance for L1551 IRS 5 (30 ) traces a similar spatial scale as the 100 baseline observations on sources in the Orion molecular cloud (420 pc). Quoting the ’peak intensity’ for L1551 IRS 5 will reduce its flux by 30%, which will not significantly affect our scientific discussion. For the other marginally spatially resolved sources V1057 Cyg, Z CMa, NGC 2071 MM3, V2775 Ori, V883 Ori, NY Ori, Haro 5a/6a IRS, SVS 13A, and PP 13S (Table 1), quoting ‘peak intensity’ potentially leads to an underestimate of the millimeter flux of their circumstellar material by 20%. Given the widely spread millimeter luminosity of our observed sample over a range of 3 orders of magnitude, such 20% underestimates will not significantly bias the presentation of Figure 5 and our following discussion.
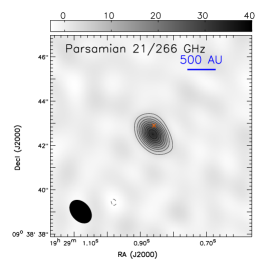
When generating Figure 5, we have scaled the observed flux of Parsamian 21 from 272 GHz to 225 GHz by assuming a spectral index . Our assumption of is motivated by the previous observations towards FU Ori (Liu et al. 2017; for a review of dust opacity see Draine 2003). For scaling 272 GHz measurement to 225 GHz measurement, assuming the extreme values 4.0 and 2.0, the scaling factors are 0.47 and 0.68, respectively. This is merely a 10% error thanks to the small frequency range we probed, and is not significant as compared with our assumed uncertainties. In addition, we scaled the plotted flux of each source by ( [pc] / 353 [pc])2, where is the source distance and 353 pc is the parallax distance of FU Ori (Gaia Collaboration 2016). The vertical error bars incorporate a normal 10% distance error for Taurus sources and 20% for the rest of the sources, and the measurement errors (Section 2). For a sense of the distance uncertainty we note that prior to the Gaia data release, FU Ori was usually considered to be at a 450 pc distance (Auddard et al. 2014) and that the updated distance by Gaia is 78% of it. We denote the rescaled flux by . We may potentially underestimate the distance of Z CMa by a factor of 2 (Audard et al. 2014; Gramajo et al. 2014), and thereby underestimate its by a factor of 4.
From Figure 5, we see that the millimeter emission of the archetype long duration outburst source, FU Ori, is in fact relatively faint as compared with the rest of the detected FUor or FUor-like objects. The non-detections of V1143 Ori and VY Ori constrained their millimeter luminosity to be considerably lower than that of FU Ori. Our 3- upper limits for HBC 722 (see Dunham et al. 2012; Kóspál et al. 2016; Dunham et al. in prep.), V733 Cep, V1735 Cyg, AR 6a, AR 6b, and IRAS 20588+5125N are still consistent with the objects having a millimeter luminosity similar to that of FU Ori but are presently not yet detected either due to their larger distances or were observed with higher thermal noise levels. The previously reported silicate-emission type objects (FU Ori, Parsamian 21, V1057 Cyg, V1515 Cyg, V1647 Ori, XZ Tau) appear systematically less luminous than the silicate-absorption type objects (Z CMa, L1551 IRS 5, RNO 1B, RNO 1C, V1735 Cyg, V883 Ori) at 1 mm, although their millimeter luminosity distributions overlap (for more discussion see Quanz et al. 2007b).
In Figure 5, we also quote the formulation that Ansdell et al. (2017) used to convert 1.33 mm flux to the dust mass of circumstellar disk based on an optically thin assumption and an assumption of a fixed dust temperature 20 K. We quote the derived dust masses from the ALMA surveys towards the Taurus, Lupus, Cha I, and Upper Sco molecular clouds from Pascucci et al. (2016), which show that the dust masses of the Class II YSO disks are mostly in the range of 1-100 . In Figure 5, we limit the presentation of those ALMA surveys to sources for which the stellar mass is higher than 0.3 . Class II YSOs with 0.3 stellar mass tend to have lower millimeter luminosity, and therefore the ALMA samples were rather incomplete. On the other hand, the previously estimated stellar masses for FUors/EXors are mostly higher than 0.3 although these estimates are very uncertain (for more discussion see Gramajo et al. 2014, and references therein). We note that Ansdell et al. (2017) adopted the dust opacity 10 cm2 g-1 and the opacity spectral index 1.0, which corresponds to 2.3 cm2 g-1. At 230 GHz, the dust opacity adopted by Pascucci et al. (2016) was the same with that adopted by Ansdell et al. (2017), in spite that Pascucci et al. (2016) adopted 0.4. In addition, Pascucci et al. (2016) has used self-consistent inputs and evolutionary models to estimate disk dust masses and stellar masses. The millimeter luminosity of our observed accretion outburst YSOs appear systematically brighter than the average Class II YSOs. We note that following the =1 (i.e., =3) assumption of Ansdell et al. (2017) will infer still lower 225 GHz fluxes for the Class II YSOs which were observed by ALMA only at 345 GHz.
We caution that the dominant 1.33 mm emission sources in some of our targets can be optically very thick, such that adopting an optically thin assumption can lead to an underestimate of dust mass by one order of magnitude (e.g., FU Ori, Liu et al. 2017; see also Dunham et al. 2014, Osorio et al. 2016, and Evans et al. 2017). This effect is subtle, and may not be limited only to the case of accretion outburst YSOs. The 0.85-1.3 mm SED of FU Ori is indeed consistent with optically thin dust emission, whereas its condensed and optically very thick inner few AU scale disk may still hide 90% of dust mass since it cannot significantly contribute to the overall 1 mm flux (Liu et al. 2017). The previous Plateau de Bure Interferometry (PdBI) 2722 continuum observations on V1057 Cyg at 2.75 mm from March 28 to June 22 of 2012 detected integrated flux and peak intensity of 4.9 mJy and 2.6 mJy beam-1, respectively (Fehér et al. submitted). If we combine all of our SMA 1.33 mm observations towards V1057 Cyg, the image tappered to the same angular resolution as that of the PdBI 2.75 mm image has a peak intensity of 182 mJy beam-1. Comparing the peak intensities at 1.33 mm and 2.75 mm implies a spectral index 2.5-2.8 at this specific wavelength range. The previous PdBI 2422 continuum observations on V1735 Cyg at 2.75 mm on April 05 and June 25 of 2014 detected integrated flux and peak intensity of 2.3 mJy and 1.8 mJy beam-1, respectively (Fehér et al. 2017). Comparing with our 3 detection limit of V1735 Cyg at 1.33 mm implies an upper limit of spectral index 1.7-2.0. We cannot rule out the possibility that the derived very low spectral indices of V1057 Cyg and V1735 Cyg at 1.33-2.75 mm were confused by millimeter flux variability (more discussion see Section 3.3). Otherwise, the low spectral indices at 1.33-2.75 mm can be interpreted by the (partly) obscured, very optically thick hot inner disk of a few AU scales (e.g., Zhu et al. 2007) which is heated by the outbursts or outburst triggering (or related) mechanisms. Hot inner disk presents in FU Ori (Liu et al. 2017) and may be common in Class 0/I stages (I-Hsiu Li et al. 2017). Yet another possible interpretation for the low spectral indices is dust grain growth (Draine et al. 2006). In the case that there are embedded hot inner disks, our reported 1 mm fluxes approximately trace the dust mass outside of the millimeter photosphere of each YSO, which is also true for the case of FU Ori. Without a spatially resolved image or a well sampled millimeter SED, the interpretation of the dust mass outside of the millimeter photosphere is inevitably model dependent. More related discussion will be provided in Section 4. In the case of grain growth, dust opacity (Draine et al. 2006) will likely be a few times lower than what was assumed in Ansdell et al. (2017), which will lead to underestimates of the dust masses of our samples in Figure 5. We note that the possibilities to interpret the low spectral indices of V1057 Cyg and V1735 Cyg are not mutually exclusive. The few AU scales hot inner disk is possible to present flux variability on the orbital timescales of from a few months to few years, for example, if its density and/or thermal structures are altered by stellar accretion, or if it is heated by the time varying spiral shocks, viscous heating, or compression work.
3.3 Millimeter variability/stability
Some of our target sources were observed in multiple time epochs. For not spatially resolved targets, or for resolved sources which were covered by observations with significantly overlapping uv coverages, we can constrain the variability/stability of their millimeter emission. Since the observations were not specifically designed to quantify variability, the potential calibration or measurement errors require to be addressed in detail, which will be provided in Sections 3.3.1-3.3.3, and in Appendix B.1-B.3 for sources which are less well observed.
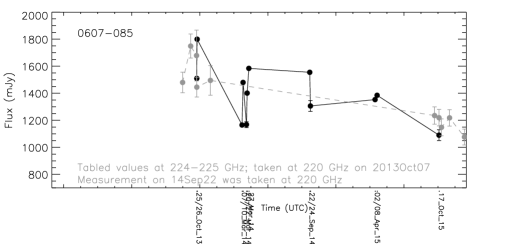
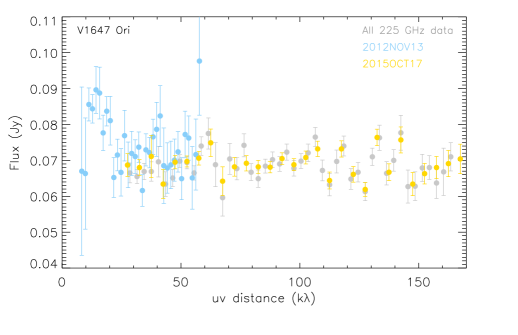
As a summary, we found that the 225 GHz fluxes of V1057 Cyg may have up to 20% time variability; the 225 GHz fluxes of V2494 Cyg and V2495 Cyg may have up to 30%-60% time variability from June 2013 to August 2014. From May 2008 to October 2015, the 225 GHz flux of V883 Ori may vary by less than 10%. The 272 GHz flux of FU Ori is consistent with less than 10% variability from December 2008 to January 2017. V1647 Ori is consistent with less than 10% of 225 GHz flux variability from November 2013 to October 2015. NY Ori is consistent with 15% of 225 GHz flux variability from April 02 to 08 of 2013. For NGC 2071 MM3 and Haro 5a/6a IRS which were observed with limited uv coverages and were confused by extended emission, we tentatively consider that the former has less than 20% millimeter flux variation in March 2014, and the latter has less than 10% millimeter flux variation from March 2014 to September 2015. For the rest of the observed sources, we do not have sufficient time sampling or data quality to address flux variability.
3.3.1 V1057 Cyg, V2494 Cyg, and V2495 Cyg
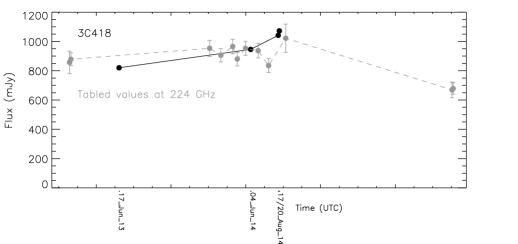
V1057 Cyg, V2494 Cyg, and V2495 Cyg were observed in the same tracks on June 17 of 2013, and August 17 and 20 of 2014. In addition, V1057 Cyg and V2494 Cyg were observed in a track on June 04 of 2014. The gain phase and amplitude calibrator for all these sources in all tracks was 3C418, which was bright (0.8-1 Jy) at 225 GHz during these observations. 3C418 is 7.8∘, 3.3∘, and 6.0∘ separated from V1057 Cyg, V2494 Cyg, and V2494 Cyg, respectively. The weather conditions on June 17 of 2013 and June 04 of 2014 were the averaged condition for the SMA operations at 225 GHz; the weather conditions on August 17 and 20 of 2014 were excellent (Table 2).
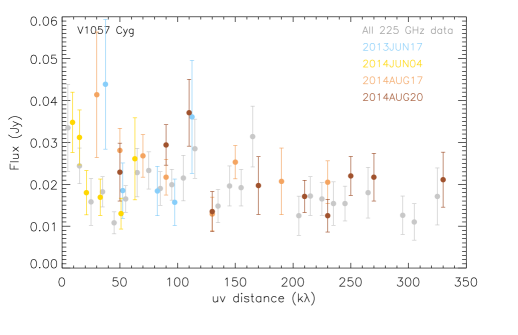
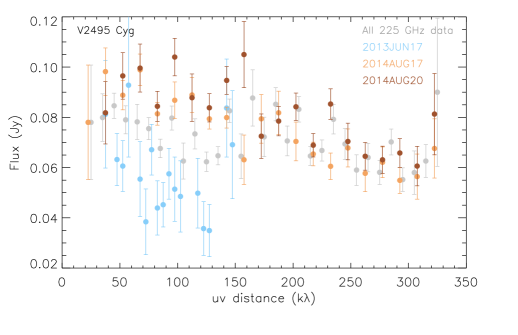
For each of these three sources, we imaged each epoch of observations separately but selected an identical shortest uv distance. In Figure 6 we plot the fluxes measured in the image domain via Gaussian fits. In addition, we shifted the phase referencing centers of our observations to the locations of the millimeter continuum emission peaks in post processing using the uvedit task of the Miriad software package, and then measured the azimuthally vector-averaged visibility amplitudes using the uvamp task of Miriad. Since the phase referencing centers for the observations of these three sources, the stellar positions, are very close to the millimeter emission peaks (Figure 1, 2), whether or not we shift the phase referencing centers in post processing will not significantly change the measured visibility amplitudes. The obtained visibility amplitudes are presented in Figure 7. The visibility amplitudes of V1057 Cyg are rather complicated, in particular, at 50 uv distances, due to the contribution from the millimeter emission clumps adjacent to it (Figure 3).
From Figure 6, we see that the measured fluxes on August 17 and 20 of 2014 are very well consistent, in spite of that these two tracks observed different absolute flux standard sources (Table 2). The visibility amplitudes of V2494 Cyg taken on June 17 of 2013 are only slightly higher than those taken on June 04 of 2014 at the overlapping uv distance range (Figure 7). However, the observed fluxes of V2494 Cyg in August 2014 are approximately 1.4 times the observed flux on June 17 of 2013. The fluxes of V2495 Cyg in August 2014 are 1.6 times those on June 17 of 2013. The fluxes of V1057 Cyg in August 2014 may be 1.1 times the observed flux on June 17 of 2013, although the difference is consistent with our assumed measurement/calibration errors; its flux may drop by 20% on June 04 of 2014, although 10% of it may be attributed to calibration errors.
The observed flux variations of V2494 Cyg and V2495 Cyg are larger than what can be caused by the typical absolute flux calibration uncertainty of SMA at 225 GHz. Our measured and applied flux values of 3C418 on June 04 and August 17 and 20 of 2014 are also very well consistent with the flux monitoring results of SMA (Figure 6, bottom panel). Figure 6 also shows that the fluxes of 3C418 varies no more than 10% over the timescales of from a few days to few months. Therefore, our flux measurements are unlikely to be largely confused by the time variability of 3C418. For spatially resolved sources, the differences in uv sampling can bias the observed fluxes. However, the millimeter emission sources associated with V1057 Cyg, V2494 Cyg, and V2495 Cyg are all spatially relatively compact. Moreover, we in fact detect higher fluxes from observations with the more extended array configurations, which cannot be explained by the effect of missing short-spacing data. The effect of atmospheric phase decoherence (e.g., Pérez et al. 2010) will also more likely degrade the fluxes observed from longer baselines. Due to the consistent observations and calibrations for these three sources, the flux variations are hard to be fully attributed to calibration errors. Therefore, we consider that millimeter flux variability was defected from at least two of these three sources. We are also open to the possibility that there are subtle instrumentation issues (e.g., unexpected antenna pointing errors for target sources but not calibrators) that were not identified or cannot be diagnosed by us, which might lead to larger flux uncertainties than what we assumed.
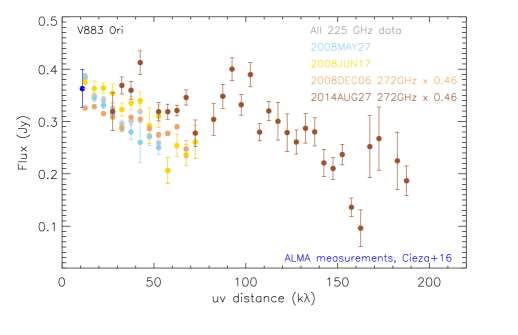
3.3.2 V883 Ori
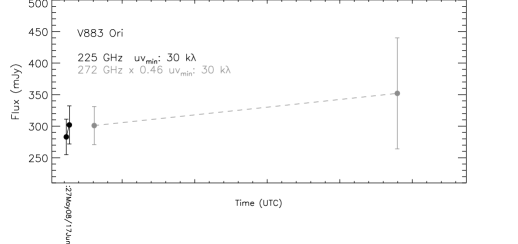
We performed analyses which are similar to those outlined in Section 3.3.1, and present the results in Figure 8 and 9. The measured fluxes on May 27 and June 17 of 2008 are consistent to within our assumed measurement errors. In addition, the visibility amplitudes measured with SMA are also very well consistent with the integrated fluxes taken by ALMA at the same frequency on December 12 of 2014 and April 05 of 2015. Moreover, we scaled the observed fluxes on December 06 of 2008 and August 27 of 2014 at 272 GHz to 225 GHz by assuming the spectral index =4.0 (see Cieza et al. 2016), and found that they are also consistent with the 225 GHz measurements to within the assumed measurement error. These observations constrain the millimeter flux variability of V883 Ori from 2008 to 2015 to less than 10%.
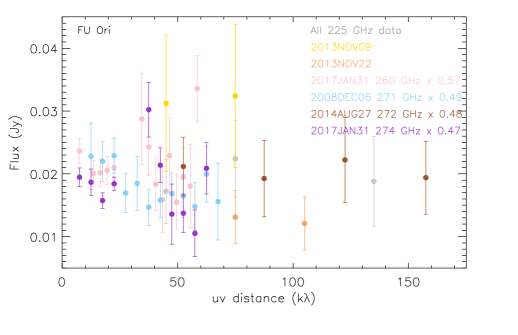
3.3.3 FU Ori
We present the observed fluxes and visibility amplitudes of FU Ori in Figure 10 and 11. (Sub)millimeter emission around FU Ori cannot be spatially resolved by any of the presented SMA observations (see Hales et al. 2015 and Liu et al. 2017 for higher angular resolution (sub)millimeter images). Therefore, we imaged individual epochs of observations without limiting the uv distance range, and then measured fluxes in the image domain by performing two-dimensional Gaussian fits.
There were two epochs of 225 GHz observations. However, the first epoch was taken at poor weather conditions with 0.4 (Table 2), thus the absolute flux scaling cannot be derived reliably. Therefore, our analysis of variability focuses on the 272 GHz fluxes measured on December 06 of 2008, August 27 of 2014, and January 31 of 2017, which are 43, 43 and 39 mJy, respectively. All of these measurements are consistent within our assumed measurement error. We constraint the 272 GHz flux variability of FU Ori to at most 10%. Our result is consistent with Green et al. (2016b) who claimed that FU Ori does not present infrared variability over the last decade.
|
|
4 Discussion
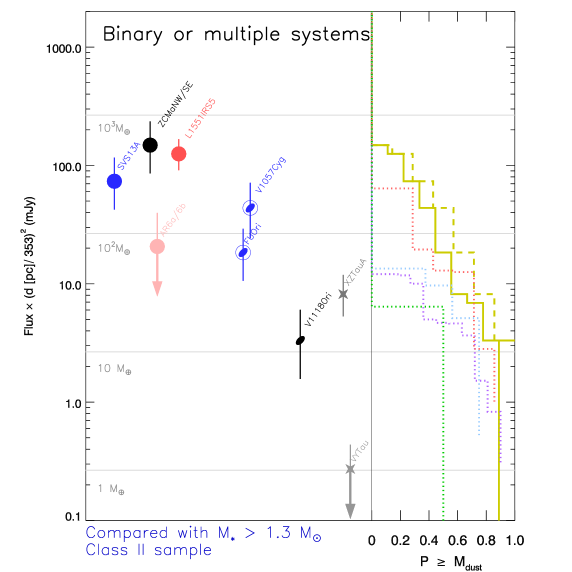
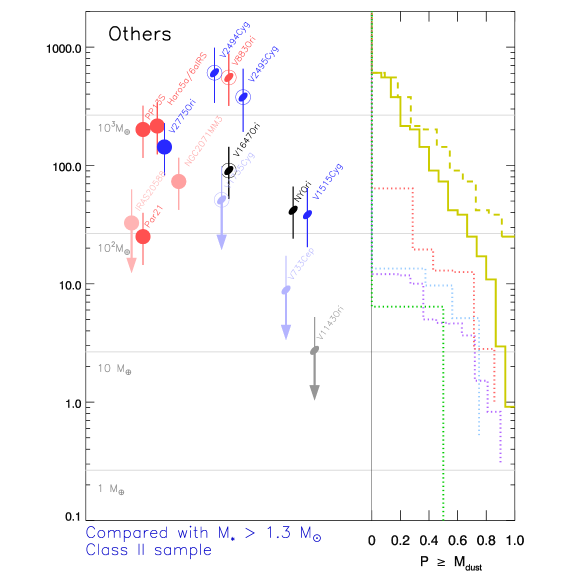
To understand better the observed distribution of , in Figure 12 we plot the confirmed binary or triple systems separately from the rest of the sources. In addition, we exclude the sources which are in very condensed cluster-forming environments (RNO 1B, RNO 1C, HBC 722). We found that millimeter emission of the confirmed binary or multiple systems may be systematically lower than that of the rest of the sources. It is also possible that there is an additional, millimeter bright population in the later samples, for example, V883 Ori, V2494 Cyg and V2495 Cyg. We note that the samples presented in the right panel of Figure 12 may contain unresolved binary or multiple systems, which follow a distribution similar with what is presented in the left panel. We refer to Harris et al. (2012) who reported that multiple YSO systems with 300 AU separations show similar (sub-)millimeter emission properties with single ones; multiple YSO systems with 300 AU separations are in general considerably fainter at (sub-)millimeter bands, although there are exceptions which posses millimeter bright circumbinary disks.
The different distributions of the two samples can be seen more clearly in the comparison with the cumulative mass distribution derived from the ALMA surveys of Class II disks (Figure 12). The cumulative mass distribution function of the samples of confirmed binary or multiple systems resembles that of the 1.3 Class II objects in the Cham I region. We note that the 1.3 Class II objects are among the highest mass but rare populations of the samples previously surveyed by ALMA. They tend to have higher millimeter luminosity than the lower stellar mass ones. Pascucci et al. (2016) and Ansdell et al. (2017) based on the ALMA surveys towards Taurus, Lupus, Upper Sco, Orionis, and Cham I regions suggested that and may be correlated, and may be approximately described by the power laws [mJy]( [])γ, where may be in the range of 1.5-3. The masses of the host protostars in our FUor(-like) and EXor samples are not well determined due to that spectral-typing for the protostars is seriously confused by the emission from the hot inner disk (e.g., Zhu et al. 2007). We cannot know whether or not the millimeter bright sources in our samples possess higher mass host YSOs. We also do not yet know whether or not the correlation of and should hold in the FUor(-like) and EXor samples. The protostellar mass of the millimeter brightest FUor-like object, V883 Ori, was constrained to be 1.3 by the Keplerian rotation curve of CO gas (Cieza et al. 2016), which may be a relatively massive YSO in our sample but not extreme. However, we caution that interpreting the higher millimeter luminosity of the observed FUors/EXors, compared to the 1.3 Class II objects, as a consequence of a higher average stellar mass of the FUors/EXors sample, may require extrapolating the correlation between and to a stellar mass beyond the range for which this correlation was measured (c.f., Boissier et al. 2011; Andrews et al. 2013).
Although many of the seven observed EXors show lower values of (Figure 12), it is not yet clear to us how the outburst nature (e.g., long duration, short duration and repetitive, FUor-like) is related to the value of . They may not be related, which may imply that the outburst nature is determined by the physical mechanisms on unresolved spatial scales (e.g., magnetosphere or inner circumstellar disk). The millimeter flux variability that we potentially have detected from V1057 Cyg, V2494 Cyg, and V2495 Cyg may indicate that the thermal or density structures of the dusty disks in the inner AU scale regions around these sources are perturbed. We refer to Johnstone et al.(2013) and Yoo et al. (2017) who argued that the millimeter flux variability can also be due to the variation of protostellar irradiation. Kóspál et al. (2011a) reported the 1.25 mm flux variability over a timescale of a few days of the EXor source UZ Tau E, which is binary. However, it is not clear whether the 1.25 mm flux is dominated by dust emission.
There are four sources (VY Tau, XZ Tau, V1118 Ori, V1143 Ori) which our SMA observations have constrained to have considerably lower values than FU Ori (Figure 12). All of them are EXors. In particular, VY Tau may be a Class III source which possess considerably lower disk mass than the rest of our samples (Liu et al. 2016a). The accretion outbursts may only require some mass to be concentrated immediately around the host YSOs instead of requiring the bulk of circumstellar disk to be very massive, although the presence of a very massive disk naturally make it easier to fulfill the required mass concentration to feed accretion outbursts. We emphasize that the observed traces dust mass outside of the millimeter photosphere (e.g., the 1 boundary). The sources which have low values can still possess massive but compact and optically thick disks (e.g., XZ Tau B, see Osorio et al. 2016; see also Figure 12 of Zhu et al. 2010). In addition, it becomes rather difficult to detect such compact disks unless they are very significantly heated, either by protostellar irradiation or mechanic works. Capturing exterior, infalling gas arms/streams/clumps may replenish the circumstellar disk mass, which is conducive to triggering accretion outbursts. Either disk gravitational instability (e.g., Vorobyov & Basu 2010; Vorobyov & Basu 2015; Mercer & Stamatellos 2017; Tsukamoto et al. 2017) or binary interaction (e.g., Bonnell & Bastien 1992; Pfalzner 2008; Nayakshin & Lodato 2012) can help pile up gas and dust to small spatial scales.
Moreover, the sources which are resolved to be connected with dense, 103 AU scale millimeter emission filament(s) (e.g., SVS 13, PP 13S, NGC 2071 MM3) or arm(s) (e.g., Haro 5a/6a IRS, ZCMa) are not necessarily particularly bright in our measured . On the other hand, many sources which show high values (e.g., V2494 Cyg, V2495 Cyg, V883 Ori, V2775 Ori, PP 13S, Haro 5a/6a IRS) are surrounded by circumstellar disk structures (or inner accreting envelope) that have spatial scales larger than few tens of AU (Figure 1, 2, 7, 9, 19; see also Pérez et al. 2010; Cieza et al. 2016), which are very different from the case of FU Ori which presents spatially compact millimeter emission (Figure 3; Hales et al. 2015; Liu et al. 2017). For confirmed binary or triple systems, the compact emission may be explained by several physical mechanisms which are not mutually exclusive. During the earlier evolutionary stage, members of the binary may preferentially capture the infalling gas stream which has less relative motion with respect to them. In other words, part of the initial angular momentum budget of the parental core goes to the orbital motion of the binary components. Therefore, the circumstellar disks formed around each of the individual members may be initially small due to the lower accumulated angular momentum. In addition, binary interaction may truncate large disks or may induce efficient inward migration of dust. A disk will become faint in once the dust grains are migrated inside the millimeter photosphere. On the other hand, if the bright sources are indeed isolated YSOs (V883 Ori is very likely the case according to the ALMA image presented in Cieza et al. 2016) or very compact binary systems, then the brighter emission observed around the higher mass YSOs may be naturally understood by that a certain fraction of the accreted gas and dust to form YSOs is yet centrifugally supported at extended (e.g., 100 AU) regions (some theoretical discussion is presented in Vorobyov 2013, Kuffmeier et al. 2017, and references therein). Accreting gas from large to small scales and onto protostars requires either the rotational motion of extended circumstellar disk or the orbital motion of the binary/multiple components to serve as reservoirs of angular momentum. More insight can be gained by combining radiative transfer modeling and hydrodynamic simulations, which is not in the scope of the present manuscript.
| Source name | RNO 1B (V710 Cas) | RNO 1C | SVS 13A (Per-emb-44 A/B) | PP 13S |
|---|---|---|---|---|
| Evolutionary Class | Class I/II (cluster) | Class I (cluster) | Class I (binary) | Class I |
| stellar R.A. (J2000) | 003646.05 | 003646.65 | 032903.759 | 041041.119 |
| stellar Decl. (J2000) | +63∘28′5329 | +63∘28′5790 | 31∘16′0399 | 38∘07′5441 |
| Spectral type | F8 | M (?) | late-F to early-G (unknown type companion separated from 03) | mid-K (?) |
| Onset (yr) | 1978 | FUor-like | 1988, 1990 | FUor-like |
| Outburst duration (yr) | 40 | 30 | ||
| Assumed distance (pc) | 929 | 929 | 235 | 350 |
| Synthesized beam | 1311; -25∘ | 1311; -25∘ | 15088; 43∘ | 1710; 54∘ |
| ( ; P.A.) | [31-140 ] | |||
| Image RMS (mJy beam-1) | 1.2 | 1.2 | 10.6 | 7.0 |
| mm R.A. (J2000) | confused | confused | 032903.75 | 041041.12 |
| mm Decl. (J2000) | confused | confused | 31∘16′037 | 38∘07′545 |
| Image component size | ; 39∘ | ; 49∘ | ||
| ( ; P.A.) | lightly confused | |||
| Peak intensity (mJy beam-1) | 6 | 12 | 16216 | 20020 |
| Peak S/N | 5 | 10 | 15 | 29 |
| Integrated 1.3 mm Flux (mJy) | 22523 | 22923 |
| Source name | L1551 IRS5 | XZ Tau A | VY Tau | V1118 Ori |
|---|---|---|---|---|
| Evolutionary Class | Class I (binary) | Class III (binary) | Class III (binary) | Class II (binary) |
| stellar R.A. (J2000) | 043134.08 | 043140.095 | 043917.412 | 053444.747 |
| stellar Decl. (J2000) | 18∘08′0490 | 18∘13′5671 | +22∘47′5340 | 05∘33′4226 |
| Spectral type | Both mid-K ? (separated by 03) | M3 (one M0 comparion at 42 AU separation, and potentially an unknown type one at 13 AU separation) | M0 (with a M2-M4 companion, orbital period 350 yr) | M2-M3 (with a companion of unclear spectral type, separation76 AU) |
| Onset (yr) | FUor-like | many | many (1900-1970, 2013-present) | many |
| Outburst duration (yr) | a few | 0.5-2 | 1.2 | |
| Assumed distance (pc) | 140 | 140 | 140 | 420 |
| Synthesized beam | 12090; -85∘ | 054039; 86∘ | ; 75∘ | ; 70∘ |
| ( ; P.A.) | ||||
| Image RMS (mJy beam-1) | 3.0 | 17.0 | 0.55 | 0.6 |
| mm R.A. (J2000) | 043134.16 | 053444.75 | ||
| mm Decl. (J2000) | 18∘08′046 | 05∘33′423 | ||
| Image component size | ; 137∘ | ; 17∘ | ||
| ( ; P.A.) | ||||
| Peak intensity (mJy beam-1) | 48849 | 3 51 | 3 1.7 | 2.30.6 |
| Peak S/N | 150 | 3.8 | ||
| Integrated 1.3 mm Flux (mJy) | 78078 | 3 51 | 3 1.7 | 2.30.6 |
| Source name | Haro 5a/6a IRS | NY Ori | V1143 Ori | V883 Ori |
|---|---|---|---|---|
| Evolutionary Class | Class I | Class II | Class II | Class I/II |
| stellar R.A. (J2000) | 053526.560 | 053536.011 | 053803.896 | 053818.1 |
| stellar Decl. (J2000) | 05∘03′5508 | 05∘12′2532 | 04∘16′4285 | 07∘02′26′′ |
| Spectral type | uncertain | mid-G to early-K | M2 | F5 |
| Onset (yr) | FUor-like | many | many | FUor-like |
| Outburst duration (yr) | 0.3 | 1 | ||
| Assumed distance (pc) | 450 | 420 | 420 | 460 |
| Synthesized beam | 12088; 90∘ | ; 64∘ | ; 65∘ | 2422; -55∘ |
| ( ; P.A.) | [271 GHz] | |||
| Image RMS (mJy beam-1) | 2.4 | 1.7 | 0.62 | 7.6 |
| mm R.A. (J2000) | 053526.56 | 053536.01 | 053818.11 | |
| mm Decl. (J2000) | 05∘03′552 | 05∘12′253 | 07∘02′259 | |
| Image component size | ; 78∘ | ; 66∘ | ; 123∘ | |
| ( ; P.A.) | ||||
| Peak intensity (mJy beam-1) | 13213 | 292.9 | 66466 | |
| Peak S/N | 55 | 17 | 87 | |
| Integrated 1.3 mm Flux (mJy) | 17117 | 323.2 | 3 1.9 | 70470 |
Table 1. (Continued)
| Source name | V2775 Ori ([ctf93] 216-2) | FU Ori | V1647 Ori | NGC 2071 MM3 |
|---|---|---|---|---|
| Evolutionary Class | Class I | Class I/II | Class I/II | Class I |
| stellar R.A. (J2000) | 054248.488 | 054522.368 | 054613.135 | 054736.6 |
| stellar Decl. (J2000) | 08∘16′3474 | 09∘04′1225 | 00∘06′0482 | 00∘20′06 |
| Spectral type | M5 | early-K to mid-M (with a 1 companion, 05 separation) | M0 | uncertain |
| Onset (yr) | 2005, 2007 | 1936 | many | FUor-like |
| Outburst duration (yr) | 5 | 80 | a few | |
| Assumed distance (pc) | 420 | 353 | 400 | 400 |
| Synthesized beam | 1110; 73∘ | 17077; 67∘ | 1210; 82∘ | 3929; 86∘ |
| ( ; P.A.) | ||||
| Image RMS (mJy beam-1) | 1.9 | 1.8 | 0.66 | 4.0 |
| mm R.A. (J2000) | 054248.49 | 054522.38 | 054613.14 | 054736.59 |
| mm Decl. (J2000) | 08∘16′347 | 09∘04′123 | 00∘06′049 | 00∘20′061 |
| Image component size | ; 76∘ | ; 69∘ | ; 98∘ | ; 78∘ |
| ( ; P.A.) | confused | |||
| Peak intensity (mJy beam-1) | 9910 | 181.8 | 696.9 | 555.5 |
| Peak S/N | 52 | 9.3 | 105 | 14 |
| Integrated 1.3 mm Flux (mJy) | 11512 | 181.8 | 747.4 | 70 |
| Source name | AR 6A/6B | Z CMa NW/SE | Parsamian 21 (HBC 687) | V1515 Cyg |
|---|---|---|---|---|
| Evolutionary Class | Class I (binary) | Class I (binary) | Class I | Class II |
| stellar R.A. (J2000) | 064059.31/59.31 | 070343.164 | 192900.86 | 202348.010 |
| stellar Decl. (J2000) | 09∘35′520/492 | 11∘33′0622 | 09∘38′42.9 | 42∘12′2570 |
| Spectral type | early-G to late-K/ Unknown (separated by 28) | B8-outbursting / F5-FUor-like (separation 01) | A5e | G2-G5 |
| Onset (yr) | FUor-like/FUor-like | many (1987, 2000, 2004, 2008, etc) / | FUor-like | 1950 |
| Outburst duration (yr) | / | a few / | 30 | |
| Assumed distance (pc) | 800 | 930 | 400 | 1000 |
| Synthesized beam | 4214; 37∘ | 11093; 42∘ | 12083; 40∘ | 1713; 78∘ |
| ( ; P.A.) | [35-162 ] | [266 GHz] | [220-277 GHz] | |
| Image RMS (mJy beam-1) | 1.3 | 1.3 | 1.1 | 1.0 |
| mm R.A. (J2000) | 070343.16 | 192900.86 | 202348.02 | |
| mm Decl. (J2000) | 11∘33′060 | 09∘38′425 | 42∘12′258 | |
| Image component size | ; 38∘ | ; 37∘ | ; 77∘ | |
| ( ; P.A.) | confused | |||
| Peak intensity (mJy beam-1) | 3 3.9 | 212.1 | 373.7 | 6.01.0 |
| Peak S/N | 16 | 34 | 6 | |
| Integrated 1.3 mm Flux (mJy) | 3 3.9 | 272.7 | 373.7 | 6.01.0 |
| Source name | HBC 722 (V2493 Cyg or PTF 10qpf) | V2494 Cyg (HH 381 IRS) | V1057 Cyg | IRAS 20588+5215N |
|---|---|---|---|---|
| Evolutionary Class | Class II | Class I/II | Class I/II (binary) | Class I |
| stellar R.A. (J2000) | 205817.029 | 205821.09 | 205853.72 | 210021.40 |
| stellar Decl. (J2000) | 43∘53′4329 | 52∘29′2770 | 44∘15′283 | 52∘27′0940 |
| Spectral type | K7-M0 | G | F7-G3 I-II (with a M-type companion, separation 30 AU) | uncertain |
| Onset (yr) | 2010 | 1983, 1989 | 1970 | Actively accreting, |
| Outburst duration (yr) | 6 | 20 | 10-30 | but not necessarily a FUor or EXor |
| Assumed distance (pc) | 520 | 800 | 600 | 800 |
| Synthesized beam | 3330; 14∘ | 086053; 74∘ | 087050; 76∘ | 1210; 85∘ |
| ( ; P.A.) | ||||
| Image RMS (mJy beam-1) | 2.4 | 1.0 | 0.7 | 2.1 |
| mm R.A. (J2000) | 205821.10 | 205853.73 | ||
| mm Decl. (J2000) | 52∘29′275 | 44∘15′284 | ||
| Image component size | ; 75∘ | ; 84∘ | ||
| ( ; P.A.) | variable | |||
| Peak intensity (mJy beam-1) | 3 7.2 | 11715 | 152.0 | 3 6.3 |
| Peak S/N | 117 | 21 | ||
| Integrated 1.3 mm Flux (mJy) | 3 7.2 | 11715 | 192.0 | 3 6.3 |
Table 1. (Continued)
| Source name | V2495 Cyg | V1735 Cyg (Elias 1-12) | V733 Cep (Persson’s star) | |
|---|---|---|---|---|
| Evolutionary Class | Class I/II | Class I/II | Class II | |
| stellar R.A. (J2000) | 210025.25 | 214720.65 | 225333.24 | |
| stellar Decl. (J2000) | 52∘30′170 | 47∘32′038 | 62∘32′238 | |
| Spectral type | K5-M1 (uncertain) | F0 II-G0 II | early- to mid-G | |
| Onset (yr) | 1999 | 1957 and 1965 | 1953 and 1984 | |
| Outburst duration (yr) | 8 | 30 | 30 | |
| Assumed distance (pc) | 800 | 900 | 800 | |
| Synthesized beam | 078046; 74∘ | 12097; 85∘ | 3329; 84∘ | |
| ( ; P.A.) | ||||
| Image RMS (mJy beam-1) | 1.0 | 2.6 | 0.59 | |
| mm R.A. (J2000) | 210025.24 | |||
| mm Decl. (J2000) | 52∘30′169 | |||
| Image component size | ; 75∘ | |||
| ( ; P.A.) | variable | |||
| Peak intensity (mJy beam-1) | 7315 | 3 7.8 | 3 1.7 | |
| Peak S/N | 73 | |||
| Integrated 1.3 mm Flux (mJy) | 8915 | 3 7.8 | 3 1.7 |
Notes. Except for FU Ori of which the parallax distance has been provided by Gaia data releases (Gaia Collaboration 2016), we quoted the target source distances mostly from Audard et al. (2014). We note that the distance of Z CMa may be as high as 1800 pc, which is approximately two times higher than the value we quote here. Spectral types of our target sources may be uncertain. We quote them mainly based on the discussion in Gramajo et al. (2014), Audard et al. (2014) and references therein. We provide the list of references for the sake of crediting the original works, on the other hand not duplicating the related description given that we are not providing any better observational constraints. The protostellar mass of V883 Ori has been constrained by the observations of Keplerian rotation curve with ALMA (Cieza et al. 2016). We do not find dedicated discussion about the protostellar masses of Haro 5a/6a IRS, NGC 2071 MM3, and IRAS 20588+5215N. We specify whether a target source is a confirmed visual or spectroscopic binary or multiple systems in this table. However, we cannot rule out the possibility that some unspecified sources are not yet resolved close binaries. We refer to Reipurth & Aspin (2004b) and references therein for more discussion about multiplicity of these objects.
References. Ábrahám et al. (2004) Andrews et al. (2004) Anglada et al. (2004) Antoniucci et al. (2016) Aspin & Sandell (1994) Aspin & Reipurth (2003) Aspin et al. (2008) Aspin et al. (2009) Beck & Aspin(2012) Beljawsky (1928) Bonnefoy et al. (2017) Briceño et al. (2004) Caratti o Garatti et al. (2011) Caratti o Garatti et al. (2012) Carrasco-González et al. (2009) Chen et al. (2016) Cieza et al. (2016) Cohen & Kuhi (1979) Dibai (1969) Dodin et al. (2016) Eisloeffel et al. (1991) Elias (1978) Fischer et al. (2012) Forgan et al. 2014; Gramajo et al. (2014) Green et al. (2006) Green et al. (2013) Green et al. (2016a) Haas et al. (1990) Hartmann et al. (1989) Hartmann & Kenyon (1996) Herbig (1977) Herbig et al. (2003) Herbig (2008) Hillenbrand (1997) Hodapp & Chini (2014) Kenyon et al. (1988) Kenyon et al. (1989) Kenyon et al. (1991) Kenyon et al. (1993) Kolotilov & Petrov (1983) Koresko et al. (1991) Kospal et al. (2005) Kopatskaya et al. (2013) Krist et al. (1997) Lim et al. (2016) Lodato & Bertin (2001) Lodato & Bertin (2003) Magakian et al. (2013) Miller et al. (2011) Movsessian et al. (2006) Munari et al.(2010) Peneva et al. (2010) Persson (2004) Pueyo et al. (2012) Quanz et al. (2007a) Reipurth & Aspin (1997) Reipurth et al.(2004) Reipurth & Aspin(2004) Reipurth & Aspin (2004b) Reipurth et al. (2007a) Reipurth et al. (2007b) Reipurth & Aspin (2010) Rodríguez et al. (2003) Sandell & Aspin (1998) Semkov et al. (2010) Semkov et al. (2012) Staude & Neckel (1991) Staude & Neckel (1992) Strom & Strom (1993) Szeifert et al. (2010) The et al. (1994) van den Ancker et al. (2004) Wang et al. (2004) Welin (1971) Zhu et al. (2007)
5 Conclusions
We have observed a sample of 29 FUors, EXors, and FUor-like objects using the SMA, at 1.1-1.3 mm wavelengths. Most of the detected sources, which are located at distances of 140-1000 parsec, were observed with 1′′ angular resolution. Therefore, our observations trace the circumstellar material which is feeding the outburst YSOs. Our main findings are:
-
We detected asymmetric, 103 AU scales millimeter continuum emission structures around Haro 5a/6a IRS, NGC 2071 MM3, and Z CMa. We detected asymmetric or clumpy, few hundreds AU scales structures immediately around SVS 13, PP 13S, V2775 Ori, V2494 Cyg, and V2495 Cyg. V1057 Cyg is surrounded by a few 500-1000 AU scale millimeter emission clumps which are at a few 103 AU projected separations. RNO 1B, RNO 1C, and HBC 722 are located in crowded low-mass cluster forming environments. The other detected sources are spatially compact, which were marginally resolved or were not resolved by our SMA observations.
-
Among our observed sources, the confirmed binary or multiple systems show a systematically lower distribution than the rest of the sources. Unfortunately, the presently large uncertainty in the spectral types and the target source distances prohibit addressing whether or not the difference is related to a different protostellar mass distribution. Finally, our samples show a systematically higher distribution than that of the sample of Class II YSOs summarized by Pascucci et al. (2016).
-
All detected sources which are confirmed to have lower than FU Ori, are EXors (XZ Tau, VY Tau, V1143 Ori, V1118 Ori). The values of the longer duration outburst sources and FUor-like objects are widely spread. The lower bound of their 1.33 mm fluxes will only become certain once the future, deeper observations recover those presently non-detected sources.
-
The distribution of for those targets which exhibit 10 m silicate emission (FU Ori, Parsamian 21, V1057 Cyg, V1515 Cyg, V1647 Ori, and XZ Tau) is systematically lower than that of the silicate absorption objects (Z CMa, L1551 IRS 5, RNO 1B, RNO 1C, V1735 Cyg, and V883 Ori), although these two distributions partly overlap. This may be consistent with the interpretation of Quanz et al. (2007b) that the silicate absorption objects are embedded by denser residual circumstellar envelopes as compared with the silicate emission ones.
-
We may have detected the millimeter flux variability of a few tens percents from V2494 Cyg and V2495 Cyg. The millimeter emission of FU Ori and V883 Ori appears stationary over the approximately one decade timescales. Millimeter emission of V1057 Cyg, V1647 Ori and Haro 5a/6a IRS may be stationary over a 1-2 years timescale. Over the timescale of several days, we constrained the millimeter flux variability of NGC 2071 MM3 and NY Ori to be less than 10%-15%, which should be regarded as upper limits given the relatively limited data quality of these two sources. Given the high accretion rate of FU Ori over the last 80 years (10-4 yr-1), the stability of its millimeter emission implies that the inner few AU region of its circumstellar disk is very massive such that its density and thermal structures are not yet significantly perturbed due to the massive inflow motion. This is consistent with the mass derivation of Liu et al. (2017).
-
The high values of our observed sources may imply that they possess relatively massive circumstellar disks. This may be conducive to triggering accretion outbursts.
Acknowledgements.
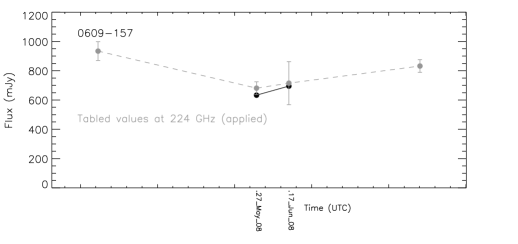
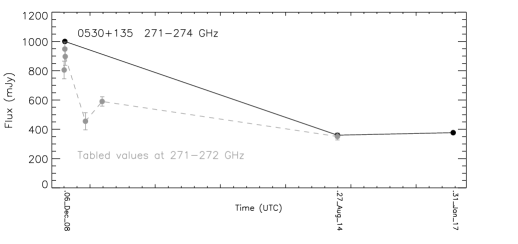
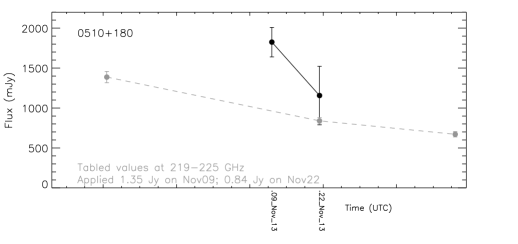
We acknowledge Dr. Mark Gurwell for compiling the SMA Calibrator List (http://sma1.sma.hawaii.edu/callist/callist.html). The presented calibrator flux density data was obtained at the Submillimeter Array (SMA) near the summit of Mauna Kea (Hawaii). 3C418, 0530+135, 0510+180, and 0607-085 are included in an ongoing monitoring program at the SMA to determine the fluxes of compact extragalactic radio sources that can be used as calibrators at millimeter wavelengths (Gurwell et al. 2007). Observations of available potential calibrators are from time to time observed for 3 to 5 minutes, and the measured source signal strength calibrated against known standards, typically solar system objects (Titan, Uranus, Neptune, or Callisto). Data from this program are updated regularly and are available at the SMA website HBL thanks Dr. Cornelis Dullemond for very insightful discussion. E. Vorobyov acknowledges support from the RFBR grant 17-02-00644. This work was supported by the Momentum grant of the MTA CSFK Lendület Disk Research Group.References
- Ábrahám et al. (2004) Ábrahám, P., Kóspál, Á., Csizmadia, S., et al. 2004, A&A, 428, 89
- Alonso-Albi et al. (2009) Alonso-Albi, T., Fuente, A., Bachiller, R., et al. 2009, A&A, 497, 117
- Andrews et al. (2004) Andrews, S. M., Rothberg, B., & Simon, T. 2004, ApJ, 610, L45
- Andrews et al. (2013) Andrews, S. M., Rosenfeld, K. A., Kraus, A. L., & Wilner, D. J. 2013, ApJ, 771, 129
- Anglada et al. (1994) Anglada, G., Rodriguez, L. F., Girart, J. M., Estalella, R., & Torrelles, J. M. 1994, ApJ, 420, L91
- Anglada et al. (2004) Anglada, G., Rodríguez, L. F., Osorio, M., et al. 2004, ApJ, 605, L137
- Ansdell et al. (2016) Ansdell, M., Williams, J. P., van der Marel, N., et al. 2016, ApJ, 828, 46
- Ansdell et al. (2017) Ansdell, M., Williams, J. P., Manara, C. F., et al. 2017, AJ, 153, 240
- Antoniucci et al. (2016) Antoniucci, S., Podio, L., Nisini, B., et al. 2016, A&A, 593, L13
- Aspin & Sandell (1994) Aspin, C., & Sandell, G. 1994, A&A, 288, 803
- Aspin & Reipurth (2003) Aspin, C., & Reipurth, B. 2003, AJ, 126, 2936
- Aspin et al. (2008) Aspin, C., Beck, T. L., & Reipurth, B. 2008, AJ, 135, 423
- Aspin et al. (2009) Aspin, C., Beck, T. L., Pyo, T.-S., et al. 2009, AJ, 137, 431
- Audard et al. (2014) Audard, M., Ábrahám, P., Dunham, M. M., et al. 2014, Protostars and Planets VI, 387
- Barenfeld et al. (2016) Barenfeld, S. A., Carpenter, J. M., Ricci, L., & Isella, A. 2016, ApJ, 827, 142
- Beljawsky (1928) Beljawsky, S. 1928, Astronomische Nachrichten, 234
- Boissier et al. (2011) Boissier, J., Alonso-Albi, T., Fuente, A., et al. 2011, A&A, 531, A50
- Bonnell & Bastien (1992) Bonnell, I., & Bastien, P. 1992, ApJ, 401, L31
- Bonnefoy et al. (2017) Bonnefoy, M., Chauvin, G., Dougados, C., et al. 2017, A&A, 597, A91
- Briceño et al. (2004) Briceño, C., Vivas, A. K., Hernández, J., et al. 2004, ApJ, 606, L123
- Canovas et al. (2015) Canovas, H., Perez, S., Dougados, C., et al. 2015, A&A, 578, L1
- Caratti o Garatti et al. (2011) Caratti o Garatti, A., Garcia Lopez, R., Scholz, A., et al. 2011, A&A, 526, L1
- Caratti o Garatti et al. (2012) Caratti o Garatti, A., Garcia Lopez, R., Antoniucci, S., et al. 2012, A&A, 538, A64
- Carpenter et al. (2014) Carpenter, J. M., Ricci, L., & Isella, A. 2014, ApJ, 787, 42
- Carrasco-González et al. (2009) Carrasco-González, C., Rodríguez, L. F., Anglada, G., & Curiel, S. 2009, ApJ, 693, L86
- Cieza et al. (2016) Cieza, L. A., Casassus, S., Tobin, J., et al. 2016, Nature, 535, 258
- Chen et al. (2016) Chen, X., Arce, H. G., Zhang, Q., Launhardt, R., & Henning, T. 2016, ApJ, 824, 72
- Chou et al. (2014) Chou, T.-L., Takakuwa, S., Yen, H.-W., Ohashi, N., & Ho, P. T. P. 2014, ApJ, 796, 70
- Cohen & Kuhi (1979) Cohen, M., & Kuhi, L. V. 1979, ApJS, 41, 743
- Dibai (1969) Dibai, E. A. 1969, Astrophysics, 5, 115
- Dodin et al. (2016) Dodin, A. V., Emelyanov, N. V., Zharova, A. V., et al. 2016, Astronomy Letters, 42, 29
- Draine (2003) Draine, B. T. 2003, ARA&A, 41, 241
- Draine (2006) Draine, B. T. 2006, ApJ, 636, 1114
- Dunham et al. (2012) Dunham, M. M., Arce, H. G., Bourke, T. L., et al. 2012, ApJ, 755, 157
- Dunham & Vorobyov (2012) Dunham, M. M., & Vorobyov, E. I. 2012, ApJ, 747, 52
- Dunham et al. (2014) Dunham, M. M., Vorobyov, E. I., & Arce, H. G. 2014, MNRAS, 444, 887
- Dzib et al. (2015) Dzib, S. A., Loinard, L., Rodríguez, L. F., et al. 2015, ApJ, 801, 91
- Eisloeffel et al. (1991) Eisloeffel, J., Guenther, E., Hessman, F. V., et al. 1991, ApJ, 383, L19
- Elias (1978) Elias, J. H. 1978, ApJ, 223, 859
- Evans et al. (2017) Evans, M. G., Ilee, J. D., Hartquist, T. W., et al. 2017, arXiv:1706.00254
- Fehér et al. (2017) Fehér, O., Kóspál, Á., Ábrahám, P., Hogerheijde, M. R., & Brinch, C. 2017, arXiv:1709.07458
- Fischer et al. (2012) Fischer, W. J., Megeath, S. T., Tobin, J. J., et al. 2012, ApJ, 756, 99
- Forgan et al. (2014) Forgan, D., Ivison, R. J., Sibthorpe, B., Greaves, J. S., & Ibar, E. 2014, MNRAS, 439, 4057
- Gaia Collaboration et al. (2016) Gaia Collaboration, Brown, A. G. A., Vallenari, A., et al. 2016, A&A, 595, A2
- Gramajo et al. (2014) Gramajo, L. V., Rodón, J. A., & Gómez, M. 2014, AJ, 147, 140
- Green et al. (2006) Green, J. D., Hartmann, L., Calvet, N., et al. 2006, ApJ, 648, 1099
- Green et al. (2013) Green, J. D., Evans, N. J., II, Kóspál, Á., et al. 2013, ApJ, 772, 117
- Green et al. (2016a) Green, J. D., Kraus, A. L., Rizzuto, A. C., et al. 2016a, ApJ, 830, 29
- Green et al. (2016b) Green, J. D., Jones, O. C., Keller, L. D., et al. 2016b, ApJ, 832, 4
- Gurwell et al. (2007) Gurwell, M. A., Peck, A. B., Hostler, S. R., Darrah, M. R., & Katz, C. A. 2007, From Z-Machines to ALMA: (Sub)Millimeter Spectroscopy of Galaxies, 375, 234
- Haas et al. (1990) Haas, M., Leinert, C., & Zinnecker, H. 1990, A&A, 230, L1
- Hales et al. (2015) Hales, A. S., Corder, S. A., Dent, W. R. D., et al. 2015, ApJ, 812, 134
- Harris et al. (2012) Harris, R. J., Andrews, S. M., Wilner, D. J., & Kraus, A. L. 2012, ApJ, 751, 115
- Hartmann et al. (1989) Hartmann, L., Kenyon, S. J., Hewett, R., et al. 1989, ApJ, 338, 1001
- Hartmann & Kenyon (1996) Hartmann, L., & Kenyon, S. J. 1996, ARA&A, 34, 207
- Herbig (1977) Herbig, G. H. 1977, ApJ, 217, 693
- Herbig et al. (2003) Herbig, G. H., Petrov, P. P., & Duemmler, R. 2003, ApJ, 595, 384
- Herbig (2008) Herbig, G. H. 2008, AJ, 135, 637
- Hillenbrand (1997) Hillenbrand, L. A. 1997, AJ, 113, 1733
- Ho et al. (2004) Ho, P. T. P., Moran, J. M., & Lo, K. Y. 2004, ApJ, 616, L1
- Hodapp & Chini (2014) Hodapp, K. W., & Chini, R. 2014, ApJ, 794, 169
- I-Hsiu Li et al. (2017) I-Hsiu Li, J., Liu, H. B., Hasegawa, Y., & Hirano, N. 2017, ApJ, 840, 72
- Johnstone et al. (2013) Johnstone, D., Hendricks, B., Herczeg, G. J., & Bruderer, S. 2013, ApJ, 765, 133
- Kenyon et al. (1988) Kenyon, S. J., Hartmann, L., & Hewett, R. 1988, ApJ, 325, 231
- Kenyon et al. (1989) Kenyon, S. J., Hartmann, L., Imhoff, C. L., & Cassatella, A. 1989, ApJ, 344, 925
- Kenyon et al. (1991) Kenyon, S. J., Hartmann, L. W., & Kolotilov, E. A. 1991, PASP, 103, 1069
- Kenyon et al. (1993) Kenyon, S. J., Hartmann, L., Gomez, M., Carr, J. S., & Tokunaga, A. 1993, AJ, 105, 1505
- Kolotilov & Petrov (1983) Kolotilov, E. A., & Petrov, P. P. 1983, Pisma v Astronomicheskii Zhurnal, 9, 171
- Koresko et al. (1991) Koresko, C. D., Beckwith, S. V. W., Ghez, A. M., Matthews, K., & Neugebauer, G. 1991, AJ, 102, 2073
- Kospal et al. (2005) Kospal, A., Abraham, P., Acosta-Pulido, J., et al. 2005, Information Bulletin on Variable Stars, 5661, 1
- Kóspál et al. (2011) Kóspál, Á., Salter, D. M., Hogerheijde, M. R., Moór, A., & Blake, G. A. 2011a, A&A, 527, A96
- Kóspál et al. (2011) Kóspál, Á., Ábrahám, P., Acosta-Pulido, J. A., et al. 2011b, A&A, 527, A133
- Kóspál (2011) Kóspál, Á. 2011b, A&A, 535, A125
- Kóspál et al. (2016) Kóspál, Á., Ábrahám, P., Acosta-Pulido, J. A., et al. 2016, A&A, 596, A52
- Kóspál et al. (2017) Kóspál, Á., Ábrahám, P., Csengeri, T., et al. 2017, ApJ, 843, 45
- Kopatskaya et al. (2013) Kopatskaya, E. N., Kolotilov, E. A., & Arkharov, A. A. 2013, MNRAS, 434, 38
- Krist et al. (1997) Krist, J. E., Burrows, C. J., Stapelfeldt, K. R., et al. 1997, ApJ, 481, 447
- Kuffmeier et al. (2017) Kuffmeier, M., Haugbølle, T., & Nordlund, Å. 2017, ApJ, 846, 7
- Lim & Takakuwa (2006) Lim, J., & Takakuwa, S. 2006, ApJ, 653, 425
- Lim et al. (2016) Lim, J., Yeung, P. K. H., Hanawa, T., et al. 2016, ApJ, 826, 153
- Liu et al. (2014) Liu, H. B., Galván-Madrid, R., Forbrich, J., et al. 2014, ApJ, 780, 155
- Liu et al. (2016) Liu, H. B., Galván-Madrid, R., Vorobyov, E. I., et al. 2016a, ApJ, 816, L29
- Liu et al. (2016) Liu, H. B., Takami, M., Kudo, T., et al. 2016b, Science Advances, 2, e1500875
- Liu et al. (2017) Liu, H. B., Vorobyov, E. I., Dong, R., et al. 2017, A&A, 602, A19
- Lodato & Bertin (2001) Lodato, G., & Bertin, G. 2001, A&A, 375, 455
- Lodato & Bertin (2003) Lodato, G., & Bertin, G. 2003, A&A, 408, 1015
- Looney et al. (1997) Looney, L. W., Mundy, L. G., & Welch, W. J. 1997, ApJ, 484, L157
- Magakian et al. (2013) Magakian, T. Y., Nikogossian, E. H., Movsessian, T., et al. 2013, MNRAS, 432, 2685
- Mercer & Stamatellos (2017) Mercer, A., & Stamatellos, D. 2017, MNRAS, 465, 2
- Miller et al. (2011) Miller, A. A., Hillenbrand, L. A., Covey, K. R., et al. 2011, ApJ, 730, 80
- Momose et al. (1998) Momose, M., Ohashi, N., Kawabe, R., Nakano, T., & Hayashi, M. 1998, ApJ, 504, 314
- Movsessian et al. (2006) Movsessian, T. A., Khanzadyan, T., Aspin, C., et al. 2006, A&A, 455, 1001
- Munari et al. (2010) Munari, U., Milani, A., Valisa, P., & Semkov, E. 2010, The Astronomer’s Telegram, 2808
- Pascucci et al. (2016) Pascucci, I., Testi, L., Herczeg, G. J., et al. 2016, ApJ, 831, 125
- Peneva et al. (2010) Peneva, S. P., Semkov, E. H., Munari, U., & Birkle, K. 2010, A&A, 515, A24
- Pérez et al. (2010) Pérez, L. M., Lamb, J. W., Woody, D. P., et al. 2010, ApJ, 724, 493
- Persson (2004) Persson, R. 2004, IAU Circ., 8441, 2
- Pfalzner (2008) Pfalzner, S. 2008, A&A, 492, 735
- Pueyo et al. (2012) Pueyo, L., Hillenbrand, L., Vasisht, G., et al. 2012, ApJ, 757, 57
- Nayakshin & Lodato (2012) Nayakshin, S., & Lodato, G. 2012, MNRAS, 426, 70
- Qi (2003) Qi, C. 2003, SFChem 2002: Chemistry as a Diagnostic of Star Formation, 393
- Osorio et al. (2016) Osorio, M., Macías, E., Anglada, G., et al. 2016, ApJ, 825, L10
- Quanz et al. (2007) Quanz, S. P., Henning, T., Bouwman, J., Linz, H., & Lahuis, F. 2007a, ApJ, 658, 487
- Quanz et al. (2007) Quanz, S. P., Henning, T., Bouwman, J., et al. 2007b, ApJ, 668, 359
- Reipurth & Aspin (1997) Reipurth, B., & Aspin, C. 1997, AJ, 114, 2700
- Reipurth et al. (2004) Reipurth, B., Rodríguez, L. F., Anglada, G., & Bally, J. 2004, AJ, 127, 1736
- Reipurth & Aspin (2004) Reipurth, B., & Aspin, C. 2004a, ApJ, 606, L119
- Reipurth & Aspin (2004) Reipurth, B., & Aspin, C. 2004b, ApJ, 608, L65
- Reipurth et al. (2007) Reipurth, B., Aspin, C., Beck, T., et al. 2007a, AJ, 133, 1000
- Reipurth et al. (2007) Reipurth, B., Guimarães, M. M., Connelley, M. S., & Bally, J. 2007b, AJ, 134, 2272
- Reipurth & Aspin (2010) Reipurth, B., & Aspin, C. 2010, Evolution of Cosmic Objects through their Physical Activity, 19
- Rodriguez et al. (1990) Rodriguez, L. F., Hartmann, L. W., & Chavira, E. 1990, PASP, 102, 1413
- Rodríguez et al. (2003) Rodríguez, L. F., Curiel, S., Cantó, J., et al. 2003, ApJ, 583, 330
- Ruíz-Rodríguez et al. (2017) Ruíz-Rodríguez, D., Cieza, L. A., Williams, J. P., et al. 2017, MNRAS, 466, 3519
- Saito et al. (1996) Saito, M., Kawabe, R., Kitamura, Y., & Sunada, K. 1996, ApJ, 473, 464
- Sandell & Aspin (1998) Sandell, G., & Aspin, C. 1998, A&A, 333, 1016
- Sandell & Knee (2001) Sandell, G., & Knee, L. B. G. 2001, ApJ, 546, L49
- Sandell & Weintraub (2001) Sandell, G., & Weintraub, D. A. 2001, ApJS, 134, 115
- Sault et al. (1995) Sault, R. J., Teuben, P. J., & Wright, M. C. H. 1995, Astronomical Data Analysis Software and Systems IV, 77, 433
- Semkov et al. (2010) Semkov, E. H., Peneva, S. P., Munari, U., Milani, A., & Valisa, P. 2010, A&A, 523, L3
- Semkov et al. (2012) Semkov, E. H., Peneva, S. P., Munari, U., et al. 2012, A&A, 542, A43
- Staude & Neckel (1991) Staude, H. J., & Neckel, T. 1991, A&A, 244, L13
- Staude & Neckel (1992) Staude, H. J., & Neckel, T. 1992, ApJ, 400, 556
- Strom & Strom (1993) Strom, K. M., & Strom, S. E. 1993, ApJ, 412, L63
- Szeifert et al. (2010) Szeifert, T., Hubrig, S., Schöller, M., et al. 2010, A&A, 509, L7
- The et al. (1994) The, P. S., de Winter, D., & Perez, M. R. 1994, A&AS, 104,
- Tsukamoto et al. (2017) Tsukamoto, Y., Okuzumi, S., & Kataoka, A. 2017, ApJ, 838, 151
- van den Ancker et al. (2004) van den Ancker, M. E., Blondel, P. F. C., Tjin A Djie, H. R. E., et al. 2004, MNRAS, 349, 1516
- Vorobyov & Basu (2010) Vorobyov, E. I., & Basu, S. 2010, ApJ, 719, 1896
- Vorobyov (2013) Vorobyov, E. I. 2013, A&A, 552, A129
- Vorobyov & Basu (2015) Vorobyov, E. I., & Basu, S. 2015, ApJ, 805, 115
- Vorobyov (2016) Vorobyov, E. I. 2016, A&A, 590, A115
- Wang et al. (2004) Wang, H., Apai, D., Henning, T., & Pascucci, I. 2004, ApJ, 601, L83
- Welch et al. (2000) Welch, W. J., Hartmann, L., Helfer, T., & Briceño, C. 2000, ApJ, 540, 362
- Welin (1971) Welin, G. 1971, A&A, 12, 312
- Yen et al. (2017) Yen, H.-W., Takakuwa, S., Chu, Y.-H., et al. 2017, arXiv:1708.02384
- Yoo et al. (2017) Yoo, H., Lee, J.-E., Mairs, S., et al. 2017, arXiv:1709.04096
- Zurlo et al. (2017) Zurlo, A., Cieza, L. A., Williams, J. P., et al. 2017, MNRAS, 465, 834
- Zhu et al. (2007) Zhu, Z., Hartmann, L., Calvet, N., et al. 2007, ApJ, 669, 483
- Zhu et al. (2010) Zhu, Z., Hartmann, L., & Gammie, C. 2010, ApJ, 713, 1143
Appendix A Observational details
We summarize information about each track of the presented SMA observations in Table 2, including the starting date, array configuration, number of available antenna, approximated uv distance range, atmospheric optical depth at 225 GHz (), intermediate frequency (IF) coverage, central observing frequency (i.e., local oscillator frequency), observed target sources, and absolute flux reference source. We note that for track sharing observations which covered multiple target sources, the actually sampled uv distance ranges of individual target sources may slightly vary from the listed values.
 |
 |
 |
 |
Appendix B Millimeter variability/stability of V1647 Ori, NY Ori, NGC 2071 MM3 and Haro 5a/6a IRS
B.1 V1647 Ori
We present the observed fluxes and visibility amplitudes of V1647 Ori in Figure 13 and 14. There were two epochs of SMA observations at 225 GHz towards V1647 Ori. Figure 14 show that this source was spatially compact. We imaged individual epochs of observations limiting the uv distance range to 30 , and then measured fluxes in the image domain by performing two-dimensional Gaussian fits. The detected fluxes were 73 and 68 mJy on November 13 of 2012 and October 07 of 2015, respectively. Figure 13 shows that the fluxes in the overlapping baseline range agree very well at the two different observing epochs. We conclude that V1647 Ori has less than 10% millimeter flux variability over this time period. It is worthy of noting that the observed gain quasars, in particular, 0607-085 (Figure 13) presented large flux variability on as short as a few days timescales. To constrain millimeter flux variability to less than 10% precision, it is necessary to observe a stationary absolute flux standard source instead of adopting the tabulated flux values of gain calibration quasars.
B.2 NY Ori
NY Ori was observed on April 02 and 08 of 2014. We present the observed fluxes and visibility amplitudes of NY Ori in Figure 15 and 16. The April 02 epoch was taken at poor weather condition with 0.3-0.4 (Table 2). The thermal noise of the April 02 observations was larger than the assumed 10% flux error. However, due to the poor weather on this date, we may underestimated the potential absolute flux error. The derived fluxes on these two dates are 29 and 22 mJy, respectively. We consider the upper limit of the millimeter flux variability of NY Ori over this time period to be 15%.
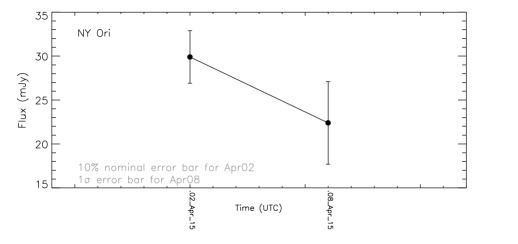 |
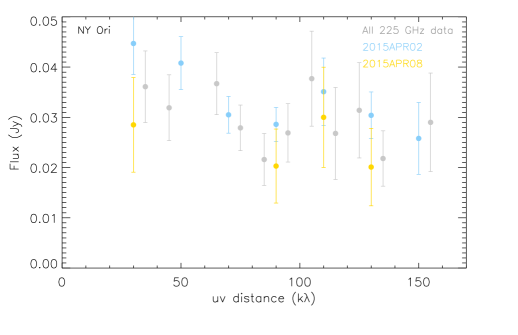 |
B.3 NGC 2071 MM3 and Haro 5a/6a IRS
The millimeter emission of dust around NGC 2071 MM3 and Haro 5a/6a IRS are spatially extended as compared with the angular scale of the SMA primary beam (Figure 1). Limited by uv coverages of the observations towards these sources, we were not able to produce images from individual epochs of observations. Based on the comparison of the visibility amplitudes (Figure 17-18), we tentatively consider that NGC 2071 MM3 has less than 20% millimeter flux variation in March 2014, and Haro 5a/6a IRS has less than 10% millimeter flux variation from March 2014 to September 2015.
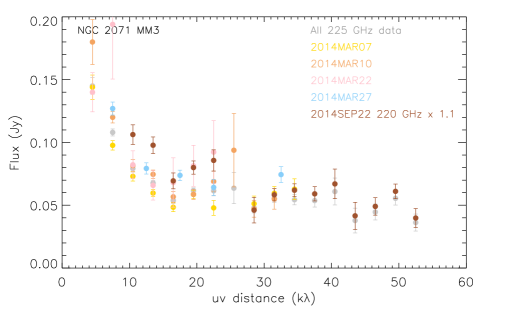 |
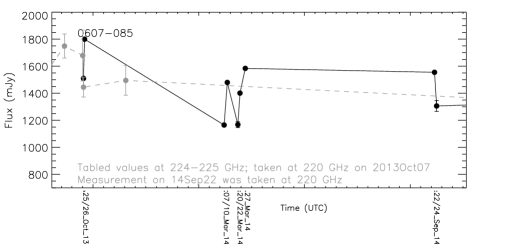 |
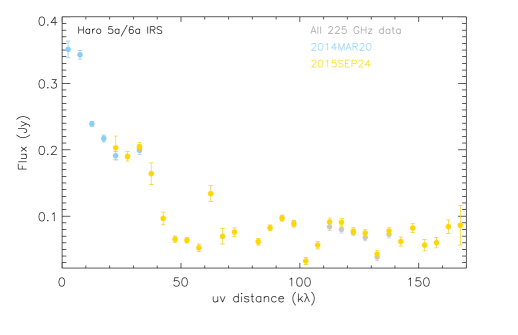
Appendix C Visibility amplitudes
We summarize the visibility amplitudes of SVS 13A, PP 13S, L1551 IRS 5, Haro 5a/6a IRS, and Parsamian 21 in Figure 19.
We scaled the 341 GHz amplitudes of Haro 5a/6a IRS to an observational frequency of 225 GHz based on the assumption of spectral index . The assumed appears too small at 15 uv distance, and is too large at 20 uv distance. This may imply that the 341 GHz emission of Haro 5a/6a IRS is becoming optically thick on 10′′ angular scales (4500 AU).
| Dates | Array Config. | # of Antennas | range | IFs | Central Freq. | Targets | Flux cal. | |
|---|---|---|---|---|---|---|---|---|
| (UTC) | () | (GHz) | (GHz) | |||||
| 2008May27 | SUB | 8 | 10-90 | 0.1-0.15 | 4-6 | 225 | V883 Ori | Uranus |
| 2008Jun17 | COM | 7 | 10-90 | 0.1-0.15 | 4-6 | 225 | V883 Ori | Uranus |
| 2008Dec06 | COM | 8 | 10-70 | 0.1-0.15 | 4-6 | 272 | FU Ori, V883 Ori | Callisto |
| 2011May20 | COM | 7 | 8-52 | 0.2-0.25 | 4-8 | 225 | HBC 722 | Saturn |
| 2012Nov13 | COM | 7 | 8-58 | 0.05-0.1 | 4-8 | 225 | V1647 Ori | Callisto |
| 2013Jun17 | EXT | 6 | 40-140 | 0.2 | 4-8 | 225 | IRAS 20588+5215N, V1057 Cyg, V1735 Cyg, V2494 Cyg, V2495 Cyg | Neptune |
| 2013Aug02 | COM | 5 | 8-52 | 0.1-0.15 | 4-8 | 224 | RNO 1B/1C | Uranus |
| 2013Oct24 | EXT | 6 | 23-138 | 0.2-0.3 | 4-8 | 224 | RNO 1B/1C | Uranus |
| 2013Oct25 | EXT | 5 | 20-158 | 0.1-0.2 | 4-8 | 224 | RNO 1B/1C, V2775 Ori, Z CMa | Uranus |
| 2013Oct26 | EXT | 6 | 30-140 | 0.2-0.25 | 4-8 | 224 | PP 13S, SVS 13, Z CMa, V2775 Ori | Neptune |
| 2013Nov09 | EXT | 7 | 30-170 | 0.4 | 4-8 | 224 | VY Tau, FU Ori | Uranus |
| 2013Nov22 | EXT | 7 | 25-175 | 0.1-0.4 | 4-8 | 224 | VY Tau, FU Ori | Callisto |
| 2014Feb10 | SUB | 6 | 4-19 | 0.15 | 4-8 | 224 | RNO 1B/1C | Callisto |
| 2014Mar07 | SUB | 7 | 5-35 | 0.2-0.3 | 4-8 | 225 | NGC2071 MM3, AR 6A/6B | Callisto |
| 2014Mar10 | SUB | 7 | 5-35 | 0.1-0.25 | 4-8 | 225 | NGC2071 MM3, AR 6A/6B | Titan |
| 2014Mar20 | SUB-N | 7 | 5-140/7-52 | 0.07 | 4-6 | 225/342 (dual RX) | Haro 5a6a IRS, Z CMa | Callisto |
| 2014Mar22 | SUB | 7 | 3-35 | 0.2 | 4-8 | 225 | NGC2071 MM3, AR 6A/6B | Callisto |
| 2014Mar27 | SUB-N | 5 | 5-140 | 0.1 | 4-8 | 225 | NGC2071 MM3, AR 6A/6B | Callisto |
| 2014Apr08 | EXT | 6 | 35-160 | 0.05 | 4-8 | 266 | Parsamian 21 | Titan |
| 2014Apr22 | COM-N | 7 | 15-90 | 0.1-0.2 | 4-6 | 225 | V1515 Cyg, V733 Cep | Neptune |
Table 2. (Continued)
| Dates | Array Config. | # of Antennas | range | IFs | Central Freq. | Targets | Flux cal. | |
|---|---|---|---|---|---|---|---|---|
| (UTC) | () | (GHz) | (GHz) | |||||
| 2014Jun04 | COM | 7 | 10-60 | 0.15-0.2 | 4-8 | 225 | V1057 Cyg, V2494 Cyg | Neptune |
| 2014Jun12 | COM | 8 | 10-79 | 0.15 | 4-6 | 272 | V1515 Cyg, V2495 Cyg | Neptune |
| 2014Jun13 | COM | 8 | 8-52 | 0.1 | 4-8 | 225 | V733 Cep | Neptune |
| 2014Jul25 | SUB | 6 | 5-32 | 0.1-0.15 | 4-8 | 225 | RNO 1B/1C | Neptune |
| 2014Aug17 | VEX | 6 | 30-320 | 0.05 | 4-8 | 225 | V1057 Cyg, V2494 Cyg, V2495 Cyg | Titan |
| 2014Aug20 | VEX | 7 | 30-320 | 0.1-0.15 | 4-8 | 225 | V1057 Cyg, V2494 Cyg, V2495 Cyg | Neptune |
| 2014Aug27 | EXT | 8 | 30-200 | 0.15 | 4-8 | 272 | V883 Ori, FU Ori | Uranus |
| 2014Sep02 | EXT | 7 | 30-150 | 0.1 | 4-6 | 236 | V1515 Cyg, V733 Cep | Neptune |
| 2014Sep22 | COM | 7 | 10-55 | 0.15-0.2 | 4-8 | 220 | NGC2071 MM3, AR 6A/6B | Uranus |
| 2015Jan22 | VEX | 7 | 25-390 | 0.07 | 4-8, 8-9.5, 10.5-12 | 225 | XZ Tau, VY tau, V1118 Ori, V1143 Ori | Callisto |
| 2015Jan26 | VEX | 5 | 25-350 | 0.1 | 4-8, 8-9.5, 10.5-12 | 225 | VY tau, V1118 Ori, V1143 Ori | Callisto |
| 2015Jan27 | VEX | 6 | 25-350 | 0.07 | 4-8, 8-9.5, 10.5-12 | 225 | VY tau, V1118 Ori, V1143 Ori | Callisto |
| 2015Feb03 | EXT | 6 | 25-175 | 0.3 | 4-8 | 225 | VY tau, V1118 Ori, V1143 Ori | Callisto |
| 2015Mar08 | EXT | 6 | 25-175 | 0.1 | 4-8 | 225 | VY tau, V1118 Ori, V1143 Ori | Ganymede |
| 2015Apr02 | EXT | 6 | 30-170 | 0.3-0.4 | 4-8 | 225 | NY Ori, V1118 Ori, V1143 Ori | Ganymede |
| 2015Apr08 | EXT | 5 | 20-140 | 0.15 | 4-8 | 225 | NY Ori, V1118 Ori, V1143 Ori | Titan |
| 2015Sep18 | EXT | 7 | 30-177 | 0.1 | 4-8, 8-9.5, 10.5-12 | 225 | L1551 IRS5 | Uranus |
| 2015Sep24 | EXT | 7 | 24-167 | 0.2 | 4-8, 8-9.5, 10.5-12 | 225 | Haro 5a/6a IRS | Uranus |
| 2015Oct07 | EXT | 7 | 25-175 | 0.07 | 4-8, 8-9.5, 10.5-12 | 225 | V1647 Ori | Uranus |
| 2017Jan30 | SUB | 7 | 7.5-62/8-64 | 0.08 | 4-12 | 259/275 (dual RX) | FU Ori | Uranus |

|

|

|
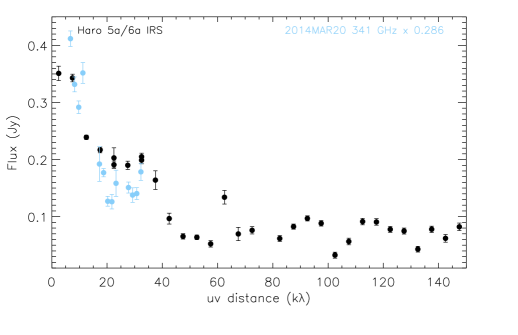
|

|

|

|