Precise Frequency Measurement of the 21S0-31D2 Two-Photon Transition in atomic 4He
Abstract
We present the first precise frequency measurement of the 21S0-31D2 two-photon transition in 4He at 1009 nm. The laser source at 1009 nm is stabilized on an optical frequency comb to perform the absolute frequency measurement. The absolute frequency of 21S0-31D2 transition is experimentally determined to be 594 414 291 803(13) kHz with a relative uncertainty of 1.6 10-11 which is more precise than previous determination by a factor of 25. Combined with the theoretical ionization energy of the 31D2 state, the ionization energy of the21S0 state is determined to be 960 332 040 866(24) kHz. In addition, the deduced 21S0 and 23S1 Lamb shifts are 2806.817(24) and 4058.8(24) MHz respectively which are 1.6 times better than previous determinations.
- Usage
-
Secondary publications and information retrieval purposes.
- PACS numbers
-
May be entered using the
\pacs{#1}command. - Structure
-
You may use the description environment to structure your abstract; use the optional argument of the
\itemcommand to give the category of each item.
pacs:
Valid PACS appear hereI INTRODUCTION
Helium is the simplest multi-electron atom and it plays a crucial role in testing many-body quantum electrodynamics (QED) calculations. Recently, the electronic structure of helium has been calculated to a very high precision Morton et al. (2006); Drake and Yan (2008); Yerokhin and Pachucki (2010); Zhang et al. (2015); Pachucki et al. (2017). In particular, the metastable 21S0 and 23S1states of are of great experimental interest in spectroscopy studies due to their larger effects of Lamb shift and accessible light sources. To determine the Lamb shift of the 2S states, measurements of the 2S-nD two-photon transitions are typically chosen since the theoretical uncertainties of the D states are much smaller than the low-lying S and P states. For example, the Lamb shift of the 23S1 state has been determined using the 23S1-33D1 two-photon transition Dorrer et al. (1997) and the Lamb shift of the 21S0 state has been determined using the 21S0 - n1D2 two-photon transitions (7 n 20) Lichten et al. (1991). In addition, the high-precise frequency measurement of the 21S0 - 23S1 Van Rooij et al. (2011) doubly forbidden transition at 1557 nm serves as a bridge to connect the triplet and singlet states. For example, the Lamb shift of the 21S0 state can be determined from the 23S1-33D1 transition Dorrer et al. (1997) and 23S1-21S0 transition Van Rooij et al. (2011).
Due to the recent developments of the optical frequency comb (OFC), several OFC-based measurements are performed to directly determine the absolute transition frequencies of He Van Rooij et al. (2011); Pastor et al. (2004, 2012); Luo et al. (2013a, b); Notermans and Vassen (2014); Luo et al. (2016). The best previous determination of the Lamb shift of the 21S0 state in 4He, obtained from the 4He 23S1-23P0 [10], 23P0-33D1 Luo et al. (2016) and 23S1-21S0 transitions Van Rooij et al. (2011), has an uncertainty of 35 kHz. In this work, we present our precise absolute frequency measurement of the singlet 21S0-31D2 two-photon transition at 1009 nm. The uncertainty reaches 13 kHz and we are able to reduce the uncertainty of the ionization energy of 21S0 state and the Lamb shift of both the 21S0 and 23S1 states to 24 kHz, which is limited mostly by the uncertainty of the theoretical ionization energy of the 3D states (20 kHz).
II EXPERIMENTAL SETUP
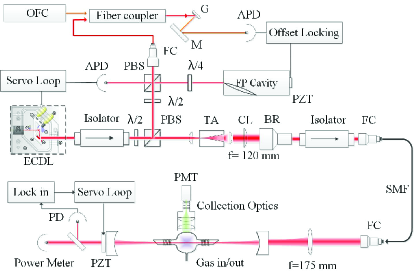
The schematic of our experimental setup is shown in Fig. 1. The 1009 nm light source used for the 21S0-31D2 two-photon transition in 4He is a homemade external-cavity diode laser (ECDL). The laser is pre-stabilized onto a Fabry-Prot (FP) cavity by the Pound-Drever-Hall locking technique Drever et al. (1983), and its laser linewidth is reduced to 250 kHz in 1 ms intergration time observed using the beat note between ECDL and one comb line of an OFC. The OFC is based on a femtosecond Er-doped fiber laser Peng et al. (2007). For our experiment, we amplify its output and extend its supercontinuum spectrum from 1050 nm to 980 nm by a high nonlinear fiber. Its repetition rate (fr, 250 MHz) and offset frequency (fo) are both locked to frequency synthesizers referenced to a cesium clock (Microsemi. 5071A). The accuracy of the OFC is better than 1 10-12 at 1000 sec. integration time. The laser frequency is locked on one comb line of the OFC by offset locking technique. To increase the optical power for the two-photon transition, the output power of the ECDL is boosted to 2 W by a tapered amplifier (TA). After passing through an optical isolator and a single-mode optical fiber (SMF), we have a 750 mW laser beam with TEM00 profile for the experiment.
Helium gas is filled in a glass cell and a radio-frequency (RF) discharge populates the 21S0 metastable state. The glass cell is a sphere (6 cm in diameter) sealed with Brewster windows at both ends. A large spherical cell is necessary to avoid quenching of the metastable atoms due to collision on the wall. The glass cell is pumped by a turbomolecular pumping system to a pressure below 10-6 Torr and its pressure can be kept below 10-6 Torr by a getter (SAES CapaciTorr D 400-2) over one week after the cell is sealed. When the cell is filled with 4He (typically 30-200 mTorr), the variation of the helium pressure is less than 1 over 2 weeks with RF discharge on. To enhance the optical power to excite the two-photon transition and to obtain perfect overlapping counter-propagating laser beams, the cell is placed in a power built-up cavity formed by two spherical mirrors (200 mm radius of curvature, and 350 mm apart). One mirror is mounted on a PZT for cavity length tuning. To keep the cavity resonant with the laser frequency, the length of the cavity is locked on the transmission peak by dithering its PZT and the transmitted optical signal is demodulated using a lock-in amplifier. To eliminate any possible Zeeman effect, the Earth magnetic field is shielded by a -metal box. The two-photon transition is detected by monitoring the 31D2-21P1 fluorescence at 668 nm which is collected with an optical system consisting of two f = 6 cm lenses (3 inches in diameter), an NIR filter, a 25.4 mm aperture, a 675 nm band-pass filter (30 nm FWHM) and a f = 50 mm lens in front of a photomultiplier tube (PMT). To avoid parasitic light of the RF discharge, the discharge is pulsed at 10 kHz and the detection is carried out in the afterglow regime. The RF power is first switched on for a 5 s duration, and then the PMT signal is collected for a 40 s duration at 20 s after the RF is turned off. The laser frequency is scanned step by step with an interval of approximate 1.6 MHz by tuning the repetition rate of the OFC. The fluorescence signal and fb, beat frequency between the ECDL and the OFC, are recorded by the computer for 6 seconds for each frequency step. The absolute frequency of the laser is given by: f = nfr+fo+fb, where n is the mode number of the OFC. In the meantime, the laser frequency is monitored by a wavelength meter (HighFinesse WD30) with a resolution of 10 MHz to assist us to determine the OFC mode number n. The working timing sequence is accurately controlled by computer.
III EXPERIMENTAL RESULTS
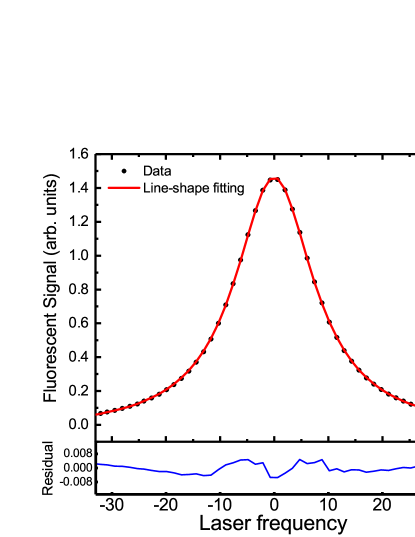
A typical spectrum of the 21S0-31D2 two-photon transition in 4He is shown in Fig. 2. The locked laser frequency is scanned by tuning the repetition rate of the OFC. The spectrum has a linear background which is below 1 10-3 with respect to the signal. Since the ratio between the atomic lifetime of the 31D2 state and the transit time of helium atom across the laser beam at the center of the power built-up cavity is 3 approximately, according to Ref. Biraben et al. (1979), we employ a Lorentzian line shape with a linear background to fit the spectrum, and the fitting achieves R-square 99.99 . The fitting provides us the linewidth and the center frequency of the observed 21S0-31D2 transition.
| items | uncertainty |
|---|---|
| Statistical uncertainty | 12.8 kHz |
| Second-order Doppler effect | 1 kHz |
| Zeeman effect | 1 kHz |
| OFC accuracy (multiple a factor of 2) | 4 kHz |
| Overall uncertainty | 13 kHz |
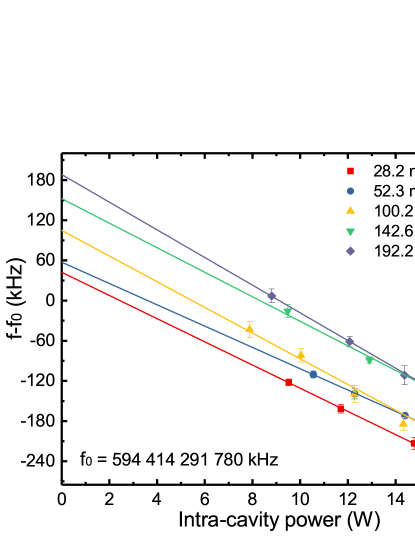
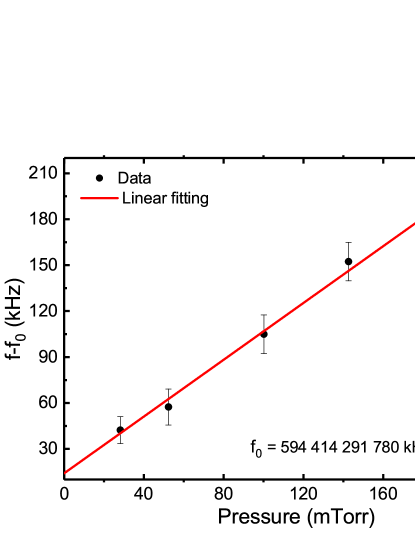
We have measured the spectrum for five different pressures from 28 to 192 mTorr. For each pressure, the two-photon transition frequencies were measured with intra-cavity optical power from 8 to 16 W as shown in Fig. 3. Each data point is obtained from 12 spectrums. The absolute pressure is measured by a MKS Baratron with an accuracy better than 1 and its zero point is regularly checked at the pressure below 1 10-6 Torr. Furthermore, the intra-cavity power is determined by cavity transmitting power, which is measured by a power-meter (Thorlabs 302C) with an accuracy of 3. Linear extrapolation to zero intra-cavity power allows us to correct the transition frequency shift caused by the ac-Stark shift. The ac-Stark shift has major contributions from 3D-nF states. As pressure increases, the absolute value of the slope of the transition frequency versus intra-cavity power varies from 20.6(2.2) kHz/W to 15.9(1.5) kHz/W. The transition frequencies at zero intra-cavity power in Fig. 3 are plotted versus pressure in Fig. 4 to determine the transition center frequency at zero power and zero pressure. The coefficient of transition frequency versus pressure is 927(92) kHz/Torr. The effects of other experimental conditions are also investigated. The RF discharge does not have significant effect on the transition frequency and spectral linewidth as we vary the RF power from 1 to 5 W.
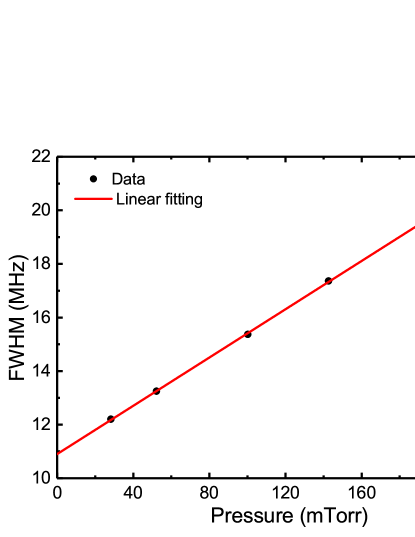
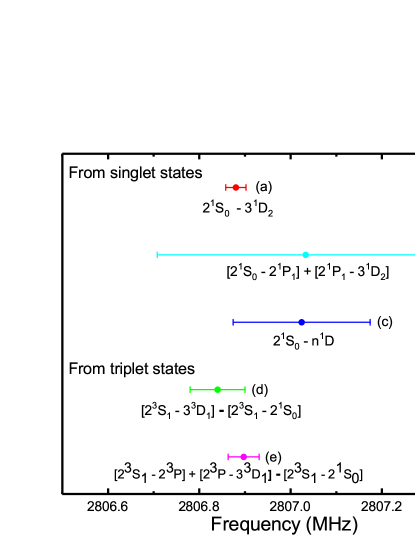
This can be understood since we take the data after the discharge is turned off. In addition, we measured the residual magnetic field inside the shielding -metal box and it is below 1 mG. Therefore, the Zeeman shift is below 1 kHz. Finally, the second-order Doppler effect is estimated. Assuming the discharge temperature is between 300 and 400 K, the second-order Doppler shift is 7.2(10) kHz. The overall experimental uncertainty is listed in Table 1. Taking the frequency shift and uncertainties into account, the frequency of the 21S0-31D2 transition in 4He is determined to be 594 414 291 803(13) kHz. This result is in good agreement with a previous determination, 594 414 291 935(334) kHz, using the 21S0-21P1 Luo et al. (2013a) and the 21P1-31D2 transitions Luo et al. (2013b), and the precision is improved by a factor of 25. We also investigate the linewidth of 21S0-31D2 transition shown in Fig. 5. The natural linewidth of 21S0-31D2 transition is mainly contributed from the lifetime of the 31D2 state. By extrapolating the linewidth to zero pressure and zero power, the measured linewidth is 11.21(12) MHz which is in reasonable agreement with the square root of the quadratic sum of natural linewidth (10.36 MHz Wedding et al. (1990)) and estimated transit time broadening linewidth (3.6(2) MHz) using the atomic velocity and the waist beam size in the power built-up cavity. Combining the theoretical value of the 31D2 ionization energy 365 917 749.02(2) MHz from Ref. Morton et al. (2006) , we obtain the 21S0 ionization energy: 960 332 040 866(24) kHz. The contribution of the uncertainty is due to the theoretical calculation in 31D2 state (20 kHz) and experimental uncertainty (13 kHz) listed in Table 1. To compare with theories on the 21S0 state, we subtract the nonrelativistic energy, the first relativistic corrections and the finite nuclear size correction calculated in Ref. Pachucki et al. (2017), from the theoretical value of the 21S0 ionization energy, 960 332 038.0(1.7) MHz Pachucki et al. (2017). The 21S0 Lamb shift is deduced to be L(21S0) = 2806.864(24) MHz. In Fig. 6, we compare our determination of the 21S0 Lamb shift with previous results by combining the theoretical values in 3D states, and the triplet-state measurements using the 23S1-21S0 measurement Van Rooij et al. (2011). Our result is in good agreement with other determinations and is the most precise measurements at present, and it provides another independent test of the QED atomic theory. We can make another comparison to avoid the large theoretical uncertainty of 2S states. We combine our result with 23S1-21S0 Van Rooij et al. (2011), 23S1-23P0 Pastor et al. (2012) and 23P0-33D1 Luo et al. (2016) transitions to obtain the separation between 31D2 and 33D1 states, which has been of theoretical interest for the singlet-triplet mixing in 3D state. The result is in reasonable agreement with theoretical calculation Morton et al. (2006) and is listed in Table 2. Furthermore, the Lamb shifts of the 21S0 and 21P1 states can be deduced by this work and previous measurement Luo et al. (2013a). All deduced Lamb shifts are listed in Table 3 along with the theoretical values.
| 21S0-31D2 | 33D1-31D2 | |
|---|---|---|
| This work | 111combined with Ref. Van Rooij et al. (2011); Pastor et al. (2012); Luo et al. (2016) | |
| Theory | 222Ref. Morton et al. (2006); Drake and Yan (2008) | 333Ref. Morton et al. (2006) |
| Difference |
| State | This work | Theory Pachucki et al. (2017) |
|---|---|---|
| 21S0 | 444combined with Ref. Morton et al. (2006); Pachucki et al. (2017) | |
| 23S1 | 555combined with Ref. Morton et al. (2006); Van Rooij et al. (2011); Pachucki et al. (2017) | |
| 21P1 | 666combined with Ref. Morton et al. (2006); Luo et al. (2013b); Pachucki et al. (2017) |
IV CONCLUSION
In conclusion, the absolute frequency of the 21S0-31D2 two-photon transition of 4He at 1009 nm is measured for the first time and a precision of 13 kHz is achieved. Our result is more precise than previous determination using 21S0-21P1 Luo et al. (2013a) and 21P1-31D2 Luo et al. (2013b) transitions by a factor of 25. A new determination of the ionization energy of the 21S0 state is obtained by taking the theoretical value of the 31D2 state. It is consistent with the best previous determination with 1.6 times improvement in precision. More importantly we can deduce the most precise Lamb shift of the 21S0 state. In addition, the energy separation between the 33D1 and 31D2 states is deduced using present result and other previous measurements and it agrees with theoretical calculation. In the near future, the absolute frequency measurement for 21S0-31D2 two-photon transitions in 3He will be performed to investigate the hyperfine structure of 31D2 state in 3He and the isotope shift between 3He and 4He. The long-standing discrepancy of the 3He 33D1-31D2 separation Morton et al. (2006); Derouard et al. (1980) will be resolved.
Acknowledgements.
We thank Chunghwa Telecom Lab. for lending us a cesium clock. This project is supported by the Ministry of Science and Technology and the Ministry of Education of Taiwan. L.-B. Wang acknowledges support from Kenda Foundation as a Golden-Jade fellow.References
- Morton et al. (2006) D. C. Morton, Q. Wu, and G. W. Drake, Can. J. Phys. 84, 83 (2006).
- Drake and Yan (2008) G. W. Drake and Z.-C. Yan, Can. J. Phys. 86, 45 (2008).
- Yerokhin and Pachucki (2010) V. A. Yerokhin and K. Pachucki, Phys. Rev. A 81, 022507 (2010).
- Zhang et al. (2015) P.-P. Zhang, Z.-X. Zhong, Z.-C. Yan, and T.-Y. Shi, Chin. Phys. B 24 (2015).
- Pachucki et al. (2017) K. Pachucki, V. Patkóš, and V. Yerokhin, Phys. Rev. A 95, 062510 (2017).
- Dorrer et al. (1997) C. Dorrer, F. Nez, B. De Beauvoir, L. Julien, and F. Biraben, Phys. Rev. Lett. 78, 3658 (1997).
- Lichten et al. (1991) W. Lichten, D. Shiner, and Z.-X. Zhou, Phys. Rev. A 43, 1663 (1991).
- Van Rooij et al. (2011) R. Van Rooij, J. S. Borbely, J. Simonet, M. Hoogerland, K. Eikema, R. Rozendaal, and W. Vassen, Science 333, 196 (2011).
- Pastor et al. (2004) P. C. Pastor, G. Giusfredi, P. De Natale, G. Hagel, C. De Mauro, and M. Inguscio, Phys. Rev. Lett. 92, 023001 (2004).
- Pastor et al. (2012) P. C. Pastor, L. Consolino, G. Giusfredi, P. De Natale, M. Inguscio, V. Yerokhin, and K. Pachucki, Physical review letters 108, 143001 (2012).
- Luo et al. (2013a) P.-L. Luo, J.-L. Peng, J.-T. Shy, and L.-B. Wang, Phys. Rev. Lett. 111, 013002 (2013a).
- Luo et al. (2013b) P.-L. Luo, Y.-C. Guan, J.-L. Peng, J.-T. Shy, and L.-B. Wang, Phys. Rev. A 88, 054501 (2013b).
- Notermans and Vassen (2014) R. Notermans and W. Vassen, Phys. Rev. Lett. 112, 253002 (2014).
- Luo et al. (2016) P.-L. Luo, J.-L. Peng, J. Hu, Y. Feng, L.-B. Wang, and J.-T. Shy, Phys. Rev. A 94, 062507 (2016).
- Drever et al. (1983) R. Drever, J. L. Hall, F. Kowalski, J. Hough, G. Ford, A. Munley, and H. Ward, Appl. Phys. B 31, 97 (1983).
- Peng et al. (2007) J.-L. Peng, H. Ahn, R.-H. Shu, H.-C. Chui, and J. Nicholson, Appl. Phys. B 86, 49 (2007).
- Biraben et al. (1979) F. Biraben, M. Bassini, and B. Cagnac, J. Phys. (Paris) 40, 445 (1979).
- Wedding et al. (1990) A. Wedding, A. Mikosza, and J. Williams, J. Electron. Spectrosc. Relat. Phenom. 52, 689 (1990).
- Derouard et al. (1980) J. Derouard, M. Lombardi, and R. Jost, J. Phys. (Paris) 41, 819 (1980).