Multi-Epoch Radio Imaging of -ray Nova V959 Mon
Abstract
V959 Mon (Nova Mon 2012) was first detected by the Fermi Large Area Telescope in June 2012, as a transient gamma-ray source. Subsequent optical observations showed that this gamma-ray emission was due to a classical nova explosion. Multi-frequency observations of V959 Mon with the VLA between June and September 2012 revealed dramatic brightening, and a spectrum that steepened with increasing frequency. High resolution radio images of V959 Mon using e-MERLIN are presented here, at six epochs between September 2012 and February 2014 which show morphological evolution of the source. While early e-MERLIN observations of V959 Mon show an east-west elongation in the ejecta morphology, subsequent observations suggest that the ejecta become elongated in the north-south direction. Our high-resolution observations of this surprising evolution in the structure of V959 Mon can assist us in further understanding the behaviour and morphology of nova ejecta.
keywords:
novae,cataclysmic variables - binaries - stars:individual(V959 Mon)1 Introduction
1.1 Classical Novae
A nova is a cataclysmic variable star consisting of a white dwarf (WD) and a main sequence, subgiant or red giant companion. In a nova explosion, the white dwarf undergoes a thermonuclear runaway (TNR) on its surface, as a result of build-up of accreted material from its companion. This leads to a large expulsion of matter from the WD surface, as well as a dramatic increase in the optical magnitude of the system. Novae typically expel between M⊙ and M⊙ of matter during an explosion, at velocities that can range from a few hundred to several thousand km s-1 (see Bode & Evans, 2008).
Novae occur in the Milky Way at a rate of about 35 yr-1 (Shafter, 1997). Some novae have been observed to recur; see, for example, Schaefer (2010). Such recurring novae can be considered candidates for Type 1a supernovae, provided the mass accreted from the companion between outbursts is greater than the mass lost from the WD during outbursts.
Nova explosions emit across the electromagnetic spectrum. In the optical, their light curves feature a sudden increase in brightness (corresponding to the time of the explosion) followed by a gradual decrease back to the pre-outburst levels. Several classical novae have now been detected as GeV -ray sources by the Fermi satellite, indicating that relativistic particle acceleration (due to shocks) takes place in nova ejecta (see Fermi LAT Collaboration, 2014). Novae are also radio sources, primarily due to thermal bremsstrahlung, although some also show evidence of synchrotron radiation; an indication of the presence of shocks in nova explosions. Novae are slower to rise to maximum brightness in the radio, with the peak magnitude occurring some time (days to months) after the optical outburst.
Attempts have been made to establish a model of ejecta expansion in novae, based on the observed radio light curves. Most of these models, for example the “Hubble flow” model, (Hjellming et al., 1979) assume an isothermal, smooth, spherical outflow. The Hubble flow model specifically assumes that all the material is ejected at once. It further assumes that different components of the gas have different velocities. The result is a thick shell, with the slowest parts of the gas at the inner radius, and the fastest parts at the outer radius. This model predicts a rise in radio intensity, and a decay at late times once the source has become optically thin. In between these times, the intensity decays as . Simulated light curves using these assumptions have been used to fit observed radio light curves of novae (see for example Seaquist & Palimaka, 1977). However, more recent radio light curves of novae indicate rather poor agreement with these simple models (see for example Krauss et al., 2011). Furthermore, many novae which have been resolved and imaged by radio instruments appear to display a non-spherical morphology (e.g. Taylor et al., 1988, Eyres et al., 2000, Heywood et al., 2005). Some studies, for example Ribeiro et al. (2014) and Heywood and O’Brien (2007), have used simulated radio emission to investigate the effects of a non-spherical ejecta on the nova light curve.
1.2 V959 Mon
V959 Mon, also known as Nova Mon 2012, was first detected on June 19 2012 by the Fermi Large Area Telescope, as a GeV -ray transient source (Cheung et al., 2012a) named J0639+0548. Twelve and sixteen days after this discovery, Chomiuk et al. (2014) obtained radio spectra of J0639+0548, using the Karl G. Jansky Very Large Array (VLA). The spectra were unusually flat for a nova – novae usually emit in the radio due to thermal bremsstrahlung (and at such an early stage, the ejecta would be expected to be optically thick); however, a flat spectrum such as the one observed is indicative of synchrotron emission. Following the Fermi detection, V959 Mon was obscured by the Sun, and thus could not be observed optically (Munari et al., 2013a).
In August 2012, Fujikawa et al. (2012) detected an optical nova in the same region of the sky as J0639+0548, with a magnitude of V 9.4. This newly-discovered nova was connected to the -ray source by Cheung et al. (2012b), who deduced that the -ray emission discovered in J0639+0548 had been emitted from the new nova, and that the GeV emission was likely to have taken place around the beginning of the nova explosion.
From the time of V959 Mon’s discovery as a nova, it has been observed across many frequency bands, including X-ray, UV, optical, IR and radio. Spectroscopic studies indicate that V959 Mon is an ONe nova (see Munari et al., 2013b; Shore et al., 2013). Swift XRT observations detected a strong hard X-ray source with a temperature of K (Nelson et al., 2012). Both optical and X-ray observations have confirmed a 7.1 hour orbital period in V959 Mon (see Osborne, Beardmore & Page, 2013, Page et al., 2013, Wagner, Woodward & Starrfield, 2013). Through the comparison of synthetic line spectra with line spectra observed in V959 Mon, Ribeiro et al. (2013) suggested that V959 Mon had a bipolar ejecta structure, with an angle of inclination (defined as the angle between the orbital plane and the plane of the sky) of . A high inclination angle was also found by Page et al. (2013). The distance to V959 Mon was estimated by Munari et al. (2013b) to be 1.5 kpc. An estimate of the distance was also made by Linford et al. (2015), who found that the distance lay between 0.9 0.2 and 2.2 0.4 kpc, with a probable distance of 1.4 0.4 kpc.
European Very Long Baseline Interferometry (VLBI) Network (EVN) observations (made in September 2012) at 2-7 milliarcsecond (mas) resolution of V959 Mon at 5 GHz by O’Brien et al. (2012) found it to be a double radio source, with 2 compact components extending to the north-west and south-east. Observations from October 2012 showed that the two components had moved further apart, with a proper motion of 0.45 milliarcseconds per day. Subsequent observations (113 days after the Fermi discovery of V959 Mon) detected a third VLBI component. The brightest VLBI component was also resolved by the Very Long Baseline Array (VLBA). It was found to have a peak brightness temperature of K, indicative of non-thermal (synchrotron) emission (see Chomiuk et al., 2014).
Following the initial observations made by Chomiuk et al. (2014), VLA observations of V959 Mon continued up to about 615 days after the Fermi discovery. 126 days after the Fermi detection (day 0), a clearly bipolar structure extending from east to west was observed. However, 16 months later (day 615), the geometry of the ejecta had changed from east-west to north-south. This evolution was also described by Linford et al. (2015), who describe VLA observations between 126 and 199 days after the Fermi discovery, and between 615 and 703 days. Linford et al. (2015) also found that between day 199 and day 615, the morphology of V959 Mon had changed its orientation from an east-west elongation to a north-south elongation. Light curves made using the observations of Chomiuk et al. (2014) were fit with model curves based on the “Hubble flow” model (Hjellming et al., 1979). Assuming an outer shell velocity of km s-1, it was found that the models were best fit using values of km s-1 for the velocity of the inner radius of the shell, for the ejecta mass, and an electron temperature of K. While this estimate of the ejecta mass is plausible, it was noted by Chomiuk et al. (2014) that the observed morphology of V959 Mon was aspherical, and therefore that the Hubble flow model was unlikely to provide a complete description of V959 Mon’s behaviour.
V959 Mon exhibits several traits that are contrary to the standard models of mass ejection from novae. Most notable are its emission of GeV -rays, and its aspherical and variable ejecta – first appearing as two components extended from south-west to north-east, then as a bipolar structure extending from east to west, and subsequently undergoing a 90∘ shift, appearing as a bipolar structure extending from north to south.
Chomiuk et al. (2014) have proposed a theoretical explanation for these features. Firstly, that the orbiting binary system transfers some of its orbital energy to the nova ejecta. They suggest that this leads to a slow expansion of ejecta along the orbital plane (suggested to be north-south in the case of V959 Mon and given its high inclination). At early times, this is difficult to detect and resolve, as it expands very slowly. Secondly, the white dwarf expels fast winds, which propagate more easily along the low-density regions at the poles. This fast-expanding body of ejecta, which would appear from east to west in the case of V959 Mon (perpendicular to the orbital plane) would dominate radio images while optically thick. Eventually this rapidly expanding ejecta would become optically thin, leaving the slower-moving north-south ejecta, still optically thick, to dominate radio images. This model would explain V959 Mon’s shift from an east-west orientation to a north-south orientation.
The model proposed by Chomiuk et al. (2014) would also provide an explanation for the presence of ray emission and for the non-thermal VLBI components detected; interaction between the slow-moving and fast-moving phases of ejection would lead to strong shocks at their interface, generating the high energies required to produce these two effects.
2 Observations
The observations presented here were made with the e-MERLIN array over 6 epochs: 2012 September 13 and 18, 2012 November 12, 14 and 15, 2012 November 22-24, 2013 February 26, 2013 October 11-14 and 2014 February 21-22. All seven antennas in the array were used for the February 2013 observations; the Lovell telescope was omitted for the other epochs. The observations were made in the C Band (4-8 GHz), providing a resolution of around 40 milliarcseconds, and with a bandwidth of 512 MHz. The first three epochs had a central frequency of 5.7 GHz, and the subsequent three had a central frequency of 5.0 GHz. The bandwidth was divided into 4 intermediate frequency bands (IFs), each containing 512 channels. The data were averaged such that each IF effectively contained 128 channels. The total times spent observing the target source, as well as the average scan lengths, are given in Table 1.
| Epoch |
|
|
||||
|---|---|---|---|---|---|---|
| 2012 Sep 13 and 18 | 8 | 7.029e-5 | ||||
| 2012 Nov 12, 14 and 15 | 18.5 | 1.3e-4 | ||||
| 2012 Nov 22-24 | 8.5 | 1.36e-4 | ||||
| 2013 Feb 26 | 4 | 9.924e-5 | ||||
| 2013 Oct 11-14 | 7 | 8.82e-5 | ||||
| 2014 Feb 21-22 | 12 | 2.526e-5 |
The calibration, reduction and imaging of each epoch was carried out with the Astronomical Image Processing System (AIPS), using standard tasks. In all cases, J0645+0541 was observed as a phase calibrator, 3C286 as a flux calibrator and OQ208 as a band-pass calibrator. The images were constructed using the different CLEAN restoring beams fitted to each one. They were then re-constructed using the same 70 mas 70 mas circular beam for each epoch, so that the morphology could be more reliably compared from epoch to epoch.
3 Results
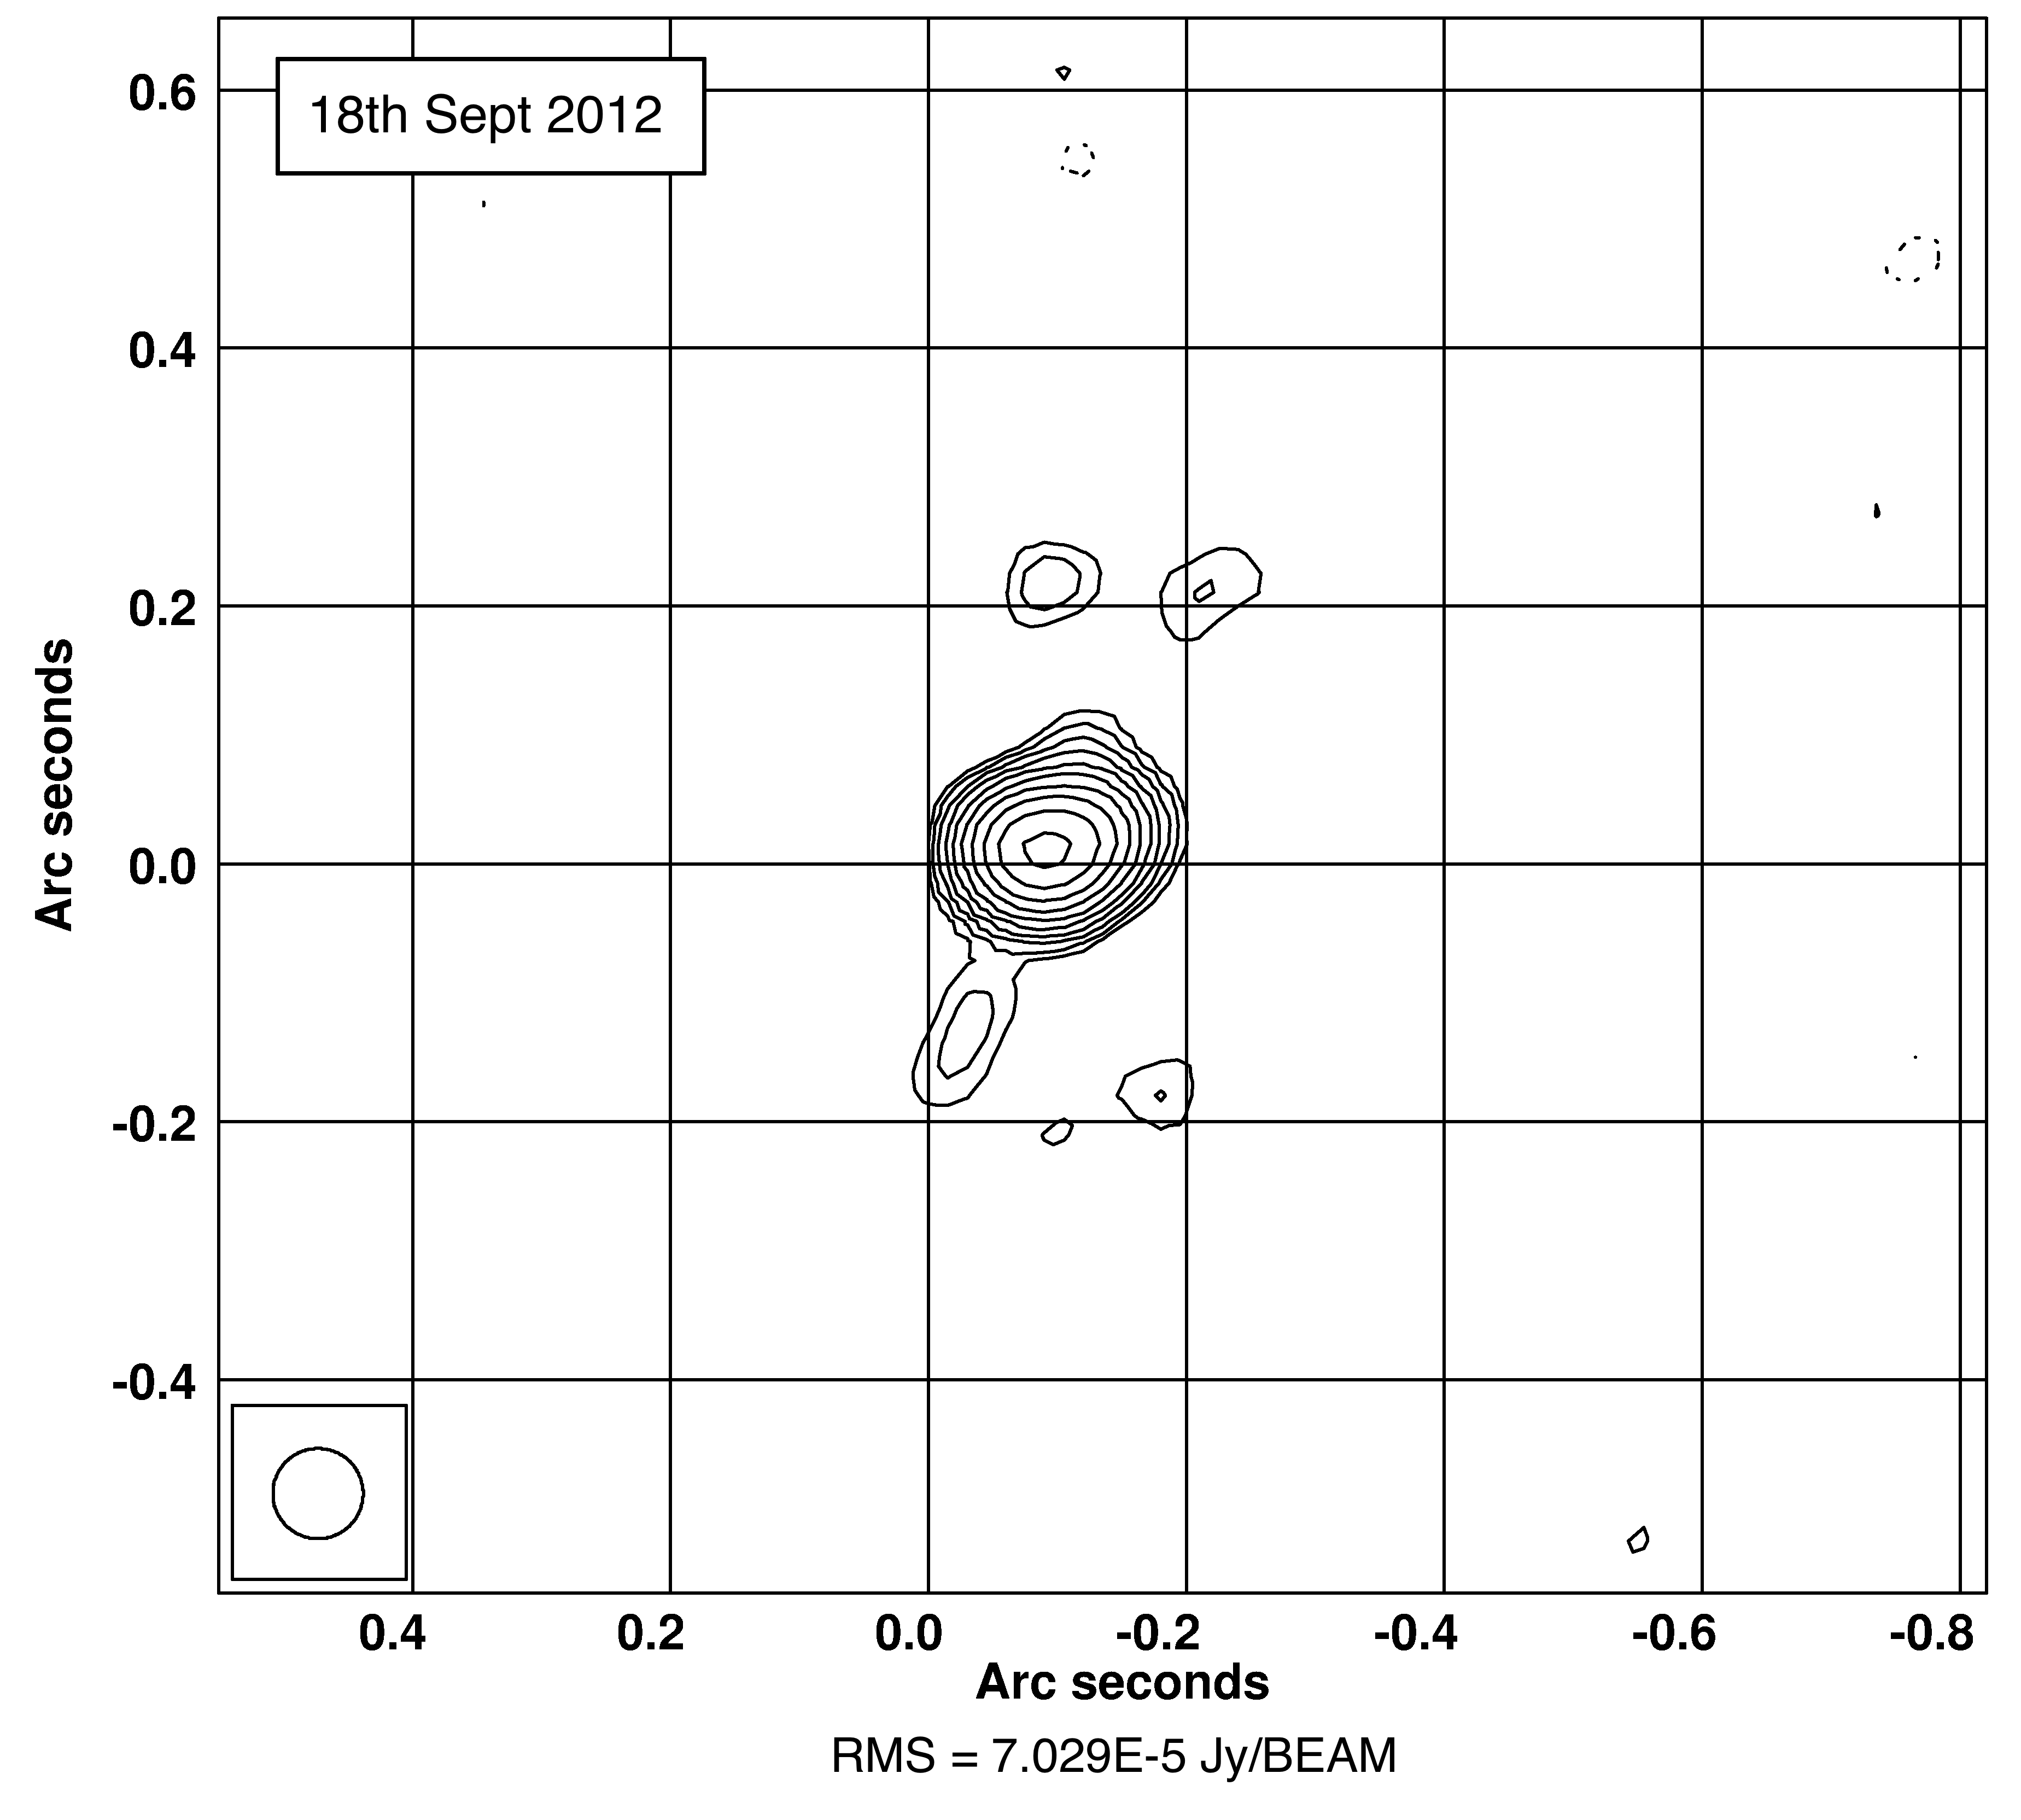
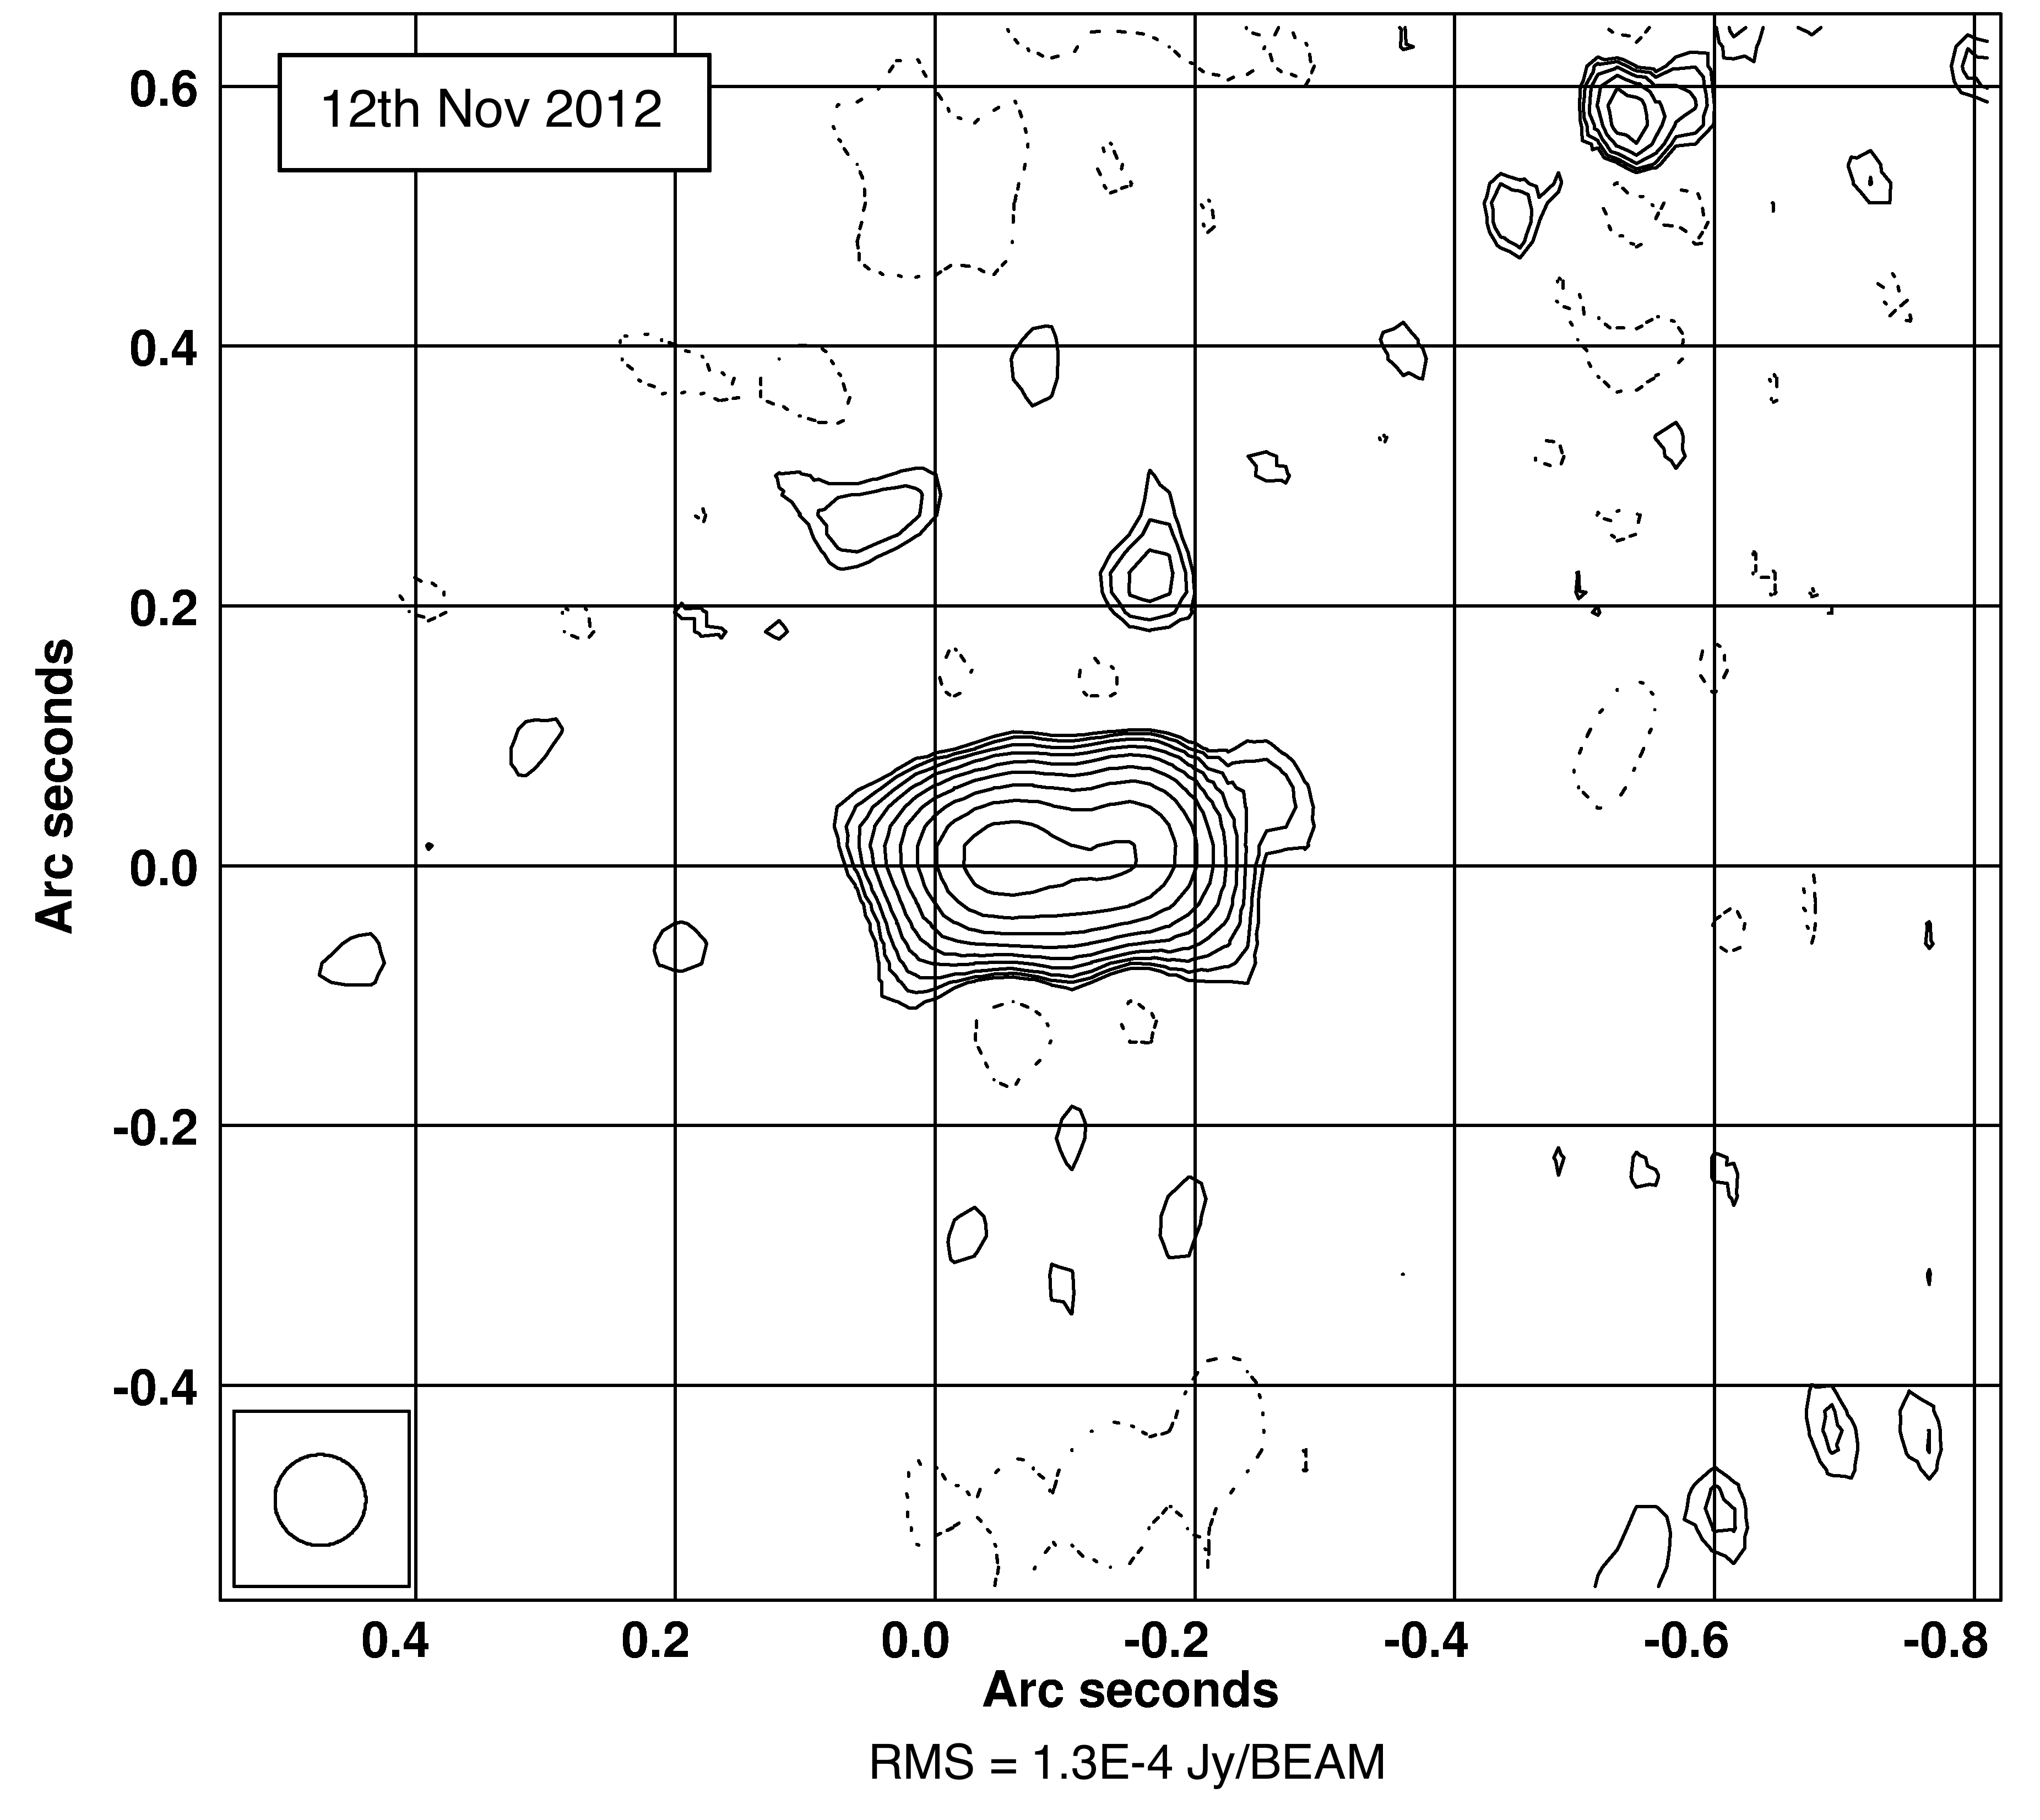
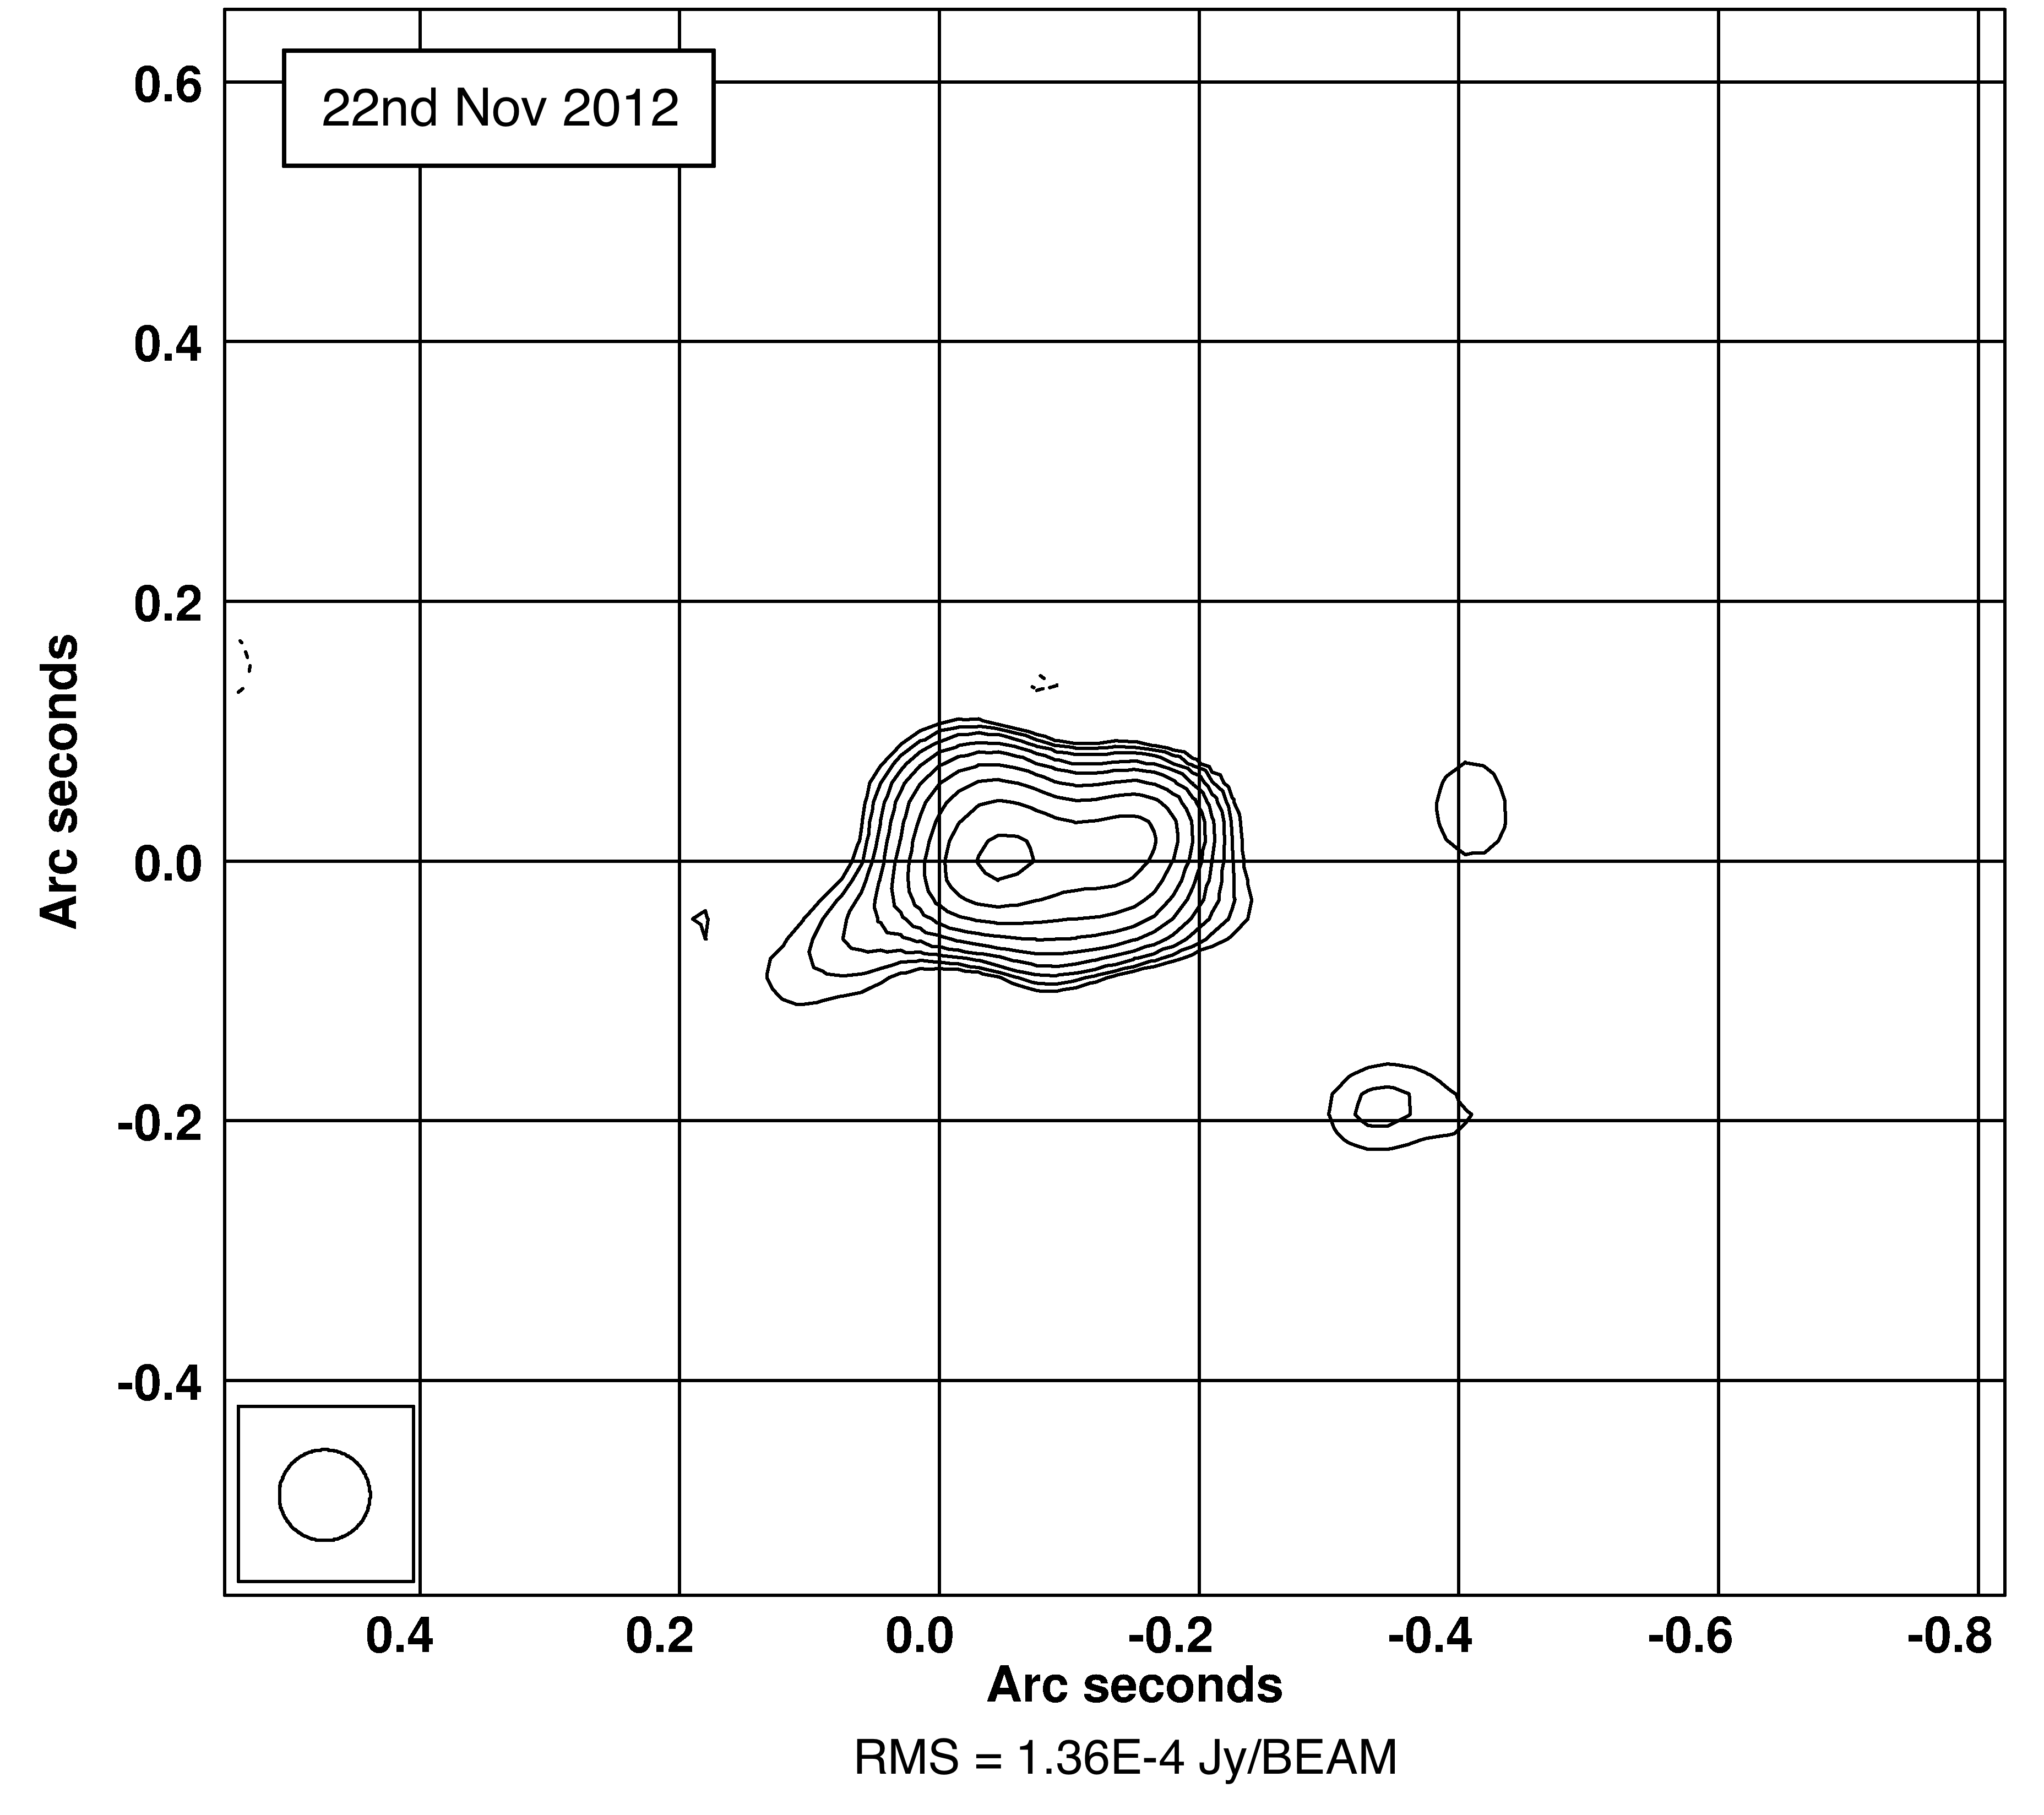
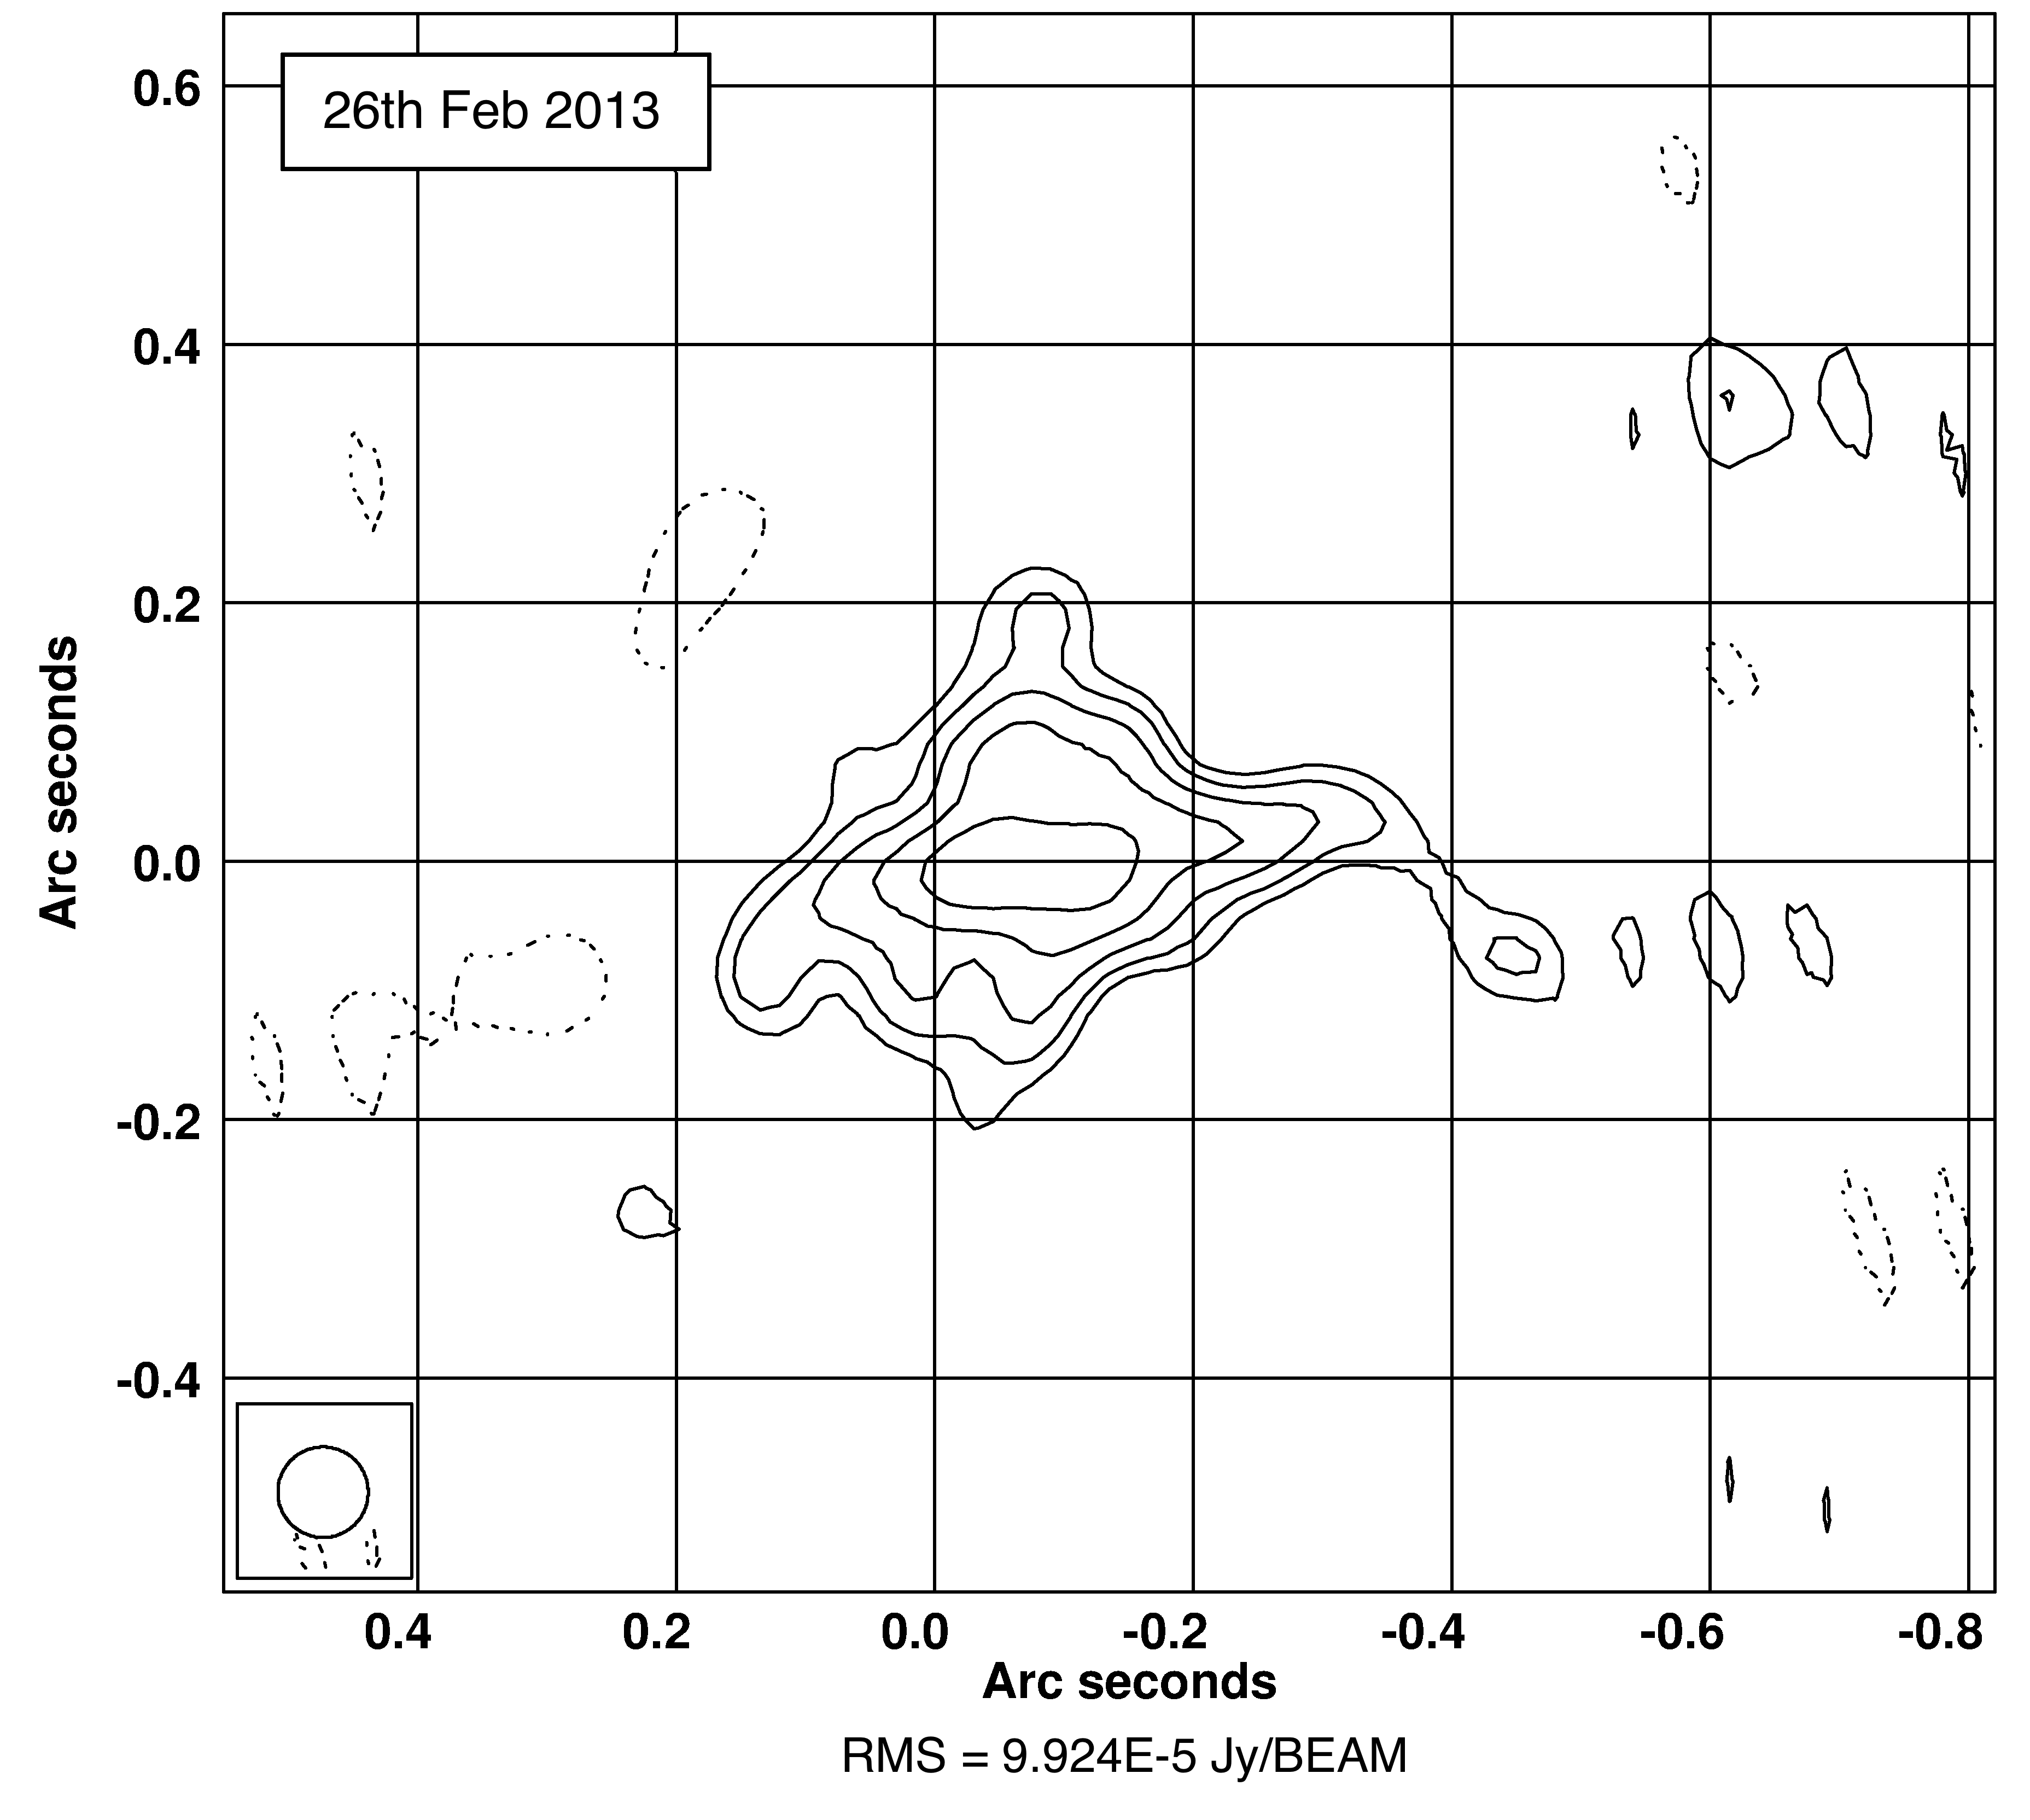
Images of V959 Mon from each epoch are presented in Figure 1. Table 2 shows the total integrated flux for each epoch. Fluxes were calculated using two different methods; using the AIPS tasks JMFIT and IMSTAT. JMFIT fits an elliptical Gaussian to the source, and integrates it to find the flux contained inside it. IMSTAT calculates the total flux contained within the image. The average of the two results was taken, and the uncertainty was taken to be the difference between them. At C-Band, e-MERLIN has a theoretical sensitivity of 7 - 15 Jy, assuming 12 hours on source and all antennas in use. However, for some of the epochs presented here the source was observed for less than 12 hours (see Table 1), and the Lovell telescope was only in use for the February 2013 epoch. Furthermore, at every epoch some data was lost due to flagging of radio frequency interference (RFI), decreasing the sensitivity. The achieved sensitivities are shown in Figure 1.
| Epoch |
|
|
||||
|---|---|---|---|---|---|---|
| 18th Sept 2012 | 90 | 5 1 | ||||
| 12th Nov 2012 | 150 | 19 1 | ||||
| 22nd Nov 2012 | 159 | 27 1 | ||||
| 26th Feb 2013 | 254 | 18 1 | ||||
| 11th Oct 2013 | 482 | 8 1 | ||||
| 21st Feb 2014 | 615 | 4 1 |
| Epoch | Total Flux (Jy) | Error (Jy) |
|---|---|---|
| 18th Sept 2012 | 0.316 | 0.001 |
| 12th Nov 2012 | 0.295 | 0.001 |
| 22nd Nov 2012 | 0.184 | 0.001 |
| 26th Feb 2013 | 0.147 | 0.001 |
| 11th Oct 2013 | 0.245 | 0.002 |
| 21st Feb 2014 | 0.209 | 0.001 |
It was noted during the data reduction process that the flux of the phase calibrator source (0645+0541) varied from epoch to epoch, as outlined in Table 3. The variations in flux were considered too great to be caused by source variability (for example, its flux changed by 0.11 Jy in the 10-day period between 12th November 2012 and 22nd November 2012), meaning the variation was probably caused by an instrumentation or calibration issue; for example the hour angle of the flux calibrator source was different at every epoch, which may have caused the flux calibrations to vary from epoch to epoch. The flux of 0645+0541 was reported by Chomiuk et al. (2014) to be 0.175 Jy, As such, all phase calibrator fluxes were corrected to the flux of the observations made on 22nd November 2012, which was closest to 0.175 Jy. The fluxes of V959 Mon were then multiplied by the corrective factor used to normalize the phase calibrator fluxes. Table 2 shows the corrected values.
 |
 |
 |
 |
 |
 |
The data in Table 2 were used to construct light curves for V959 Mon, shown in Figure 2. While all the observations were made in the C-band, two different central frequencies were used; 5.7 GHz for the 2012 observations and 5.0 GHz for the post-2012 observations. As such, two separate light curves were plotted. These light curves are in broad agreement with the VLA light curve constructed by Chomiuk et al. (2014), as shown in Figure 2.
Also shown in Figure 2 is a comparison between the light curve of V959 Mon as observed by e-MERLIN, and a simulated light curve fit to the data using the Hubble flow model. Using the best fit parameters to the VLA light curves as reported by Chomiuk et al. (2014), the model fitting program was given initial guesses of for the ejecta mass, km s-1 for the outer velocity of the shell and km s-1 for the inner velocity of the shell (recall that the Hubble flow model assumes an expanding spherical shell of ejecta). The distance to the nova (1.5 kpc, Munari et al., 2013b) and the electron temperature of the ejecta ( K, Chomiuk et al., 2014) were fixed. The fit returned best fit parameters of for the ejecta mass, 2280 km s-1 for the velocity of the outer edge of the shell and 490 km s-1 for the inner velocity.
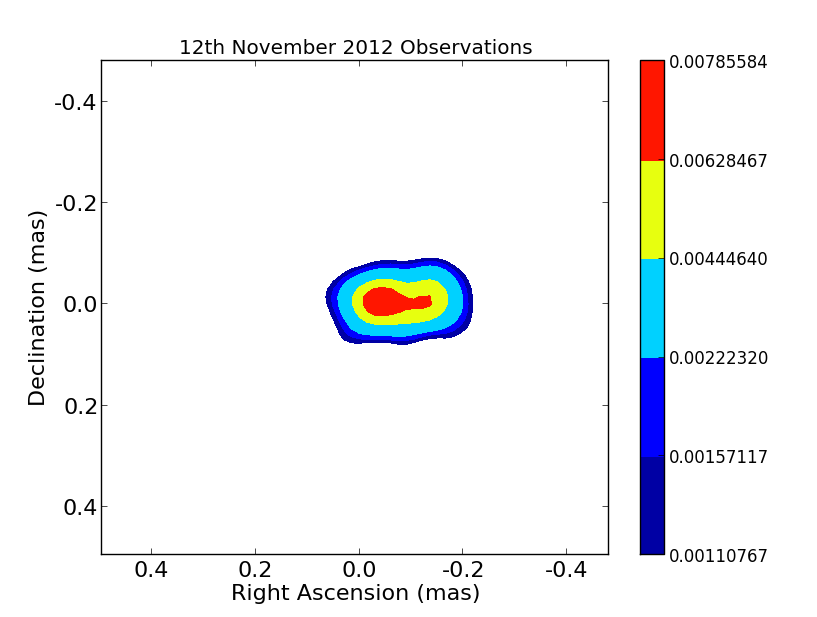
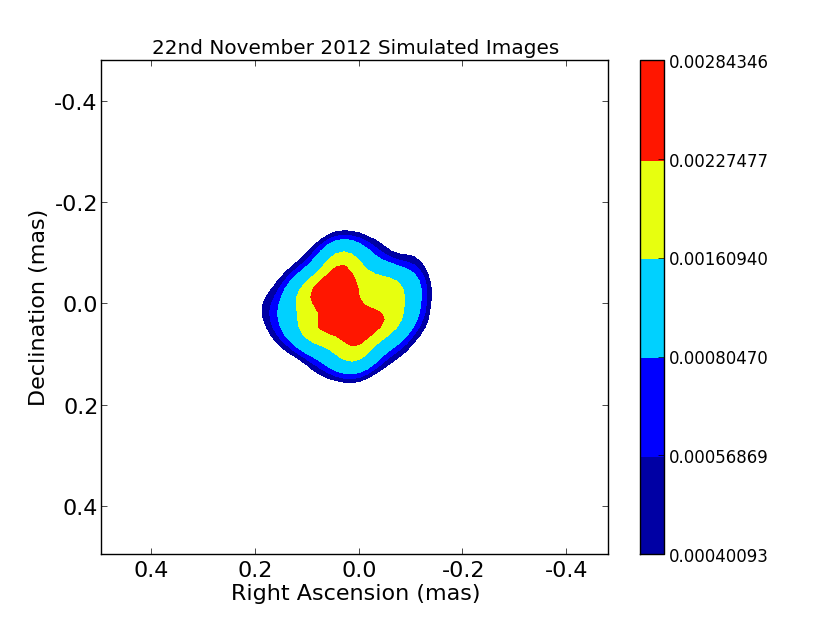
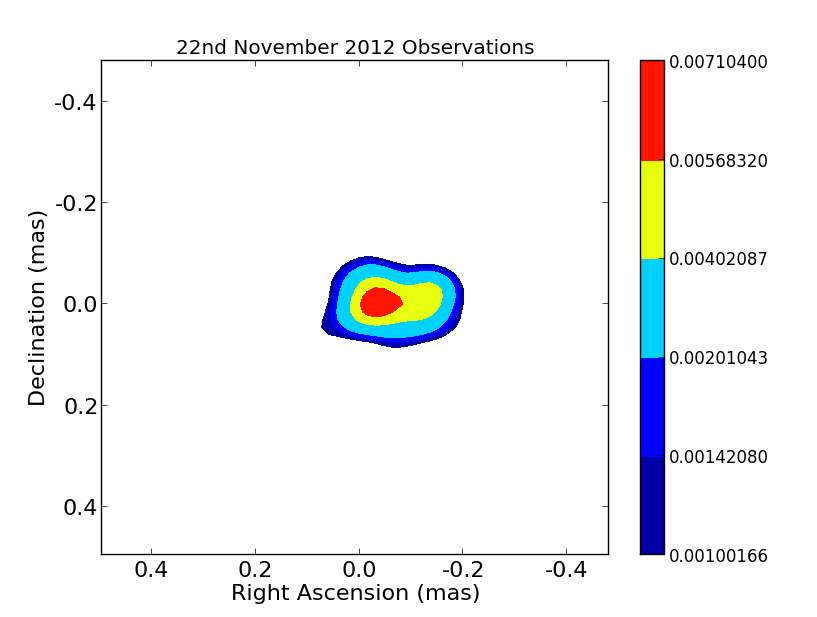
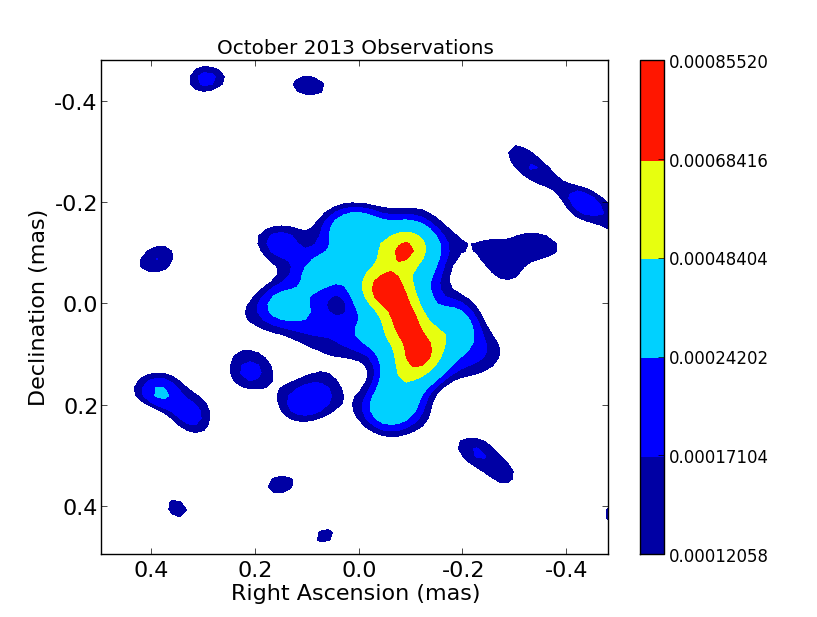
In the first four epochs (see Figure 1), the ejecta appear to be elongated in the east-west direction. The elongation appears to become more pronounced with each successive epoch.
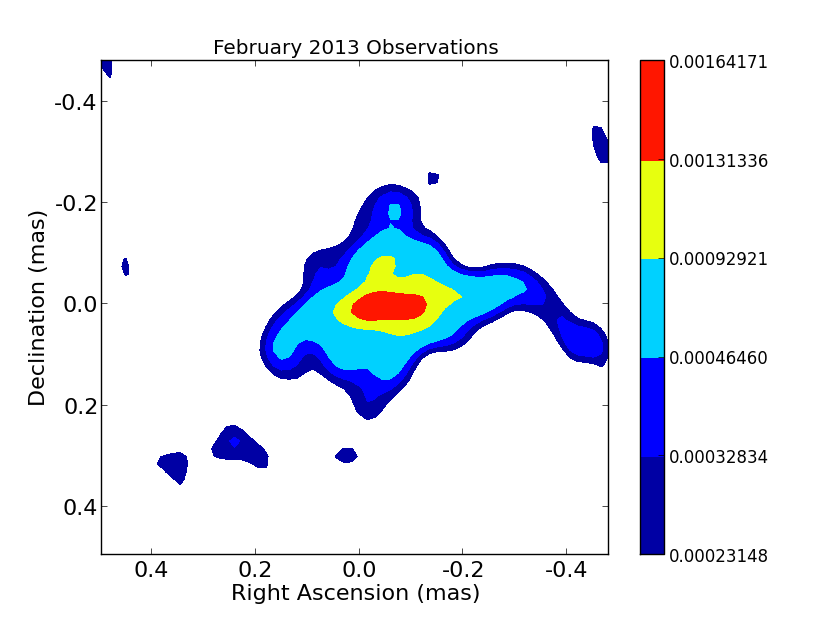
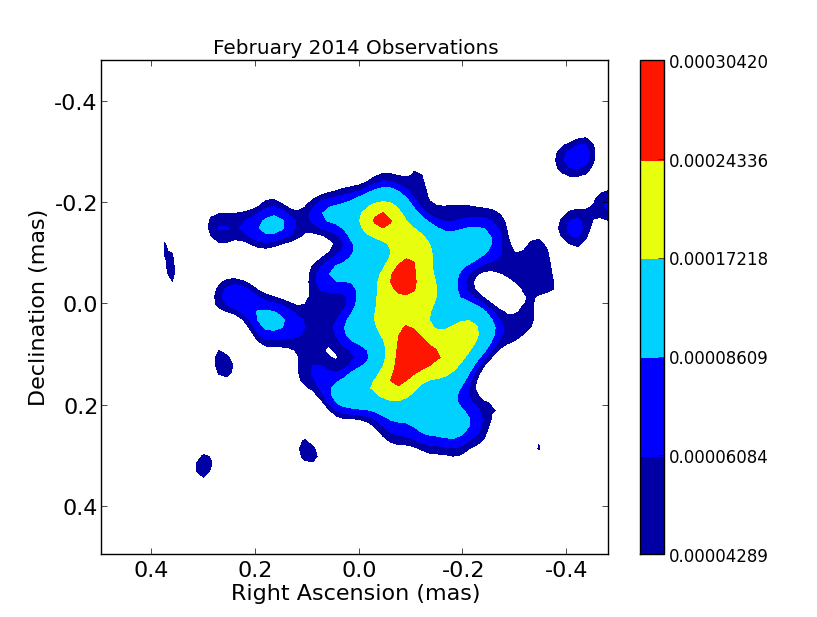
In the subsequent epochs (October 2013 and February 2014), the emission is elongated north-south rather than east-west. It is possible that this north-south structure can be seen to be emerging in the February 2013 epoch, which, though predominately elongated from east to west, also appears to have a north-south component (see Figure 1).
In order to further our understanding of V959 Mon’s expanding morphology, plots were made of radius against time for both the east-west component and the north south component. The angular radius of the ejecta at each epoch was measured from the images shown in Figure 1, using the 4- contours, and using the difference between the 3- and 5- contours as the uncertainty (since 3- was considered to be the lowest believable contour, it was taken as the lower limit for the uncertainty in the radius measurement). For each image, the radii were measured along the line containing the peak flux. For the first three epochs, the radii were measured from east to west (where the ejecta was most extended), and for the final two, the radii were measured from north to south. For the fourth epoch (February 2013), the radius was measured both in the north-south direction and in the east-west direction, as evidence of both components could be seen in the image. In both cases, a radius of zero was assumed at the beginning of the outburst. The measured radii are shown in Tables 4 and 5.
The plots of radius vs time are shown in Figures 3 and 4. For both the east-west and north-south phase, two lines were fit to the data; , assuming a constant velocity equal to , and , assuming a constant acceleration equal to , with an initial velocity of . For the east-west component of ejecta, the constant-velocity fit returned a value of km s-1 for the velocity, and the constant-acceleration fit returned values of km s-2 and km s-1 for the acceleration and initial velocity of the ejecta. Since the uncertainty on the acceleration was so high, we conclude that the constant velocity fit provides a more realistic description of the dynamics of the east-west component.
| Epoch |
|
|
|||||
|---|---|---|---|---|---|---|---|
| 18th Sept 2012 | 91 | 95 4 | |||||
| 12th Nov 2012 | 146 | 156 5 | |||||
| 22nd Nov 2012 | 156 | 144 6 | |||||
| 26th Feb 2013 | 252 | 198 35 |
| Epoch |
|
|
|||||
|---|---|---|---|---|---|---|---|
| 26th Feb 2013 | 252 | 139 35 | |||||
| 11th Oct 2013 | 479 | 184 16 | |||||
| 21st Feb 2014 | 612 | 187 20 |
For the north-south component, a value of km s-1 was returned by the constant-velocity fit, and values of km s-2 (indicating a deceleration) and km s-1 were returned by the constant-acceleration fit. In this instance, assuming a constant acceleration appeared to be a better model (see Figure 4). Comparing the average expansion velocities of the east-west and north-south components (i.e. the constant velocity fits to the radius vs time plots), we find that on average the east-west component had a significantly faster expansion (by about 1700 km s-1).
4 Discussion
Using images of the ejecta morphology observed in V959 Mon by e-MERLIN, we have attempted to learn more about the behaviour of this complex object. Our method of estimating the expansion velocity differs from that of Linford et al. (2015), who made their estimation by fitting SHAPE models to the observed ejecta. However, our estimation of the velocity of the north-south component lies within the error bars of Linford et al. (2015), who estimate that the maximum velocity of the north-south component is 1200 km/s.
We note here, however, that if the ejecta were expanding according to the Hubble flow model, an apparent decrease in expansion velocity from epoch to epoch may also be measured. This is because (as noted in Linford et al., 2015) as the shell expands outwards, it becomes optically thin, first at the outer edges and gradually all the way through. As a result, the effective photosphere, which had been propagating outwards from the WD, would move back towards it. If expansion velocities were being measured from the size of the observed ejecta, a decrease in velocity could be observed at this time. It is possible that this might contribute to our observation of a decelerating outflow in the N-S direction.
MERLIN observations by Heywood et al. (2005) of V723 Cas showed similar developments in the ejecta morphology to what we have observed here; a seeming north-south elongation which then gave way to an east-west structure. However, simulations of the effect of MERLIN UV coverage on a simulated spherically symmetric density distribution by Heywood and O’Brien (2007) showed spurious aspherical features which were strikingly similar to the MERLIN observations of V723 Cas. They concluded was that it is necessary to be very careful when analysing resolved MERLIN images of nova ejecta, as seemingly complex aspherical ejecta could simply be the result of instrumental effects. V959 Mon is close to equatorial with a declination of around 6.5∘ and imaging can be affected by the e-w bias of the array resulting in the beam having significant n-s structure and enhanced sidelobes.
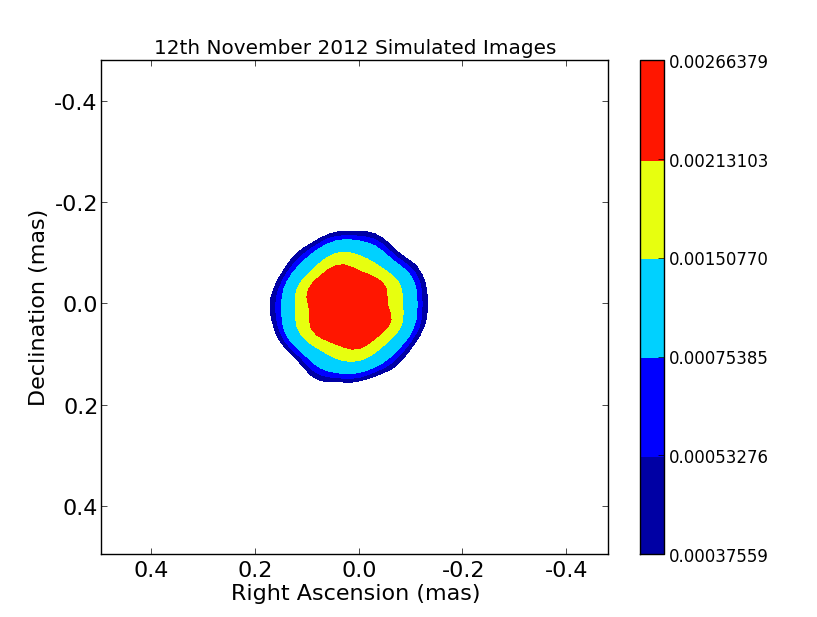
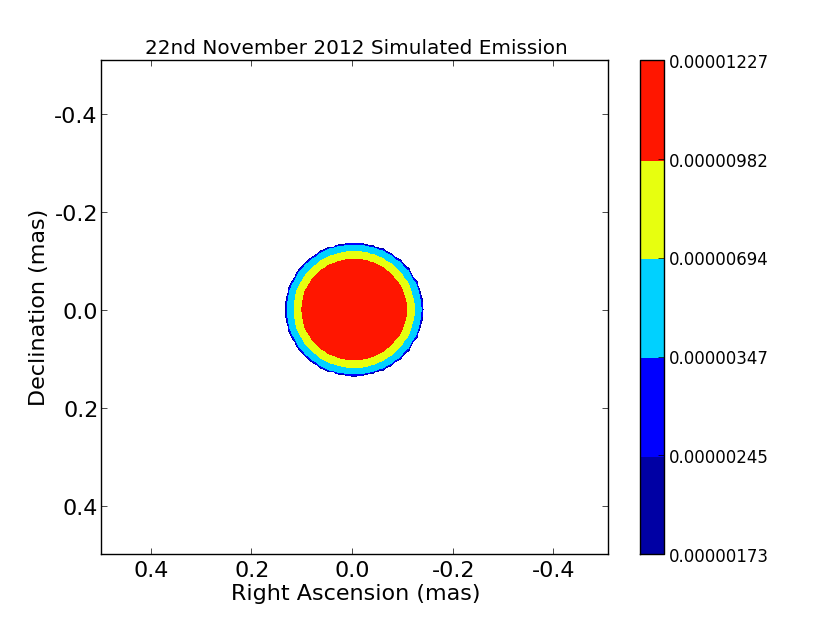
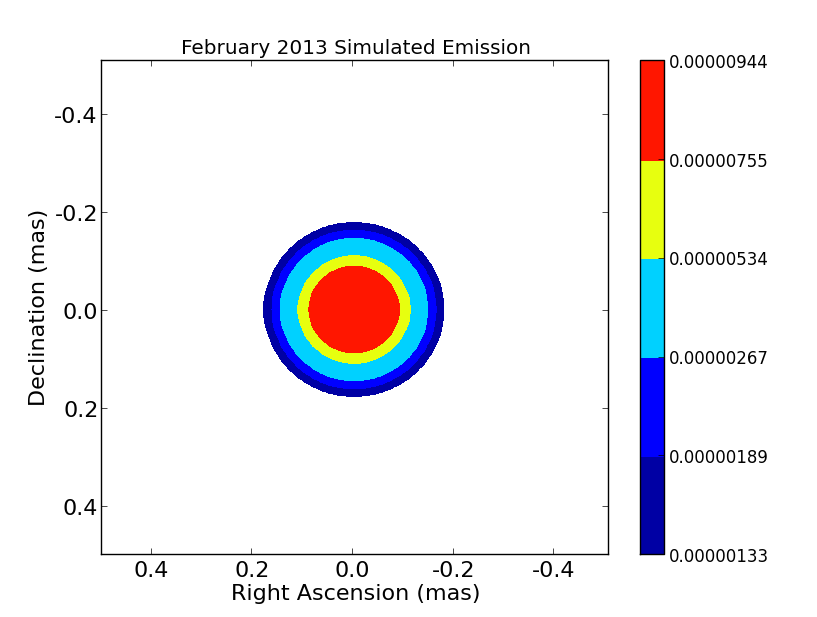
The improved UV coverage of e-MERLIN with its much higher bandwidth with respect to MERLIN may have helped mitigate these effects, nonetheless when analysing V959 Mon’s morphology, it was necessary to explore the possibility that the variable bipolar distortions we observed in V959 Mon were spurious features resulting from the e-MERLIN UV coverage. Several steps were taken to determine whether or not this was the case. First, a spherically symmetric density distribution was calculated using the best fit parameters from the Hubble flow fit to the e-MERLIN lightcurve of V959 Mon (as described in the Results section), for each of the epochs at which V959 Mon was observed. The ejecta were given a mass of , as predicted by the model fit. The outer and inner radii of the spherical shell were determined at each epoch by multiplying the velocities returned by the model fit to the light curve (2280 and 490 km s-1 respectively) by the amount of time that had elapsed between the Fermi discovery and the epoch in question. The ejecta were given a density distribution that varied with the square of the radial difference from the white dwarf surface, via (see Hjellming, 1990): , where M is the mass of the spherical shell, is its outer radius, is its inner radius and r is the radial distance from the WD surface.
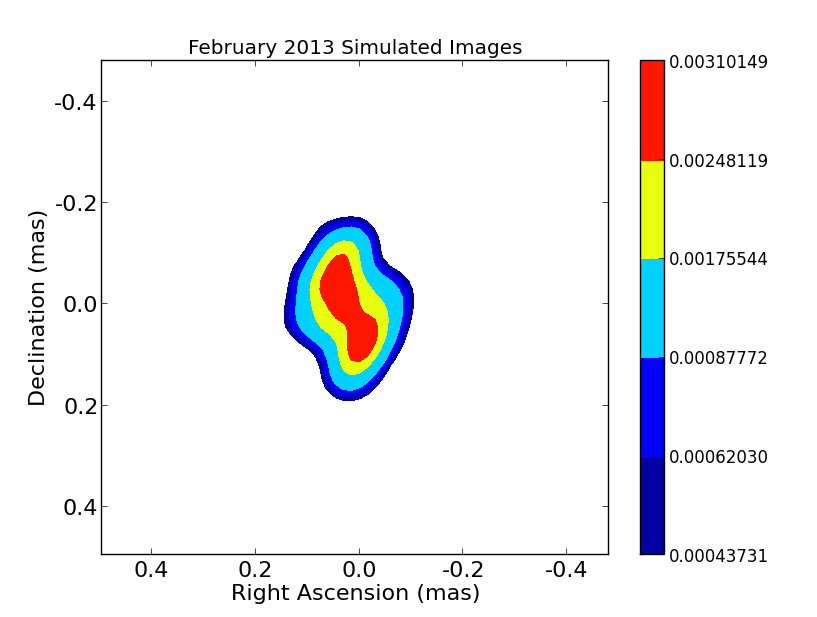
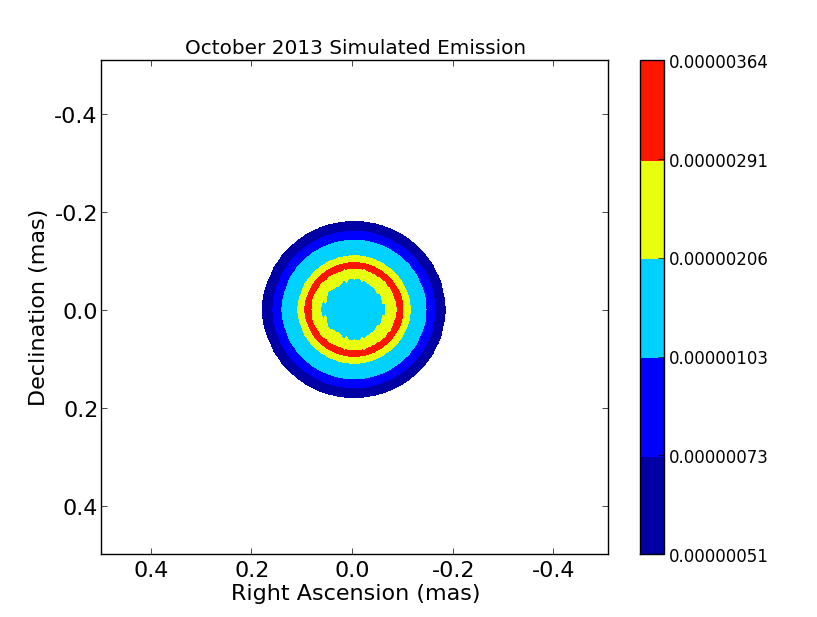
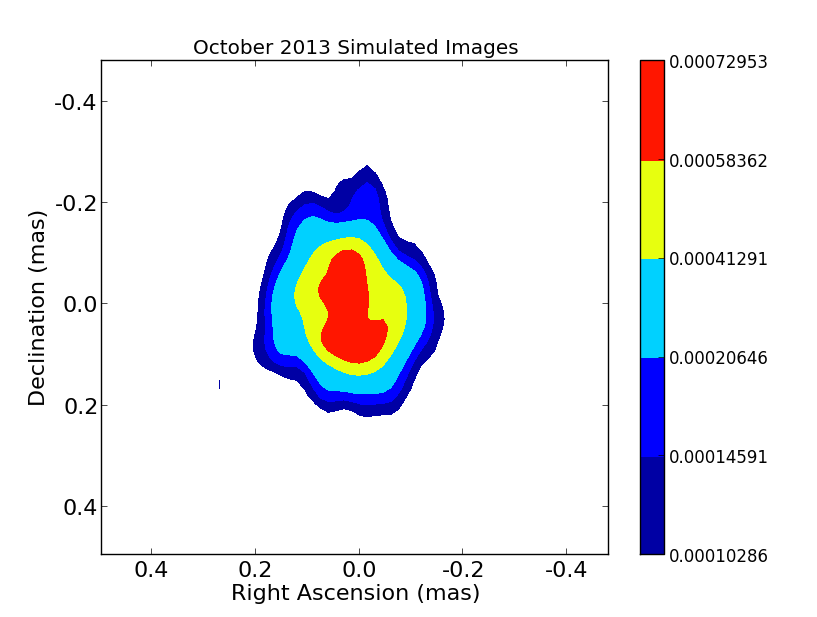
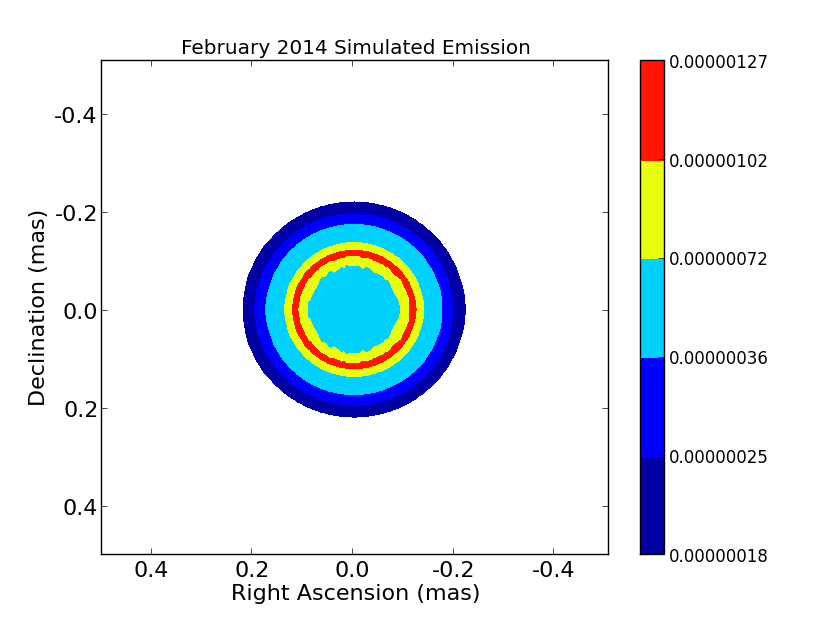
Radio emission was simulated from these density distributions by integrating the equations of radiative transfer along the line of sight through the ejecta (see Heywood and O’Brien, 2007). The simulated emission was then sampled by a reconstruction of the e-MERLIN UV coverage on the dates of the observations presented in this paper (using a method adapted from Heywood, Avison & Williams, 2011), and images of the simulated ejecta were made.
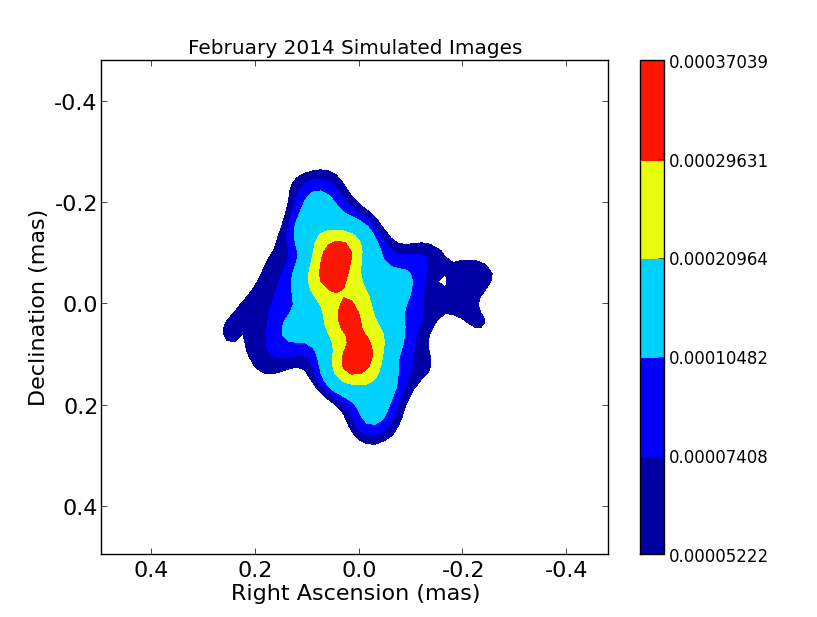
Figure 5 shows the simulated spherical radio emission (on the left) and the e-MERLIN images of the simulated emission (in the middle), alongside the corresponding e-MERLIN observations of V959 Mon (on the right). For the first four epochs (September 2012, 12th November 2012 and 22nd November 2012 and February 2013), extension from east to west can be seen in the observations of V959 Mon that is not present in the images of the simulated spherical emission, suggesting that the observed east-west extension is real and not just a consequence of limited UV coverage. However, the simulated image of the spherical shell (by this time appearing as a ring in the image) at the February 2013 epoch has a pronounced north-south distortion. This means that we can be less confident that the north-south feature observed in February 2013 is a true representation of the source structure. This distortion continues in the October 2013 and February 2014 simulations.
It should of course be noted that Chomiuk et al. (2014) and Linford et al. (2015) also detected a change from east-west to north-south in the orientation of V959 Mon’s ejecta, using multi-frequency VLA observations spanning 4.5 to 36.5 GHz. This would support interpreting the observed north-south extension in the e-MERLIN imaging as real. Furthermore, the extent of the n-s emission in the simulated observations (middle column of Figure 5) can be seen to be related to the diameter of the ring in the model images (left column) suggesting that measurements made from the observed images can still provide information on the size of the source even in a case where the detailed structure might be difficult to determine.
 |
 |
|
 |
 |
 |
 |
 |
 |
 |
 |
 |
 |
 |
 |
 |
 |
 |
5 Conclusion
High resolution e-MERLIN observations have been presented here of V959 Mon (Nova Mon 2012) at six epochs ranging from September 2012 to February 2014. The observations were made at C-band (5 GHz) frequency. Resolved images of Nova Mon 2012 show a complex, aspherical, evolving morphology, which appears to change its orientation from an east-west elongation to a north-south elongation. The e-MERLIN light curve at C-band is in good agreement with VLA observations of Nova Mon 2012 at higher and lower frequencies.
The variable morphology of Nova Mon 2012 as observed with e-MERLIN and presented here is consistent with the observations of Chomiuk et al. (2014) and Linford et al. (2015). The e-MERLIN observations presented here also cover the period between days 199 and 615 post-Fermi-discovery, during which the ejecta changes from being elongated east-west to north-south. The high resolution of the e-MERLIN images presented here allowed us to directly measure the angular radius of V959 Mon’s ejecta at each epoch, and estimate expansion velocities (and accelerations) for the east-west and north-south components of V959 Mon’s ejecta. Our measurements of the expansion velocities of these two components indicate that they display different dynamics, and hence are likely driven by different mechanisms.
However, the change in orientation from east-west to north-south that we observed in V959 Mon’s ejecta bore some similarity to MERLIN observations by Heywood et al. (2005) of V723 Cas, in which a change in ejecta orientation was also observed. A follow-up analysis by Heywood and O’Brien (2007) found that the complex structure seen in the ejecta of that source could be reproduced by applying MERLIN UV coverage to a spherically symmetric emission model, indicating that the unusual features seen in the observations were not real.
To investigate whether or not the complex morphology we have observed in V959 Mon can be believed, we have simulated spherical emission at times corresponding to the six epochs of e-MERLIN observations presented here. We have constructed images of this simulated emission by sampling it with reconstructions of the e-MERLIN UV coverage on the dates when the observations presented here were made. The simulated images do not have any significant east-west elongation but do feature a north-south distortion at the February 2013, October 2013 and February 2014 epochs. As such, we conclude that the observed east-west elongation is indicative of the actual source structure whilst we can be less certain of the north-south elongation. Although we note that Chomiuk et al. (2014) and Linford et al. (2015) do also observe a north-south elongation in VLA imaging.
To further our understanding of V959 Mon’s unusual behaviour, it will be of use to testthe model proposed by Chomiuk et al. (2014) using radio emission models of aspherical ejecta. By constructing density distributions representative of the ejecta behaviour proposed by Chomiuk et al. (2014), we can investigate whether or not such behaviour could result in the radio emission we have observed, using plausible values for parameters such as ejecta mass and velocity. We will present the findings of this study in a following paper.
6 Acknowledgments
e-MERLIN is a National Facility operated by the University of Manchester at Jodrell Bank Observatory on behalf of the UK Science and Technology Facilities Council (STFC).
FH acknowledges the support of an STFC-funded studentship.
We thank the anonymous referee for their useful and insightful comments.
References
- Bode & Evans (2008) Bode, M. F., & Evans, A. (Eds.), Classical novae, Vol. 43. Cambridge University Press, 2008.
- Cheung et al. (2012a) Cheung, C.C. et al., 2012, The Astronomer’s Telegram, 4224
- Cheung et al. (2012b) Cheung, C.C. et al., 2012, The Astronomer’s Telegram, 4310
- Chomiuk et al. (2014) Chomiuk, L., et al., 2014, Nature, 514(7522), 339-342
- Fermi LAT Collaboration (2014) Fermi-LAT Collaboration, 2014, Science, 345(6196), 554-558.
- Fujikawa et al. (2012) Fujikawa, S., Yamaoka, H., Nakano, S, 2012, Central Bureau Electronic Telegrams, 3202
- Eyres et al. (2000) Eyres, S. P. S., Bode, M. F., O’Brien, T. J., Watson, S. K., & Davis, R. J., 2000, Monthly Notices of the Royal Astronomical Society, 318(4), 1086-1092
- Heywood et al. (2005) Heywood, I., O’Brien, T. J., Eyres, S. P. S., Bode, M. F., & Davis, R. J., 2005, V723 Cas, Monthly Notices of the Royal Astronomical Society, 362(2), 469-474.
- Heywood and O’Brien (2007) Heywood, I., and T. J. O’Brien, 2007, Monthly Notices of the Royal Astronomical Society, 379.4: 1453-1463
- Heywood, Avison & Williams (2011) Heywood, I., A. Avison, and C. J. Williams, 2011, arXiv preprint arXiv:1106.3516
- Hjellming et al. (1979) Hjellming, R. M., Wade, C. M., Vandenberg, N. R., & Newell, R. T., 1979, The Astronomical Journal, 84, 1619-1631.
- Hjellming (1990) Hjellming, R. A., 1990, The Physics of Classical Novae, ed. A. Cassatella, & R. Viotti. Berlin: Springer, p. 169.
- Krauss et al. (2011) Krauss, M. I., et al., The Astrophysical Journal Letters 739.1 (2011): L6.
- Linford et al. (2015) Linford, J. D., et al.,The Astrophysical Journal 805.2 (2015): 136.
- Munari et al. (2013a) Munari, U., et al., 2013, The Astronomer’s Telegram 5500
- Munari et al. (2013b) Munari, U., Dallaporta, S., Castellani, F., Valisa, P., Frigo, A., Chomiuk, L., & Ribeiro, V. A. R. M., 2013, Monthly Notices of the Royal Astronomical Society, 435: 771-781.
- Nelson et al. (2012) Nelson, T., Mukai, K., Sokoloski, J., Chomiuk, L., Rupen, M., Mioduszewski, A., Page, K. & Osborne, J., 2012, The Astronomer’s Telegram, 4590, 1.
- O’Brien et al. (2012) O’Brien, T. J., et al., 2012, The Astronomer’s Telegram, 4408, 1.
- Osborne, Beardmore & Page (2013) Osborne, J. P., Beardmore, A., & Page, K., 2013, The Astronomer’s Telegram, 4727, 1.
- Page et al. (2013) Page, Kim L., et al., 2013, The Astrophysical Journal Letters 768.2: L26.
- Ribeiro et al. (2013) Ribeiro, V. A. R. M., Munari, U., & Valisa, P. 2013, The Astrophysical Journal, 768(1), 49.
- Ribeiro et al. (2014) Ribeiro, V. A. R. M., L. Chomiuk, U. Munari, W. Steffen, N. Koning, T. J. O’Brien, T. Simon, P. A. Woudt, and M. F. Bode, 2014, The Astrophysical Journal 792, 1:57.
- Schaefer (2010) Schaefer, B. 2010, The Astrophysical Journal Supplement Series, 187, 275
- Seaquist & Palimaka (1977) Seaquist, E. R., & Palimaka, J., 1977, The Astrophysical Journal, 217, 781-787.
- Shafter (1997) Shafter, A. W., 1997, The Astrophysical Journal, 487(1), 226.
- Shore et al. (2013) Shore, S. N., I. De Gennaro Aquino, G. J. Schwarz, T. Augusteijn, C. C. Cheung, F. M. Walter, & S. Starrfield, 2013, Astronomy & Astrophysics 553: A123
- Taylor et al. (1988) Taylor, A. R., Hjellming, R. M., Seaquist, E. R., & Gehrz, R. D., 1988, Nature, 335(6187), 235-238.
- Wagner, Woodward & Starrfield (2013) Wagner, R. M., Woodward, C. E., & Starrfield, S. 2013, The Astronomer’s Telegram, 4737, 1.