Mid-infrared excess from the west hot spot of the radio galaxy Pictor A unveiled by WISE
Abstract
Mid-infrared properties are reported of the west hot spot of the radio galaxy Pictor A with the Wide-field Infrared Survey Explorer (WISE). The mid-infrared counterpart to the hot spot, WISE J051926.26454554.1, is listed in the AllWISE source catalog. The source was detected in all the four WISE photometric bands. A comparison between the WISE and radio images reinforces the physical association of the WISE source to the hot spot. The WISE flux density of the source was carefully evaluated. A close investigation of the multi-wavelength synchrotron spectral energy distribution from the object reveals a mid-infrared excess at the wavelength of m with a statistical significance of over the simple power-law extrapolation from the synchrotron radio spectrum. The excess is reinforced by single and double cutoff power-law modeling of the radio-to-optical spectral energy distribution. The synchrotron cutoff frequency of the main and excess components was evaluated as Hz and Hz, respectively. From the cutoff frequency, the magnetic field of the emission region was constrained as a function of the region size. In order to interpret the excess component, an electron population different from the main one dominating the observed radio spectrum is necessary. The excess emission is proposed to originate in a sub structure within the hot spot, in which the magnetic field is by a factor of a few stronger than that in the minimum energy condition. The relation of the mid-infrared excess to the X-ray emission is briefly discussed.
1 Introduction
Radio galaxies with an FR II morphology (Fanaroff & Riley, 1974) usually host compact bright synchrotron radio structures, called hot spots (e.g., Begelman et al., 1984), at the terminal region of their jets. It is widely believed that the hot spots correspond to a strong shock created by the jet interaction with the ambient intergalactic medium. In the hot spots, particles are accelerated into the relativistic energies via the diffusive shock acceleration, usually called the first-order Fermi process (e.g., Meisenheimer et al., 1989, 1997). Thus, they are considered as a possible production site of high energy cosmic rays (e.g., Hillas, 1984). However, the detailed physical conditions in the hot spots are under debate, and then, observational constraints are indispensable to explore the particle acceleration mechanism in detail.
Previously, a combination of radio and X-ray spectral information has been one of the most valuable probes for the physical properties of the hot spots (e.g., Hardcastle et al., 2004). Within a framework of the one-zone particle acceleration, the hot spots are divided into two classes, based on the possible radiation mechanism for the X-ray photons. The X-ray spectrum from the high-luminosity hot spots is successfully interpreted by the synchrotron-self-Compton (SSC) process under a magnetic field close to the equipartition value. In contrast, the high-frequency tail of the synchrotron emission tends to significantly contribute to the X-ray spectrum of the low-luminosity hot spots. However, in order to derive a more definite conclusion, spectral information in between the radio and X-ray bands are usually very useful.
Mid-infrared observations have a potential to shed light on this issue, by filling this wide frequency gap. A pioneering mid-infrared observation of the FR II radio galaxy Cygnus A with the Spitzer observatory strengthened the SSC scenario for its archetypal high-luminosity hot spots (Stawarz et al., 2007). However, the Spitzer upper limit on the mid-infrared flux of several low-luminosity hot spots seems inconsistent with the simple one-zone synchrotron interpretation for their radio-to-X-ray spectral energy distribution (Werner et al., 2012). Utilizing the mid-infrared data, Kraft et al. (2007) claimed that two independent synchrotron-emitting electron populations are required to reproduce the wide-band spectral energy distribution from the host spots of the radio galaxy 3C 33. The double synchrotron interpretation was invoked for the infrared knots of the jet in the quasar 3C 273 (Uchiyama et al., 2006). The multi-component interpretation was applied to the polarimetric properties observed with the Atacama Large Millimeter Array (ALMA) from kpc-scale structures associated with the hot spot of 3C 445 (Orienti et al., 2017). Thus, the mid-infrared observations have gradually revealed that the acceleration phenomena in the hot spots are actually complicated and heterogeneous rather than the simple one-zone Fermi acceleration.
In order to extend the mid-infrared knowledge on the host spots, the science products from the Wide-field Infrared Survey Explorer (WISE; Wright et al., 2010) are expected to be one of the ideal tools. WISE covers a wide mid-infrared range with the four photometric bands at the wavelengths of (W1), (W2), (W3), and m (W4). Especially, the AllWISE source catalog111Electrically available at http://irsa.ipac.caltech.edu/cgi-bin/Gator/nph-scan?submit=Select&projshort=WISE, which was constructed by a combination of the data obtained in the cryogenic and post-cryogenic (Mainzer et al., 2011) phases, is useful, since it tabulates more than 747 million objects, thanks to its all-sky coverage with a relatively high sensitivity (e.g., Jy at m).
The FR II radio galaxy Pictor A, located at the red shift of (Eracleous & Halpern, 2004), is known to host a distinctive radio hot spot at the edge of its west lobe (e.g., Perley et al., 1997). It is known as a representative of the low-luminosity hot spots (Hardcastle et al., 2004). Thanks to its high radio intensity, the object has been extensively studied not only in the radio band, but also in the near infrared (Meisenheimer et al., 1997), optical (Thomson et al., 1995) and X-ray (e.g., Wilson et al., 2001; Hardcastle et al., 2016) frequencies. The high resolution radio image derived with the Very Long Baseline Array (VLBA) resolved the hot spot into pc-scale sub structures (Tingay et al., 2008). The hot spot is included in the Spitzer hot-spot sample by Werner et al. (2012). However, their result at m seems inconsistent to that of Tingay et al. (2008), in spite of using the same data set.
In the present paper, the mid-infrared properties of the west hot spot of Pictor A are investigated with WISE. The mid-infrared spectrum exhibits a significant excess over the simple extrapolation of its power-law (PL) radio spectrum. The excess strongly requires an additional population of synchrotron electrons.
Referring to the previous study (Tingay et al., 2008), the cosmological constants are assumed to be km s-1 Mpc-1, , and (Spergel et al., 2003). These yield an angle-to-size conversion factor of at the rest frame of Pictor A.
| Band | (m) aaThe isophotal wavelength of the WISE photometric band. | SN bbThe signal-to-noise ratio. | (mag)ccThe source magnitude in the Vega unit. | (mJy) ddThe corresponding flux density. | (mJy) eeThe systematic error of the WISE photometry (Jarrett et al., 2011) | ffThe color correction factor for . | ggThe additional correction factor for red sources (see Wright et al., 2010). |
|---|---|---|---|---|---|---|---|
| W1 | 3.35 | 45.8 | 0.03 | 0.992 | 1 | ||
| W2 | 4.60 | 50.2 | 0.06 | 0.994 | 1 | ||
| W3 | 11.56 | 35.7 | 0.21 | 0.937 | 1 | ||
| W4 | 22.09 | 13.1 | 0.57 | 0.993 | 0.92 |
2 Data Analysis
2.1 WISE Counterpart to the West Hot Spot of Pictor A
From the AllWISE source catalog, a moderately bright source, WISE J051926.26454554.1, was identified as the mid-infrared counterpart to the west hot spot of Pictor A. The WISE properties of the source are listed in Table 1. Among the five photometric measurements in the catalog, the deep detection profile-fit photometry is adopted. The source is detected at all the four WISE photometric bands with a high signal-to-noise ratio (). The flag information in the catalog indicates that the source is point like (), its photometric quality is high (), it probably exhibited no intensity variation during the WISE survey (), and it is not contaminated by known artifacts ().
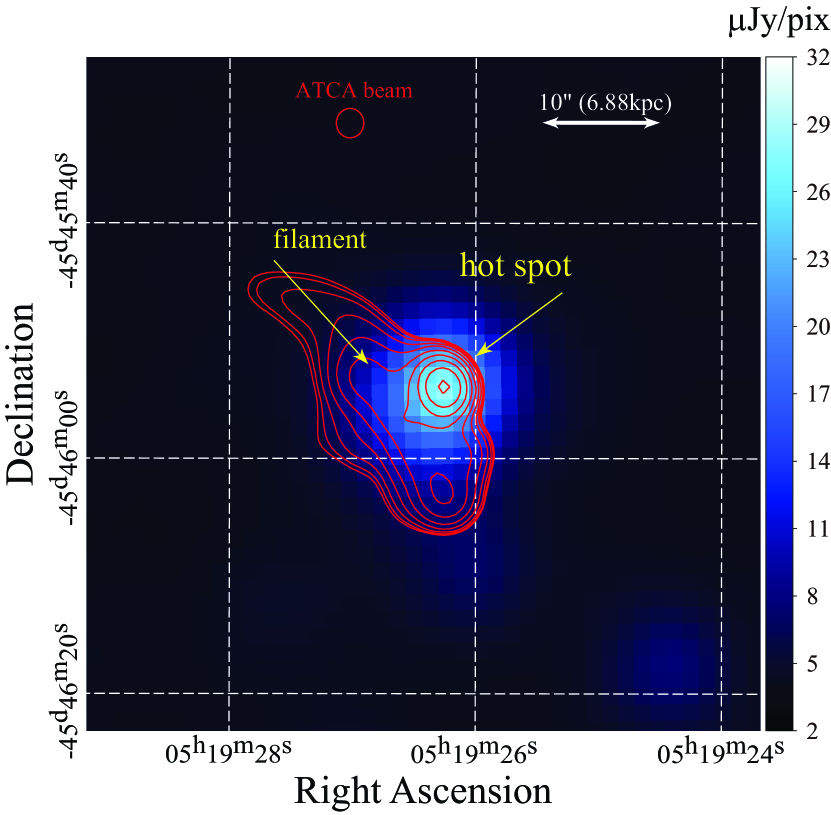
Figure 1 shows the WISE image of WISE J051926.26454554.1 at m. The unpublished 4.8 GHz radio image obtained with the Australia Telescope Compact Array (ATCA) (kindly provided by Dr. Lenc; private communication) is overlaid with contours. The figure supports the physical association of the WISE source to the hot spot, rather than to the radio filament on the southeast (Röser & Meisenheimer, 1987). Considering the source density in this field, the probability of the chance coincidence is low.
The WISE and ATCA coordinates were more precisely registered by analyzing the nucleus of Pictor A. The WISE position of the nucleus is found to agree with its ATCA peak within mas. Since this is smaller than the systematic uncertainty of the WISE astrometry, mas 222See “Explanatory Supplement to the AllWISE Data Release Products”, which is electrically available at http://wise2.ipac.caltech.edu/docs/release/allwise/expsup/index.html, no astrometric correction was performed. Then, the offset of the WISE position of the hot spot to its ATCA one was evaluated as at most mas toward the southeast, i.e., the direction to the jet. The X-ray position of the hot spot was reported to be shifted by from the radio peak (Hardcastle et al., 2016), in a similar direction.
2.2 Mid-infrared Spectrum
By referring to Wright et al. (2010), the flux density of the west hot spot at the frequency of the WISE photometric band, is evaluated as
| (1) |
where is the light speed, is the WISE magnitude, is the zero-magnitude flux density for a PL-like spectrum with the energy index of (), is the color-correction factor, and is the additional color-correction factor for a red source () only applied to the m flux density. Based on the observed WISE color (e.g., ), the color correction for was applied. The Galactic extinction correction was negligible, because it is estimated to be less than % even at m from the B-band extinction of (Schlegel et al., 1985) and the standard extinction law (Rieke & Lebofsky, 1985). The flux density of the source is summarized in Table 1, together with the adopted and values. The systematic uncertainty in the WISE flux density, , was based on Jarrett et al. (2011).
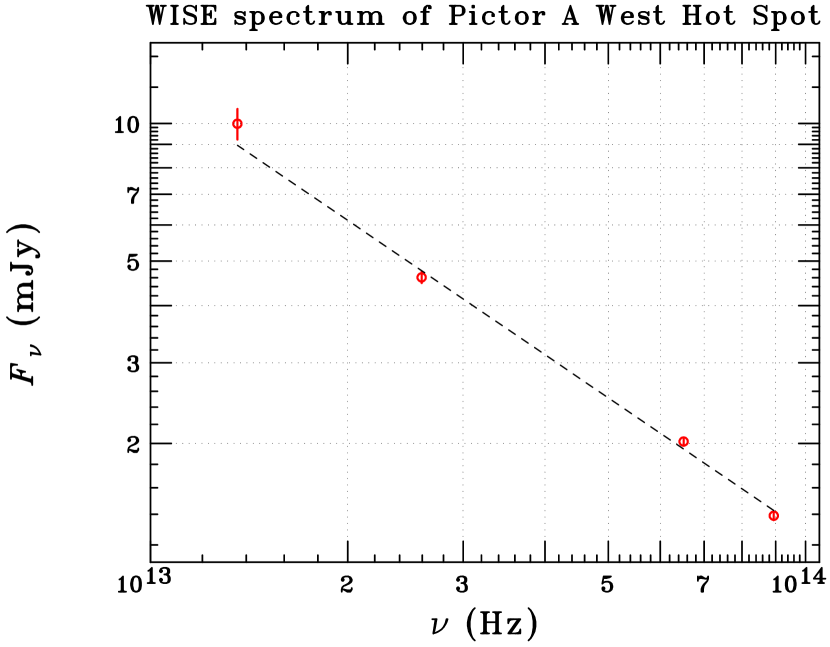
Figure 2 displays the WISE spectrum of the west hot spot in – Hz (i.e., – m). The spectrum exhibits no break nor cutoff in the WISE range. It is successfully approximated by a PL model (the dashed line in Figure 2), and its index, , becomes self-consistent to the observed WISE color, adopted for the color correction.
。
2.3 Spectral Energy Distribution
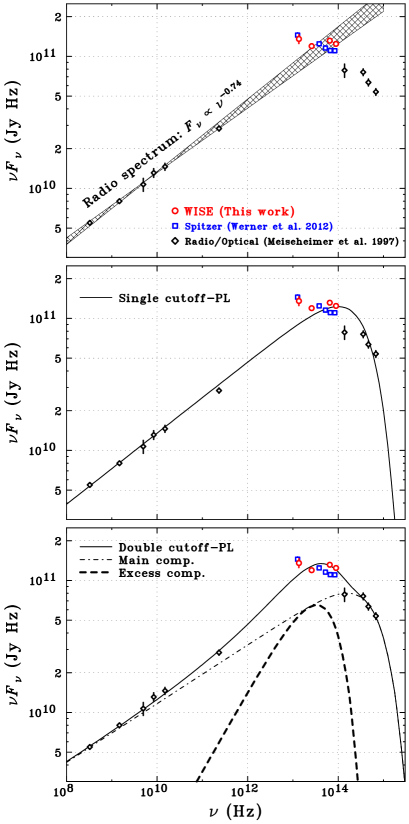
The spectral energy distribution of the hot spot from the radio to optical frequencies is compiled in Figure 3. The WISE data are displayed with the circles. The published data measured with Spitzer are also plotted with the boxes. Tingay et al. (2008) and Werner et al. (2012) independently reported the results from the same Spitzer observation. Their photometric measurements coincide with each other in the – m range within %, while their results differ at m by %, possibly due to the difference in their photometric aperture. In the present paper, the Spitzer spectrum by Werner et al. (2012) is utilized, because their m flux is in good agreement to the m WISE flux, as is seen from Figure 3. The radio, near-infrared, and optical data, indicated by the diamonds, are take from Meisenheimer et al. (1997).
The object exhibits a straight PL radio spectrum over nearly 3 orders of magnitude in the MHz– GHz range. The best-fit flux density at 5 GHz and energy index were respectively evaluated as Jy and (Meisenheimer et al., 1997). As shown with the hatched tie in the top panel of Figure 3, its simple extrapolation to the higher frequencies intersects the mid-infrared spectrum in the WISE/Spitzer frequency range around Hz (i.e., m). The near-infrared to optical spectrum in the range of Hz is steeper than the mid-infrared one, indicating a spectral cutoff.
It is important to note that the object shows a PL mid-infrared spectrum with even at the lower frequency range ( Hz). Thus, the m WISE flux density exceeds the extrapolation of the radio spectrum by mJy. The significance of this excess is evaluated as . Even if the systematic uncertainty of the WISE photometry (i.e., mJy at m) is taken into account, the excess remains meaningful (). The result is fully supported by the m Spitzer data.
| Component | Parameter | Single cutoff PL model | Double cutoff PL model |
|---|---|---|---|
| Main | (5 GHz) (Jy) aaThe radio flux density at 5 GHz. | ||
| bbThe energy index. | |||
| (Hz) ccThe cut-off frequency. | |||
| Excess | (22 m) (mJy) ddThe mid-infrared flux density at m . | — | |
| bbThe energy index. | — | ||
| (Hz) ccThe cut-off frequency. | — | ||
2.4 Spectral modeling of the mid-infrared excess
Firstly, the radio-to-optical spectral energy distribution observed from the west hot spot of Pictor A was fitted with a single cutoff-PL model. For the mid-infrared data, only those with WISE were utilized. To compensate possible interband flux calibration uncertainties, the systematic error on the WISE photometry (i.e., ) was taken into account. The resultant spectral parameters are summarized in Table 2. The energy index and flux density, and Jy at 5 GHz, both agree with those of the radio spectrum in the 330 MHz – 230 GHz range (see §2.3). As shown in the middle panel of Figure 3, the fit was rather poor with a reduced chi-square of . In addition, the residual of several data points from the model is found to be larger than . It is important to note that the mid-infrared excess is basically supported by the single cutoff-PL model. Its significance at m was evaluated as when the systematic uncertainty of the WISE photometry was considered.
Secondly, a double cutoff-PL model was fitted to the observed spectrum, in order to quantify the excess spectrum. The main component aims to describe the normal synchrotron radiation dominating the radio-to-optical spectrum, while the other component is introduced to approximate the mid-infrared excess. The best-fit model is shown with the solid line in the bottom panel of Figure 3, and its spectral parameters are tabulated in Table 2. The observed spectrum was reasonably reproduced by the model (), and thus, the deviation of the model becomes insignificant for all the data points. Therefore, the the double cutoff-PL fitting seem mode preferable, rather than the single cutoff-PL one.
The energy index and cutoff frequency of the main component were constrained as and Hz respectively. The main component becomes slightly softer than the single cutoff-PL model, and hence the PL model to the radio spectrum, probably due to the excess component. In the mid-infrared band, the excess component (the thick dashed line in Figure 3) has a similar contribution to that of the main component (the dash-dotted line). The excess component exhibits a hard index of , which is consistent to the prediction from the strong shock limit (). The cutoff frequency of the excess component, Hz, is lower by an order of magnitude than that of the main component.
3 Discussion
3.1 Summary of the mid-infrared excess
The west hot spot of the FR II radio galaxy Pictor A was identified as the mid-infrared source, WISE J051926.26454554.1, listed in the AllWISE source catalog. A comparison of the WISE and ATCA images confirms that the mid-infrared source corresponds to the radio peak of the hot spot rather than the filamentary structure on the southeast (Röser & Meisenheimer, 1987). After carefully evaluating the WISE flux density (see Table 1), the mid-infrared energy index of the hot spot was evaluated as . Figure 3 indicates that the m WISE flux density significantly exceeds the simple extrapolation of the radio PL spectrum with an index of . The excess is reinforced by the single/double cutoff-PL modeling of the radio-to-optical spectral energy distribution. The mid-infrared spectrum with Spitzer (Werner et al., 2012) exhibits a similar trend.
The radio-to-optical spectral energy distribution from the west hot spot of Pictor A has been widely attributed to synchrotron emission from relativistic electrons accelerated via the first-order Fermi mechanism in the jet terminal shock (e.g., Meisenheimer et al., 1989, 1997; Wilson et al., 2001; Tingay et al., 2008; Werner et al., 2012). The linear polarization in the radio (Perley et al., 1997) and optical (Thomson et al., 1995) frequencies reinforces the synchrotron origin. However, the standard one-zone model, basically predicting a PL electron energy distribution with a high-energy cutoff and/or break (e.g., Carilli et al., 1991), is unable to reproduce the mid-infrared excess. Therefore, in order to interpret the mid-infrared data, a two-zone model is strongly favored.
Previously, mid-infrared properties has been investigated with Spitzer for about two dozens of hot spots of FR-II radio galaxies. Stawarz et al. (2007) successfully reproduced the radio-to-X-ray spectral energy distribution of the two high-luminosity hot spots of Cygnus A, namely A and D (Hargrave &, 1974), with the one-zone synchrotron+SSC model, where the mid-infrared data agree with the high-frequency end of the synchrotron component. The mid-infrared spectrum of the radio structures associated with the hot spots of the FR II source, 3C 33, is reported to be smoothly connected to the synchrotron radio spectrum, while the second synchrotron component is requested to interpret the X-ray spectrum for the most radio structures (Kraft et al., 2007). Werner et al. (2012) systematically studied the multi-frequency spectrum of 17 radio hot spots, from which the mid-infrared and X-ray emissions were detected, including the west hot spot of Pictor A. None of these objects are reported to show a clear sign of the mid-infrared excess. However, they utilized the radio data only at 5 GHz instead of the wide-band synchrotron radio spectrum, and their spectral model is simply based on the strong shock assumption (). These simplification are possible to conceal the mid-infrared excess, since the model with should artificially overpredicts the mid-infrared flux density, when it is fitted to the 5 GHz radio data, especially for sources with a soft radio spectrum ().
Actually, owing to the careful modeling of the synchrotron spectrum, the present study succeeded in detecting the mid-infrared excess from the west hot spot of Pictor A, which exhibits a relatively soft radio spectrum (). This result is regarded as the first discovery of the mid-infrared excess from hot spots in FR II radio galaxies.
3.2 How to constrain the magnetic field
In the following, the two-zone scenario is adopted to examine the physical parameters in the hot spot. The magnetic field of the main and excess components is estimated from the cutoff frequency. The cutoff frequency is usually attributed to the maximum Lorentz factor of accelerated electrons or the break Lorentz factor due to radiative cooling. The previous studies on the west hot spot of Pictor A (e.g., Tingay et al., 2008) suggests that the synchrotron cooling dominates over the inverse-Compton one. The analytical estimates by Kino & Takahara (2004) indicates that the observed spectral parameters of the object are found to be within the cooling break regime.
By equating the synchrotron cooling time scale to the adiabatic loss time scale , the break Lorentz factor is derived as (e.g., Inoue & Takahara, 1996), where is the electron rest mass, is the energy density of the magnetic field , is the Thomson cross section, is the thickness of the acceleration region for electrons with , and is the downstream flow velocity in the shock frame. In this condition, the magnetic field is constrained from () as follows;
| (2) |
where is the electron charge.
3.3 Comparison with the minimum-energy magnetic field.
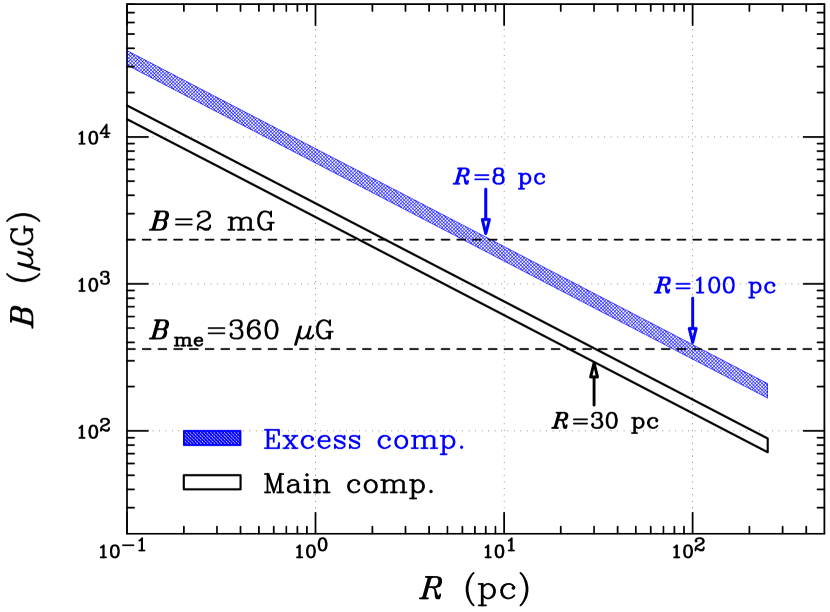
Figure 4 shows the acceptable parameter space on the – plane, derived from Equation 2, for a representative value of the flow velocity, (e.g., Kino & Takahara, 2004). The excess component tends to exhibit a higher magnetic field due to its lower value.
In order to infer the physical condition for the main component, the minimum energy argument (Miley, 1980) is adopted as the simplest working hypothesis. Adopting the radio emitting volume, which is equivalent to a sphere with a radius of pc (Wilson et al., 2001; Tingay et al., 2008), the spectral energy distribution shown in Figure 3 yields the minimum-energy magnetic field as G. Here, the proton energy density is assumed to be equal to the electron one. On the field strength, It is suggested that the synchrotron electrons corresponding to for the main component are generated within – pc around the shock, as shown with the upward arrow in Figure 4. The estimated size is consistent with the result from the detailed spectral modeling of this hot spot without mid-infrared data ( pc; Meisenheimer et al., 1997).
The first interpretation of the excess component assumes that the two components originate in the different regions within the hot spot, but with the same magnetic field (i.e., G). The electron cooling time scale of the excess component ( yrs) is expected to be longer by a factor of than that of the main component, due to its lower cutoff frequency by a factor of . This implies that the excess electron population is older than the main one. Accordingly, the excess electrons is expected to be distributed in a wider region ( pc, see the right downward arrow in Figure 4) than the main ones.
The second and more attractive explanation hypothesizes that the excess is produced in a region with a stronger magnetic field. A number of theoretical studies (e.g., Lucek & Bell, 2000; Inoue et al, 2009; Fraschetti, 2013; Araudo et al., 2015; Ji et al., 2016) proposed that the magnetic field is amplified by plasma instabilities, turbulences, or non-linear interactions between the field and accelerated particles. Based on these studies, the amplification by a factor of at least – is achievable (Lucek & Bell, 2000). Thus, the minimum energy field in the west hot spot of Pictor A is possible to be magnified up to mG. On Figure 4, this field corresponds to the thickness of – pc (shown with the left downward arrow).
With the VLBA image, Tingay et al. (2008) resolved the hot spot of Pictor A into sub structures with a size of pc. Summed over these sub structures, the radio flux density was measured as mJy at GHz. They interpreted that these sub structures correspond to the recent shocks with a higher energy density (i.e, a stronger magnetic field) than the mean energy density over the hot spot. Interestingly, the size of the excess component is comparable to those of these sub structures. In addition, the GHz flux density of the excess component, which is estimates from the double cutoff-PL fitting as – mJy, agrees with that of the sub structures. Therefore, it is natural to arrive at the scenario that the acceleration site of the excess component is some of these sub structures with a strengthened magnetic field.
3.4 Relation to the origin of the X-ray spectrum
The X-ray spectrum measured with Chandra (the photon index of ; Wilson et al., 2001) is reported to be significantly steeper than the synchrotron radio one. It is widely known that this inconsistency between the radio and X-ray spectral slope makes unfeasible the simple one-zone synchrotron+SSC interpretation for the wide band spectral energy distribution from the object. Tingay et al. (2008) proposed that fresh electrons accelerated in the recent shocks, which are traced by the VLBA sub structures, produce the observed X-ray spectrum via synchrotron radiation. Their hybrid synchrotron model, where the radio and X-ray photons originate in the whole hot spot and compact regions respectively, successfully reproduced the overall spectral energy distribution. From the model, the synchrotron peak of the compact component is expected to be located in the X-ray band. The X-ray spectral break suggested in the deep Chandra observation (Hardcastle et al., 2016) possibly supports this explanation.
By modifying the scenario by Tingay et al. (2008), the mid-infrared excess revealed with WISE and Spitzer is suggested to request three different populations of synchrotron electrons in the west hot spot of Pictor A; two of which are localized in the compact sub structures. Assuming the magnetic field in these compact regions is magnified up to mG, as discussed in §3.3, the synchrotron cooling time scale of the X-ray electrons is evaluated as yrs where is the synchrotron photon energy in the unit of keV. This is significantly shorter than that of the mid-infrared excess, yrs . Therefore, one of the plausible ideas is that among the VLBA sub structures, the younger ones are the origin of the X-ray spectrum, while the mid-infrared excess are radiated from the older ones.
It is claimed that the compact structures with an amplified magnetic field are a transient feature, since they rapidly expand to achieve pressure balance with the ambient region (Tingay et al., 2008). As a result, the emission from these compact regions are expected to be variable with a short time scale. This is possibly confirmed by a series of Chandra observations of the west hot spot of Pictor A, in which the X-ray flux decayed by % in a time scale of months (Hardcastle et al., 2016). The variability implies that the core of the X-ray emitting region is possible to be in a sub-pc scale. Between the WISE and Spitzer observations separated by yrs, no significant change was indicated in the mid-infrared flux, when all the photometric uncertainties are taken into consideration, including the WISE systematic errors ( in Table 1) and the Spitzer one (typically %; Carey et al., 2012).
3.5 Prospects
The striking implication from the close investigation into the synchrotron spectrum of the west hot spot of Pictor A is that the radio and mid-infrared spectra are of different origin from each other, as is visualized in the bottom panel in Figure 3. If this is the case in other objects, the mid-infrared emission is inferred to dominate over the radio one in some particular condition, although what controls the relative importance between the radio and mid-infrared emission remains unsettled. Currently, hot spots, that are bright in the mid-infrared band and instead relatively weak in the radio band, have not yet known. The all-sky survey data with WISE has a great potential to search for such “mid-infrared hot spots.”
The multi-zone interpretation presented above is expected to be reinforced by precisely measuring the synchrotron spectrum in between the radio and mid-infrared frequencies. However, the far-infrared flux of the west hot spot of Pictor A estimated from the WISE result, mJy at m, is below the detection limit of previous far-infrared all-sky surveys, including the AKARI all-sky survey catalog ( Jy at m; Yamamura et al., 2012). Future observations with the next-generation infrared observatory SPICA (Space Infrared Telescope for Cosmology and Astrophysics; Roelfsema et al., 2017) and ALMA are of prime importance. In addition, multi-epoch observations with the James Webb Space Telescope in the near future are useful to search for mid-infrared flux variation. This will constrain the regions size and thus reconfirm the sub-structure explanation for the mid-infrared excess from the west hot spot of Pictor A.
References
- Araudo et al. (2015) Araudo, A. T., Bell, A. R., & Blundell, K. M., 2015, ApJ, 806, 243
- Begelman et al. (1984) Begelman, M. C., Blandford, R. D., & Rees, M. J., 1984, Reviews of Modern Physics, 56, 255
- Carilli et al. (1991) Carilli, C. L., Perley, R. A. Dreher, J. W. et al., 1991, ApJ, 383, 554
- Carey et al. (2012) Carey, S., Ingalls, J., Hora, J., et al., 2012, Proc. SPIE, 8442, 84421Z
- Eracleous & Halpern (2004) Eracleous, M., & Halpern, J. P., 2004, ApJS, 150, 181
- Fanaroff & Riley (1974) Fanaroff, B. L., & Riley, J. M., 1974, MNRAS, 167, 31
- Fraschetti (2013) Fraschetti, F., 2013, ApJ, 770, 84
- Hardcastle et al. (2004) Hardcastle, M. J., Harris, D. E., Worrall, D. M., et al., 2004, ApJ, 612, 729
- Hardcastle et al. (2016) Hardcastle, M. J., Lenc, E., Birkinshaw, M., et al., 2016, MNRAS, 455, 3526
- Hargrave & (1974) Hargrave, P. J., & Ryle, M., 1974, MNRAS, 166, 305
- Hillas (1984) Hillas, A. M., 1984, ARA&A, 22, 425
- Inoue & Takahara (1996) Inoue, S., & Takahara, F., 1996, ApJ, 463, 555
- Inoue et al (2009) Inoue, T., Yamazaki, R., & Inutsuka, S., 2009, ApJ, 695, 825
- Jarrett et al. (2011) Jarrett, T. H., Cohen, M., Masci, F., et al., 2011, ApJ, 735, 112
- Ji et al. (2016) Ji, S., Oh, S. P., Ruszkowski, M. et al., 2016, MNRAS, 463, 3989
- Kino & Takahara (2004) Kino, M., & Takahara, F., 2004, MNRAS, 349, 336
- Kraft et al. (2007) Kraft, R. P., Birkinshaw, M., Hardcastle, M. J., et al., 2007, ApJ, 659, 1008
- Lucek & Bell (2000) Lucek, S.G., & Bell, A.R., 2000, MNRAS, 314, 65
- Meisenheimer et al. (1989) Meisenheimer, K., Roser, H.-J., Hiltner, P. R., et al., 1989, A&A, 219, 63
- Mainzer et al. (2011) Mainzer, A., Bauer, J., Grav, T., et al., 2011, ApJ, 731, 53
- Meisenheimer et al. (1997) Meisenheimer, K., Yates, M. G., & Roeser, H.-J., et al., 1997, A&A, 325, 57
- Miley (1980) Miley, G., 1980, ARA&A, 18, 165
- Orienti et al. (2017) Orienti, M., Brunetti, G., Nagai, H., et al. 2017, MNRAS, 469, L123
- Perley et al. (1997) Perley, R.A., Roser, H-J. & Meisenheimer, K., 1997, A&A, 328, 12
- Roelfsema et al. (2017) Roelfsema, P., Shibai, H., Wafelbakker, K., et al., 2017, submitted to PASA
- Röser & Meisenheimer (1987) Röser, H-J., & Meisenheimer, K. 1987, ApJ, 314, 70
- Rieke & Lebofsky (1985) Rieke, G. H., & Lebofsky, M. J., 1985, ApJ, 288, 618
- Schlegel et al. (1985) Schlegel, D. J., Finkbeiner, D. P., & Davis, M., 1998, ApJ, 500, 525
- Spergel et al. (2003) Spergel, D. N., Verde, L., Peiris, H. V., et al., 2003, ApJS, 148, 175
- Stawarz et al. (2007) Stawarz, L., Cheung, C. C., Harris, D. E., et al., 2007, A&A, 662, 213
- Thomson et al. (1995) Thomson, R. C., Crane, P., Mackay, C. D., et al., 1995, ApJ, 446, 93
- Tingay et al. (2008) Tingay, S. J., Lenc, E., Brunetti, G., et al., 2008, AJ, 136, 2473
- Uchiyama et al. (2006) Uchiyama, Y., Urry, C. M., Cheung, C. C., et al., 2006, ApJ, 648, 910
- Werner et al. (2012) Werner, M. W., Murphy, D. W., Livingston, J. H., et al., 2012, ApJ, 759, 86
- Wilson et al. (2001) Wilson, A. S., Young, A. J., Shopbell, P. L., et al. 2001, ApJ, 547, 740
- Wright et al. (2010) Wright, E. L., et al., 2010, AJ, 140, 1868
- Yamamura et al. (2012) Yamamura, I., Makiuti, S., Ikeda, N., et al. 2012, Publications of The Korean Astronomical Society, 27, 105