The 2016-2017 peak luminosity of the pre-main sequence variable V2492 Cyg
Abstract
Context. V2492 Cyg is a young pre-main sequence star presenting repetitive brightness variations of significant amplitude ( 5 mag) whose physical origin has been ascribed to both extinction (UXor-type) and accretion (EXor-type) variability, although their mutual proportion has not been clarified yet. Recently, V2492 Cyg has reached a level of brightness ever registered in the period of its documented activity.
Aims. We aim to derive the variation of the mass accretion rate between low- and high-state and to get new insights on the origin of the variability of V2492 Cyg.
Methods. Optical and near-infrared photometry and spectroscopy have been obtained in October 2016 and between March and July 2017. The source has remained bright until the end of May 2017, then it started to rapidly fade since the beginning of June at a rate of 0.08 mag/day. On mid-July 2017 the source has reached the same low-brightness level as two years before. Extinction and mass accretion rate were derived by means of the luminosity of the brightest lines, in particular H and H. A couple of optical high-resolution spectra are also presented to derive information on the gas kinematics.
Results. Visual extinction variations do not exceed a few magnitudes, while the mass accretion rate is estimated to vary from less than 10-8 up to a few 10-7 M⊙ yr-1. This latter is comparable to that estimated on the previous high-state in 2010, likely occurred under more severe extinction conditions.
Conclusions. The combined analysis of the optical and near-infrared (NIR) observations extends to the present event the original suggestion that the V2492 Cyg variability is a combination of changing extinction and accretion.
Key Words.:
Stars: protostars – stars: variables: T Tauri – infrared: stars – stars: individual (V2492 Cyg) – stars: winds, outflows1 Introduction
Intermittent outbursts of significant amplitude (V 3-5 mag), due to repetitive accretion events onto pre-main sequence (PMS) stars, are referred as EXor phenomena (Herbig 1989, 2008; Hartmann, Herczeg, & Calvet 2016). These bursts are thought to be triggered by instabilities in the inner parts of the circumstellar disk (D’Angelo & Spruit 2010, 2012; Armitage 2016). Observationally, EXor are quite rare systems, with only a few tens of examples known so far (see e.g., Audard et al. 2014) and in some cases the classification is uncertain since the observed properties (burst amplitude, cadence, optical/IR colors) are attributable to accretion as well as to extinction episodes related to orbiting dust structures that move along the line of sight (UXors variables, Grinin 1988). These latter are more compatible with repeating brightness variations with the same period and amplitude, while more erratic variations favor the accretion hypothesis. This is the reason why a photometric and spectroscopic monitoring of subsequent outbursts are in order.
In the framework of our monitoring program EXORCISM (Antoniucci et al. 2014), an ideally suited candidate is the young low-mass object V2492 Cyg located in the Pelican Nebula ( = 20h51m26.23s, = +44∘05′23.9′′), which has shown repetitive brightness variations with 5 mag. The first recorded episode was discovered on 2010 August 23 by Itagaki & Yamaoka (2010). This event has been followed by brightening and fading events carefully investigated by Hillenbrand et al. (2013), and interpreted as a quasi-periodical phenomenon consistent with changes of extinction in the inner disk material ( 30 mag). The role of dust obscuration was further enhanced by the study of Kóspál et al. (2013). Based on the constancy of the far-infrared fluxes, these authors conclude that the observed variability is due to the occultation of the inner disk by a dense, long-live dust cloud, and therefore they regarded V2492 Cyg as a young UXor variable. From a spectroscopic point of view, however, V2492 Cyg presents features more typical of EXor spectra, such as H i lines and CO overtone bandheads in emission, as well as signatures of a well developed outflow (Covey et al. 2011, Aspin 2011, Hillenbrand et al. 2013). Therefore, a unified picture of the physical phenomena occuring on V2492 Cyg and in its environment is still lacking.
The most recent (November 2016-March 2017) peak of brightness, the highest ever recorded, has been announced by Ibryamov & Semkov (2017) and photometrically monitored by Froebrich et al. (2017) and Munari et al. (2017). Here we present optical and near-infrared (NIR) photometry and spectroscopy taken during this phase of maximum brightness along with the subsequent fading currently ongoing. Observations are described in Section 2, while the results are presented and discussed in Section 3. Our summary is given in Section 4.
2 Observations
2.1 Photometry
optical photometry (Table 1 and Figure 1) has been obtained with the telescope ID 310 operated in Cembra (Italy) by the Asiago Novae and Symbiotic stars (ANS) Collaboration. Data reduction involved correction for nightly bias, dark and flat fields. Full photometric calibration was achieved from APASS survey data (Henden et al. 2012, Henden & Munari 2014) using the SLOAN-Landolt transformation equations calibrated in Munari (2012) and Munari et al. (2014a,b).
photometry (Table 2 and Figure 1) was obtained at the 1.1m AZT-24 telescope located at Campo Imperatore (L’Aquila - Italy) equipped with the imager and spectrometer SWIRCAM (D’Alessio et al. 2000). All the observations were obtained by dithering the telescope around the target position. The raw imaging data were reduced by using standard procedures for bad pixel removal, flat fielding, and sky subtraction. Photometric calibration was obtained from the 2MASS photometry of bright stars present in the 44 44 field.
| MJD | Date | ||||
|---|---|---|---|---|---|
| 57829 | 2017 03 17 | 15.68 | 13.93 | 12.88 | 11.84 |
| 57838 | 2017 03 26 | 16.20 | 14.36 | 13.27 | 12.19 |
| 57862 | 2017 04 19 | 16.75 | 14.83 | 13.67 | 12.53 |
| 57872 | 2017 04 29 | 16.37 | 14.43 | 13.27 | 12.15 |
| 57879 | 2017 05 05 | - | 14.50 | 13.36 | 12.21 |
| 57896 | 2017 05 23 | - | 15.09 | - | 12.68 |
| 57900 | 2017 05 27 | - | 14.89 | - | 12.59 |
| 57902 | 2017 05 29 | 16.71 | 14.72 | 13.59 | 12.46 |
| 57912 | 2017 06 07 | - | 16.17 | - | 13.63 |
| 57930 | 2017 06 25 | - | 16.97 | - | 14.38 |
| 57950 | 2017 07 16 | - | 17.60 | 16.29 | 15.00 |
| MJD | Date | J | H | K |
|---|---|---|---|---|
| 57645 | 2016 09 14 | 10.88 | 9.61 | 8.18 |
| 57646 | 2016 09 15 | 10.89 | 9.66 | 8.24 |
| 57647 | 2016 09 16 | 11.10 | 9.83 | 8.35 |
| 57654 | 2016 09 23 | 10.95 | 9.66 | 8.21 |
| 57656 | 2016 09 25 | 11.04 | 9.71 | 8.26 |
| 57657 | 2016 09 26 | 11.06 | 9.68 | 8.21 |
| 57659 | 2016 09 28 | 11.20 | 9.76 | 8.28 |
| 57661 | 2016 09 30 | 11.40 | 9.90 | 8.42 |
| 57662 | 2016 10 01 | 11.58 | 10.01 | 8.48 |
| 57666 | 2016 10 05 | 11.20 | 9.73 | 8.23 |
| 57694 | 2016 11 02 | 10.83 | 9.53 | 8.12 |
| 57884 | 2017 05 11 | 10.82 | 9.35 | 7.87 |
| 57887 | 2017 05 14 | 10.72 | 9.34 | 7.86 |
| 57888 | 2017 05 15 | 10.92 | 9.48 | 8.01 |
| 57891 | 2017 05 18 | 11.17 | 9.44 | 8.13 |
| 57894 | 2017 05 21 | 10.86 | 9.46 | 7.90 |
| 57895 | 2017 05 22 | 10.86 | 9.46 | 7.93 |
| 57896 | 2017 05 23 | 11.04 | 9.66 | 8.12 |
| MJD | Date | Instr/Tel | Tint | |
|---|---|---|---|---|
| (yyyy mm dd) | (s) | |||
| 57197 | 2015 06 24 | MODS/LBT | 1500 | 1500 |
| 57665 | 2016 10 04 | LUCI2/LBT | 1000 | 1200 |
| 57829 | 2017 03 17 | ECH/1.82m | 18 000 | 2400 |
| 57840 | 2017 03 28 | B&C/1.22m | 2400 | 600 |
| 57852 | 2017 04 09 | ECH/1.82m | 18 000 | 4200 |
| 57862 | 2017 04 19 | B&C/1.22m | 2400 | 900 |
| 57950 | 2017 07 16 | B&C/1.22m | 2400 | 1800 |
2.2 Spectroscopy
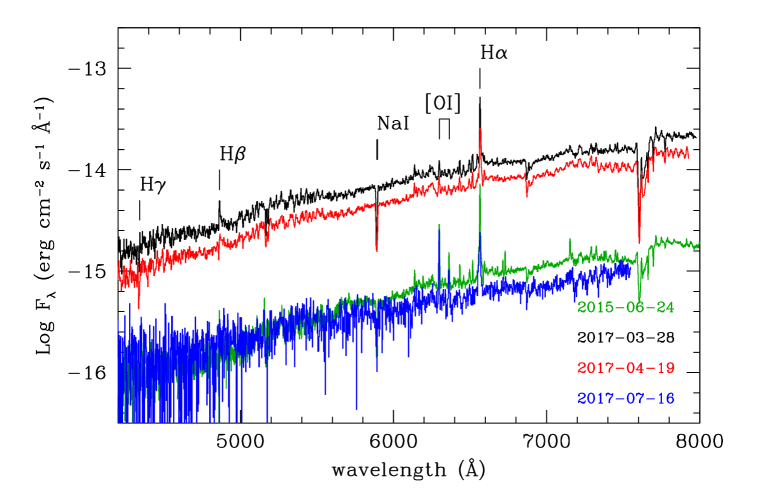
Table 3 gives the journal of the spectroscopic observations. We obtained four optical low-resolution spectra of V2492 Cyg, shown in Figure 2. The first one was taken using the Multi-Object Double Spectrograph (MODS - Pogge et al. 2010) mounted at the Large Binocular Telescope (LBT) on 2015 June 24, when the source was at a low level of activity (AAVSO333American Association of Variable Star Observers, (https://www.aavso.org/) magnitudes of 2015 June 22: =17.6, =16.0, =14.5). We integrated 1500 s in the spectral range 32009500 Å by using a 08 slit ( 1500). Other three low-resolution spectra were obtained on 2017 March 28, 2017 April 19, and 2017 July 16, being the first two very close in time to the brightness peak, and the last one obtained when the source was already faded. These spectra ( 35008000 Å at 2400) were obtained with the 1.22 m telescope + B&C spectrograph (Asiago, Italy) operated by the University of Padova. The steps adopted for of the data reduction are: correction for dark and bias, bad-pixel mapping, flat-fielding, and extraction of one-dimensional spectrum by integrating the stellar trace along the spatial direction. Wavelength calibration was obtained from the spectra of arc lamps. The Asiago spectra have been calibrated in flux through observations of standards before and after V2492 Cyg, while the MODS spectrum was calibrated by using the AAVSO magnitudes given above.
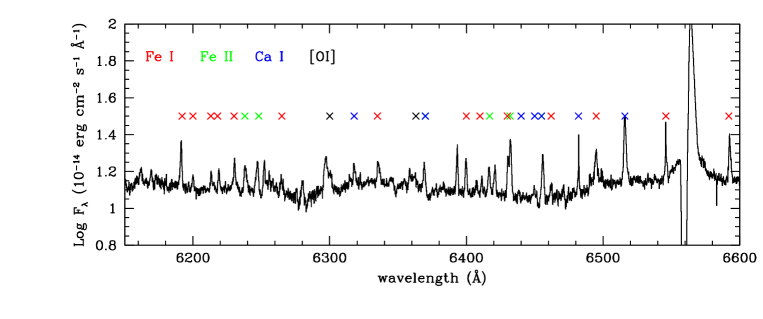
Two high-resolution optical spectra at 18 000 were acquired on 2017 March 17 and 2017 April 9 in the range 33008050 Å with the REOSC Echelle spectrograph mounted on the Asiago 1.82 m telescope. Data reduction and calibration were performed following the same steps cited above. Profiles of interesting lines are shown in Figure 3 while a sample interval of the spectrum of March 17 is depicted in Figure 4.
A NIR spectrum at 1300 was obtained with LUCI2 at LBT on 2016 October 4, when the source was already in a high-state of activity (Figure 5). The observations were carried out with the G200 low-resolution grating coupled with the 075 slit. The standard ABB’A’ technique was adopted to perform the observations using the and grisms (1.02.4 m), for total integration times of 12 and 8 minutes, respectively. The raw spectral images were flat-fielded, sky-subtracted, and corrected for optical distortions in both the spatial and spectral directions. Atmospheric absorptions were removed using the normalized spectrum of a telluric standard star, after fitting its intrinsic spectral features. Wavelength calibration was obtained from arc lamps, while for flux calibration the photometry of the day after the spectroscopic observation was assumed. No intercalibration was performed between the zJ and HK parts of the spectrum, since they were already optimally aligned.


3 Results and discussion
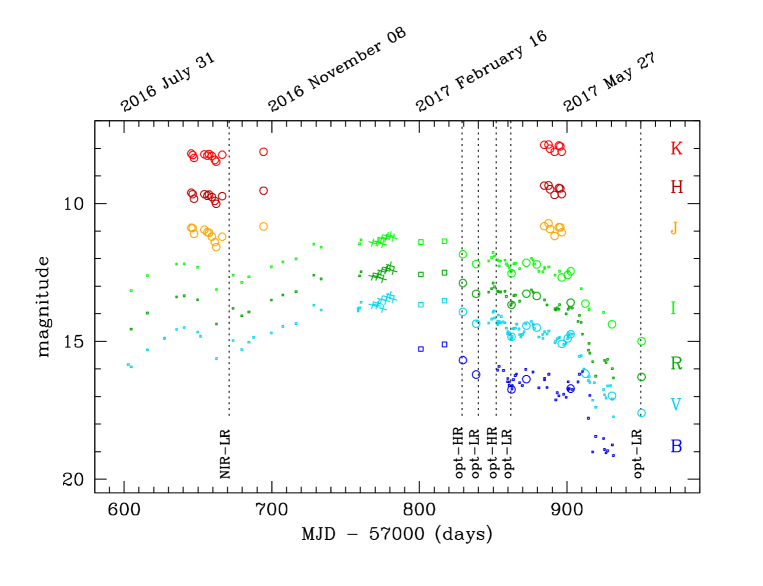
3.1 Light curve
Since its first recorded outburst in 2010, V2492 Cyg has continuously shown a high degree of photometric variability (see e.g., the AAVSO light-curve). In the present paper we concentrate on the last maximum phase and subsequent declining from September 2016 to July 2017 (MJD from 57645 to 57950). In Figure 1, together with our photometric data, we show also some literature (Ibryamov & Semkov 2017; Froebrich et al. 2017) and AAVSO data that optimally trace the brightness evolution. The peak of this last event corresponds to 13.5 mag. Previous brightness enhancements, monitored during the last seven years, peaked between 16 and 14 mag in the band (AAVSO light-curve). In the ”extinction-driven” scenario, the light-curve V2492 Cyg roughly resembles that of long-term (years to decades), quasi-cyclic UXor variables, such as, for example, BF Ori (Herbst & Shevchenko 1999), albeit in these sources the amplitude difference between subsequent peaks is definitely lesser (typically a few tens of magnitude) than in V2492 Cyg.
Our NIR monitoring does not cover exactly the five months of maximum brightness, but it significantly samples the peak activity period (September 2016 - May 2017, MJD from 57645 to 57896) during which the average magnitude fluctuations did not exceed 0.2 mag in all the NIR bands. An exception is the local brightness drop occurred between MJD=57659 and MJD=57666 (peak minimum at MJD=57662), registered also in the optical AAVSO light-curve. After this event, the NIR brightness has returned to the previous level and then remained fairly stable until the last photometric observation acquired in May 2017.
The optical monitoring started on March 2017 (MJD=57829), immediately after the brightness peak, and extended during the course of the declining phase, roughly started on April 2017 and still ongoing at the date of the last photometric point on 16 July 2017 (MJD=57950). From the beginning of April to the end of May 2017 the
source has slowly faded at a rate of 0.01 mag/day, then, since the beginning of June, it started a quick declining at 0.08 mag/day, as also shown by recent AAVSO data. This latter speed is similar to that of 0.1 mag/day measured by Hillenbrand et al. (2013) in three larger brightness drops occurred between 2010 and 2012.
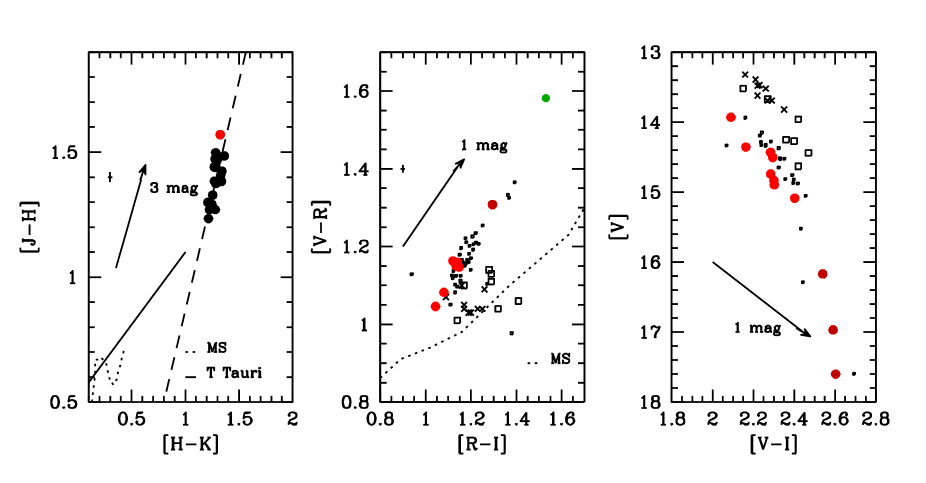
3.2 Photometric diagrams
In Figure 6 the photometric data are presented in form of two-colors and magnitude-color plots: vs. (left panel), vs. (middle panel), and [] vs. [] (right panel). NIR colors align well with the extinction vector (law of Cardelli et al. 1989). Their spread corresponds to a between 1 and 3 mag, being the reddest colors those of the local brightness minimum occurred at MJD=57662 (see Figure 6). This confirms the overall picture derived by the NIR color variations between 2010 and 2012 over a much larger range of magnitudes ( 5 mag), corresponding to 30 mag (Hillenbrand et al. 2013).
The optical colors, however, do not fully agree with extinction variability alone. While during the rising and declining phases color variations are consistent with AV changes 1 mag, at the brightness peak becomes significantly redder of about 0.4 mag, while maintains roughly constant (see the data of Froebrich et al. 2017 and Ibryamov & Semkov 2017 in Figure 6). This behavior is similar to that exhibited by the optical colors of the EXor source V1118 Ori during its 2015 outburst (Figure 7 of Giannini et al. 2017).
An even more evident deviation from the reddening vector is evident in the [] vs. [] data points taken between June and July 2017 (right panel of Figure 6 ). This changing in slope is likely contributed by both extinction and accretion rate variations, whose combined effect might also be responsible for the acceleration in the declining speed from 0.01 to 0.08 mag/day (Sect.3.1), observed in the same period. Noticeably, the observed feature is characteristic of a number of objects, like V1180 Cas (Kun et al. 2011), V1647 Ori (Mosoni et al. 2013), and in particular V346 Nor, where accretion rate and extinction enhancements appear significantly correlated (Kóspál et al. 2017). Also, the photometric variability of the pre-main sequence source V1184 Tau has been interpreted by Grinin et al. (2009) as due to repetitive accretion bursts followed by an increase of the geometric thickness of the inner disk rim, which is able to obscure a relevant portion of the central star.
| Date | FF | |||||
| (yyyy mm dd) | (10-14 erg s-1 cm.2) | |||||
| H | H | Pa10 | Pa9 | He i 6678Å | [O i]6300Å | |
| 2015 06 24 | 5.070.04 | 0.06 (-0.03)0.01 | 0.650.2 | 0.70.2 | 0.1 0.03 | 1.250.04 |
| Pa | Pa | Pa | Br | |||
| 2016 10 04 | 11.8 (-1.2)0.3 | 20.10.4 | 29.10.4 | 12.10.4 | ||
| H | H | H | Ca ii -K | He i 6678Å | [O i]6300Å | |
| 2017 03 17 | 41.7 (-5.0)0.2 | 1.9 (-1.1)0.2 | -0.70.2 | - | 0.8 0.1 | 2.70.2 |
| 2017 03 28 | 39.80.3 | 2.60.2 | - | 0.90.3 | 1.0 0.2 | 2.20.4 |
| 2017 04 09 | 15.4 (-2.2)0.3 | - | - | 0.5 0.1 | - | |
| 2017 04 19 | 23.40.3 | 1.40.3 | - | 1 | - | 2.00.3 |
| 2017 07 16 | 2.10.1 | - | - | - | - | 1.30.1 |
3.3 Description of the observed spectra
The 20102012 optical-NIR spectrum of V2492 Cyg has been studied in detail by Aspin (2011) and Covey et al. (2011), both in low- and high-brightness phases. It was rich of forbidden, permitted, and recombination atomic lines as well as molecular lines. In our low-resolution optical spectra of March and April 2017 the brightest lines are H, H, H, and Na i 5890/6 Å , with H and Na i seen in absorption (Figure 2) . In these spectra [O i]6300 Å is also identified at signal-to-noise ratio of about five, while, together with H, it becomes the brightest line in the quiescence spectra of June 2015 and July 2017. In addition, some H i lines of the Paschen series and He i 6678Å are detected in the MODS spectrum of June 2015. Permitted lines emission of neutral and singly ionized species (mainly Fe i , Fe ii , and Ca i ) is also detected in our high-resolution optical spectra of March and April 2017 (see Figure 4).
In the NIR the most prominent lines are the H i lines of the Paschen and Brackett series (Figure 5). We also report the detection of the Na i 2.206, 2.207 m doublet along with CO v=2-0 and v=3-1 bandhead emission. Noticeably, in EXor spectra Na i and CO are seen both in absorption or emission depending on the level of the source activity. Examples are, among others, XZ Tau, PV Cep, V1647 Ori, V1118 Ori (Lorenzetti et al. 2009, Aspin et al. 2008, Giannini et al. 2017), and V2492 Cyg itself (Hillenbrand et al. 2013).
In Table 4 we give the fluxes of the lines that we have used for the subsequent analysis, and in particular for the determination of the mass accretion rate.
3.4 Mass accretion rate determination
| Date | |||
|---|---|---|---|
| (yyyy mm dd) | (mag) | (L⊙) | (10-7 M⊙ yr-1) |
| 2015 06 24 | 4 | 0.40.1 | 0.650.15 |
| 2016 10 04 | 2.5 | 4.41,1 | 5.30.9 |
| 2017 03 17 | 3 | 1.40.7 | 1.60.8 |
| 2017 03 28 | 3.5 | 2.80.5 | 2.20.8 |
| 2017 04 09 | 3 | 0.90.3 | 0.60.3 |
| 2017 04 19 | 3 | 0.70.2 | 0.80.3 |
| 2017 07 16 | 2.55a𝑎aa𝑎aAssumed range. | 0.020.3 | 0.030.3 |
The computation of the mass accretion rate is based on the empirical relationships by Alcalá et al. (2017), which connect the accretion luminosity to the luminosity of many emission lines () in the optical and near-IR range. These relationships were obtained from VLT/X-Shooter observations of a large sample of Class II sources in Lupus, by modeling the emission observed in excess to the stellar photosphere as the continuum emission of a slab of hydrogen, which provides a independent measurement of (see Alcalá et al. 2014, Manara et al. 2013). Alcalá et al. (2017) provide relations for all the H i lines observed in our V2492 Cyg spectra, plus the He i 6678Å and Ca II K lines.
From each of these lines we are able to derive a value of , provided that the distance and extinction are known, as we need to convert the measured line fluxes into luminosities. For the distance to the Pelican Nebula, we considered the value 550 pc (Bally & Reipurth 2003). Since V2492 Cyg is subject to a highly variable extinction, we preferred not to assume a previously determined estimate of , so we adopted the following method. We considered a range of values for (from 0 to 30 mag in steps of 0.5 mag) and for each of these values we computed from each line by using the relevant relationship by Alcalá et al. (2017). This way, we obtained different sets of accretion luminosities (one for each value) that are characterized by different dispersions. The extinction for which the obtained dispersion shows a minimum is the value we eventually adopted. Once the extinction was thus determined, we computed as the median value of the accretion luminosities of this least dispersed set (see e.g., Giannini et al. 2016, 2017). The and values derived from this procedure are reported in Table 5. In particular, we derived =4 mag in June 2015, and between 2.53.5 mag in March and April 2017, which is in reasonable agreement with the indications of the color-color diagrams displayed in Figure 6. The previous method could not be applied to estimate on the spectrum of July 2017, since only H is detected there. A reasonable range of is derived in this case by taking as lower limit the same value as in the previous dates ( = 2.5 mag) and as upper limit the one derived by assuming that the observed fade is caused only by the extinction increase ( 5 mag, see Figure 1).
Finally, we adopted the relation by Gullbring et al. (1998) to convert into :
| (1) |
where and are the stellar mass and radius and is the inner truncation radius of the disk. We consider = 2 R⊙ and = 0.7 M⊙, as evaluated from the EXor HR diagram recently published by Moody & Stahler (2017), while for the factor we assumed a value of 0.8, which implies a typical inner disk radius .
The derived are reported in the final column of Table 5. We find 1.55 10-7 M⊙ yr-1 during the high-brightness phase, with fluctuations that roughly follow the photometric evolution. The highest determination is derived on October 2016. Since it was derived from NIR lines only, however, we cannot exclude that it might be biased, for example, by an underestimate of the , to which the NIR lines are less sensitive than the optical lines, and/or an overestimate of .
For comparison, we applied the method described above to the H i fluxes of two optical spectra obtained between August and October 2010 by Hillenbrand et al. (2013) and Aspin et al. (2011). We obtained AV=59 mag and 2 10-7 M⊙ yr-1 , in optimal agreement with the estimates (A12 mag and 2.5 10-7 M⊙ yr-1 ) given by Covey et al. (2011). Therefore, we can conclude that the 2010 and 2016 brightness enhancements have occurred at a similar level of the intrinsic luminosity but under different obscuration conditions.
As far as the low-brightness spectra is concerned, MODS lines observed in June 2015 are consistent with 58 10-8 M⊙ yr-1 , roughly a factor of approximately ten or less lower than the peak value. Conversely, a significant drop of might have occurred on July 2017. A more precise AV estimate, however, should have been derived to make this result more reliable.
Summarizing, at variance for example with the case of V346 Nor, it seems that in V2492 Cyg there is not a simultaneous increase of mass accretion rate and extinction. Rather, there are evidences for the opposite trend. We remark, however, that our data do not cover the entire variability range displayed by V2492 Cyg in the past (the minimum registered is 20 mag, AAVSO light-curve). Observations during a deep minimum should be of great help to solve the question.
3.5 Line profiles
The two Echelle spectra, obtained at about one a month interval from each other, significantly differ, being the spectrum of March 17 much brighter. In this latter, the Balmer lines from H to H are detected. H and H are seen only in absorption while H and H present composite profiles with a broad emission component slightly red-shifted and a flattened P-Cyg absorption extending up to 200 km s-1. The spectrum is rich also in low-lying ionized metallic lines (mainly Fe i , Fe ii , and Ni i , as depicted in Figure 4). Their FWHM ranges between 45 to 85 km s-1 depending on ion and multiplet. This is typical of gas in funnel flows close to the disk surface, where photons from the central star are partially shielded (Sicilia-Aguilar et al. 2012, Kóspál et al. 2011, Beristain et al. 1998). All the lines are seen in emission, with the exception of Fe ii lines of multiplet 42 at 4923.93Å , 5018.45Å , 5169.03Å , and possibly Mg i 5183.60Å (Figure 3). These lines present absorption profiles centered at vlsr = 80 km s-1, FWHM = 154 km s-1 and a blue-end velocity similar to that of Balmer lines and Na i doublet. Their profiles are therefore suggestive of an accelerated and ionized gas outflowing in proximity of the star. Conversely to the case of V2492 Cyg, the Fe ii lines of multiplet 42 have been observed in emission on the spectra of the EXors DR Tau (Beristain et al. 1998) and EX Lup (Sicilia-Aguilar et al. 2012). In the latter source in addition to the main component in emission they also present a blue-shifted absorption consistent with a wind origin.
The [O i]6300Å line is also observed. It presents a double component, one roughly centered at the rest velocity with FWHM 144 km s-1, and a blue-shifted component peaking at about 100 km s-1 and extending up to 200 km s-1, in agreement with the permitted wind lines. The [O i]6363Å is detected at a lower signal-to-noise ratio, while the [N ii] and [S ii] nebular emission lines reported, among others, by Aspin (2011) and by Covey et al. (2011), are absent on our spectra.
4 Summary
We have presented optical and NIR photometric and spectroscopic observations of the pre-main sequence variable V2492 Cyg, obtained during the peak luminosity reached on 2016-2017. The main results of our observations can be summarized as follows:
-
-
One cause of the observed brightening is likely a strong decline of the local obscuration, with the estimated extinction definitively lower than during faint states (when AV may increase up to 30 mag).
-
-
A significant enhancement of the mass accretion rate has also likely occurred during the investigated period. This is testified by the deviation of the optical colors from the extinction law direction, the detection of Na i 2.2 m and CO bands both in emission, and the enhancement of the H i fluxes in the high-brightness spectra, and by the variation of the mass accretion rate obtained from the observed line luminosity. The existence of gas in funnel flows is also supported by the detection of metallic lines with width 50 km s-1.
-
-
We obtain of 25 10-7 M⊙ yr-1 at the peak, namely about a factor up to ten higher than in a fainter state prior the brightness enhancement. Conversely, our analysis suggests that a rapid drop of is ongoing since July 2017. The value estimated at the brightness peak is similar to that reached in 2010, this latter likely occurred under more severe obscuration conditions.
-
-
A high-velocity wind is probed by the Hydrogen recombination, [O i]6300Å and some Fe ii lines. These profiles are characterized by a similar central and terminal velocity, which extends up to 200 km s-1.
5 Acknowledgements
This work is based on observations made with different instruments:[1] the LBT. The LBT is an international collaboration among institutions in the United States, Italy and Germany. LBT Corporation partners are: The University of Arizona on behalf of the Arizona university system; Istituto Nazionale di Astrofisica, Italy; LBT Beteiligungsgesellschaft, Germany, representing the Max-Planck Society, the Astrophysical Institute Potsdam, and Heidelberg University; The Ohio State University, and The Research Corporation, on behalf of The University of Notre Dame, University of Minnesota and University of Virginia; [2] the Asiago ANS Collaboration telescopes operated under the responsability of the INAF-Osservatorio Astronomico di Padova (OAPd); [3] the AZT-24 IR telescope at Campo Imperatore (L’Aquila - Italy) operated by INAF-Osservatorio Astronomico di Roma (OAR). We acknowledge the observers who contribute to the AAVSO International Database. The authors are grateful to Lynn Hillenbrand for providing her spectra of V2492 Cyg.
References
- Alcalá et al. (2014) Alcalá, J. M., Natta, A., Manara, C. F., et al. 2014, A&A, 561, A2
- Alcalá et al. (2017) Alcalá, J. M., Manara, C. F., Natta, A., et al. 2017, A&A, 600, A20
- Alves et al. (1997) Alves, J., Hartmann, L., Briceno, C., & Lada, C. J. 1997, AJ, 113, 1395
- Antoniucci et al. (2014) Antoniucci, S., Arkharov, A. A., Di Paola, A., et al. 2014, A&A, 565, L7
- Armitage (2016) Armitage, P. J. 2016, ApJ, 833, L15
- Aspin et al. (2011) Aspin, C., Beck, T. L., Davis, C. J., et al. 2011, AJ, 141, 139
- Aspin et al. (2008) Aspin, C., Beck, T. L., & Reipurth, B. 2008, AJ, 135, 423
- Audard et al. (2014) Audard, M., Ábrahám, P., Dunham, M. M., et al. 2014, Protostars and Planets VI, 387
- Bally & Reipurth (2003) Bally, J., & Reipurth, B. 2003, AJ, 126, 893
- Beristain et al. (1998) Beristain, G., Edwards, S., & Kwan, J. 1998, ApJ, 499, 828
- Cardelli et al. (1989) Cardelli, J. A., Clayton, G. C., & Mathis, J. S. 1989, ApJ, 345, 245
- Covey et al. (2011) Covey, K. R., Hillenbrand, L. A., Miller, A. A., et al. 2011, AJ, 141, 40
- D’Alessio et al. (2000) D’Alessio, F., Di Cianno, A., Di Paola, A., et al. 2000, Proc. SPIE, 4008, 748
- D’Angelo & Spruit (2010) D’Angelo, C. R., & Spruit, H. C. 2010, MNRAS, 406, 1208
- D’Angelo & Spruit (2012) D’Angelo, C. R., & Spruit, H. C. 2012, MNRAS, 420, 416
- Froebrich et al. (2017) Froebrich, D., Campbell-White, J., Zegmott, T., et al. 2017, The Astronomer’s Telegram, No. 10259, 259
- Giannini et al. (2016) Giannini, T., Lorenzetti, D., Antoniucci, S., et al. 2016, ApJ, 819, L5
- Giannini et al. (2017) Giannini, T., Antoniucci, S., Lorenzetti, D., et al. 2017, ApJ, 839, 112
- Grinin (1988) Grinin, V. P. 1988, Soviet Astronomy Letters, 14, 27
- Grinin et al. (2009) Grinin, V. P., Arkharov, A. A., Barsunova, O. Y., Sergeev, S. G., & Tambovtseva, L. V. 2009, Astronomy Letters, 35, 114
- Gullbring et al. (1998) Gullbring, E., Hartmann, L., Briceño, C., & Calvet, N. 1998, ApJ, 492, 323
- Hartmann et al. (2016) Hartmann, L., Herczeg, G., & Calvet, N. 2016, ARA&A, 54, 135
- Henden et al. (2012) Henden, A. A., Levine, S. E., Terrell, D., Smith, T. C., & Welch, D. 2012, Journal of the American Association of Variable Star Observers (JAAVSO), 40, 430
- Henden & Munari (2014) Henden, A., & Munari, U. 2014, Contributions of the Astronomical Observatory Skalnate Pleso, 43, 518
- Herbig (1989) Herbig, G. H. 1989, European Southern Observatory Conference and Workshop Proceedings, 33, 233
- Herbig (2008) Herbig, G. H. 2008, AJ, 135, 637
- Herbst & Shevchenko (1999) Herbst, W., & Shevchenko, V. S. 1999, AJ, 118, 1043
- Hillenbrand et al. (2013) Hillenbrand, L. A., Miller, A. A., Covey, K. R., et al. 2013, AJ, 145, 59
- Kóspál et al. (2011) Kóspál, Á., Ábrahám, P., Goto, M., et al. 2011, ApJ, 736, 72
- Kóspál et al. (2013) Kóspál, Á., Ábrahám, P., Acosta-Pulido, J. A., et al. 2013, A&A, 551, A62
- Kóspál et al. (2017) Kóspál, Á., Ábrahám, P., Westhues, C., & Haas, M. 2017, A&A, 597, L10
- Kun et al. (2011) Kun, M., Szegedi-Elek, E., Moór, A., et al. 2011, ApJ, 733, L8
- Ibryamov & Semkov (2017) Ibryamov, S., & Semkov, E. 2017, The Astronomer’s Telegram, No. 10170, 170,
- Itagaki & Yamaoka (2010) Itagaki, K., & Yamaoka, H. 2010, Central Bureau Electronic Telegrams, 2426, 1
- Lorenzetti et al. (2012) Lorenzetti, D., Antoniucci, S., Giannini, T., et al. 2012, ApJ, 749, 188
- Lorenzetti et al. (2009) Lorenzetti, D., Larionov, V. M., Giannini, T., et al. 2009, ApJ, 693, 1056
- Manara et al. (2013) Manara, C. F., Beccari, G., Da Rio, N., et al. 2013, A&A, 558, A114
- Meyer et al. (1997) Meyer, M. R., Calvet, N., & Hillenbrand, L. A. 1997, AJ, 114, 288
- Moody & Stahler (2017) Moody, M. S. L., & Stahler, S. W. 2017, A&A, 600, A133
- Mosoni et al. (2013) Mosoni, L., Sipos, N., Ábrahám, P., et al. 2013, A&A, 552, A62
- Munari (2012) Munari, U. 2012, Journal of the American Association of Variable Star Observers (JAAVSO), 40, 582
- Munari et al. (2017) Munari, U., Traven, G., Dallaporta, S., et al. 2017, The Astronomer’s Telegram, No. 10183, 183,
- Munari et al. (2014) Munari, U., Henden, A., Frigo, A., & Dallaporta, S. 2014a, Journal of Astronomical Data, 20, 4
- Munari et al. (2014) Munari, U., Henden, A., Frigo, A., et al. 2014b, AJ, 148, 81
- Pogge et al. (2010) Pogge, R. W., Atwood, B., Brewer, D. F., et al. 2010, Proc. SPIE, 7735, 77350A
- Sicilia-Aguilar et al. (2012) Sicilia-Aguilar, A., Kóspál, Á., Setiawan, J., et al. 2012, A&A, 544, A93