Product-Sum universality and Rushbrooke inequality in explosive percolation
Abstract
We study explosive percolation (EP) on Erdös-Rényi network for product rule (PR) and sum rule (SR). Initially, it was claimed that EP describes discontinuous phase transition, now it is well-accepted as a probabilistic model for thermal continuous phase transition (CPT). However, no model for CPT is complete unless we know how to relate its observable quantities with those of thermal CPT. To this end, we define entropy, specific heat, re-define susceptibility and show that they behave exactly like their thermal counterparts. We obtain the critical exponents and numerically and find that both PR and SR belong to the same universality class and they obey Rushbrooke inequality.
pacs:
61.43.Hv, 64.60.Ht, 68.03.Fg, 82.70.DdThe notion of percolation is omnipresent in many seemingly disparate natural and man-made systems ref.Stauffer . Examples include spread of forest fire, flow of fluid through porous media, spread of biological and computer viruses etc. ref.saberi ; ref.Newman_virus ; ref.Moore_virus . Besides such direct applications, percolation is best known as a paradigmatic model for phase transition. One of the simplest models for percolation is the classical random percolation (RP) on Erdös-Rényi (ER) network in which one starts with labeled nodes that are initially all isolated ref.erdos . Then at each step a link, say , is picked at random from all the possible pair of links and occupy it to connect nodes and . As the number of occupied links increases from zero we find that clusters, i.e. contiguous nodes connected by occupied links, are formed and on the average grown. In the process, the largest cluster undergoes a transition across from minuscule size () to giant size (). The emergence of such threshold value is found to be accompanied by a sudden change in the order parameter , the ratio of the largest cluster to the network size, such that at and at in the limit . This is reminiscent of the second order or continuous phase transition (CPT).
In 2009, Achlioptas et al. proposed a class of percolation model in which two links are picked randomly instead of one at each step ref.Achlioptas . However, ultimately only one of the links, that results in the smaller clustering, is occupied and the other is discarded for future picking. One of the key features of this rule, which is now known as the Achlioptas process (AP), is that it discourages the growth of the larger clusters and encourages the smaller ones which inevitably delays the transition. Eventually, when it reaches near the critical point it is so unstable that occupation of one or two links triggers an explosion of growth. It leads to the emergence of a giant cluster with a bang and hence it is called “explosive percolation” (EP). Indeed, the corresponding , in contrast to its classical counterpart, undergoes such an abrupt transition that it was at first mistaken as a discontinuity and suggested to exhibit the first order or discontinuous transition. Their results jolted the scientific community through a series of claims, unclaims and counter-claims ref.Friedman ; ref.ziff_1 ; ref.radicchi_1 ; ref.Costa_2 ; ref.souza ; ref.cho_1 ; ref.ara ; ref.da_Costa ; ref.Grassberger ; ref.Bastas . It is now well settled that the explosive percolation transition is actually continuous but with first order like finite-size effects ref.Grassberger ; ref.Bastas ; ref.Riordan ; ref.bastas_review ; ref.Choi .
In general, scientists use theoretical model, just like architects use geometric model before building large expensive structure, because it provides useful insights into the real-world systems. The real systems that percolation represent is complex as it often involves quantum and many particle interaction effects. However, modeling is only useful if we know how to relate its various observable quantities to those of the real-world systems. To this end, Kasteleyn and Fortuin used the mapping of the percolation problem onto the -state Potts model in order to relate its observable to the thermal quantities of the Potts model ref.Kasteleyn . Owing to that mapping we know that is the order parameter, mean cluster size is the susceptibility etc. but not equivalent counterpart of entropy. In thermal CPT, the entropy and the order parameter (OP) complement each other as , that measures the degree of disorder, is maximum where OP is zero and OP, that measures the extent of order, is maximum where is zero. A similar behaviour in percolation is also expected in order to elucidate whether it is also an order-disorder transition or not. Universality is another aspect that we find common in the thermal CPT and in the random percolation. In the case of EP, we are yet to find universality of any type or any kind. Another interesting aspect of thermal CPT is that its critical exponents and obey the Rushbrooke inequality which reduces to equality under static scaling hypothesis ref.Stanley . Whether it holds in explosive percolation or not, is also an interesting issue.
In this article, we investigate EP on the ER networks for product rule (PR) and sum rule (SR) and find their critical exponents numerically. First, we define susceptibility as the ratio of the successive jump of and the magnitude of successive intervals instead of using the mean cluster size as susceptibility. Then we obtain the critical exponents of the correlation length, of , and of . Note that exhibits the expected divergence only if the largest cluster size is excluded from it and even then it gives too large a value of . Realizing these drawbacks, many researchers are already considering alternative definitions ref.radicchi_1 ; ref.ziff_3 ; ref.qian . Second, we define entropy for EP and find that it is continuous across the whole spectrum of the control parameter which clearly reveals that EP transition is indeed continuous in nature. We then define the specific heat as where and find that it diverges with positive critical exponent . The most intriguing and unexpected findings of this work is that PR and SR belong to the same universality class. Besides, we find that the elusive Rushbrooke inequality holds in EP. Recently, using the the same definitions for entropy, specific heat and susceptibility we have shown that the Rushbrooke inequality holds in the random percolation too ref.hassan_didar . Finding that RI also holds in EP on random network provides a clear testament of how robust our results are.
Percolation is all about clusters as every observable quantity of it is related, this way or another, to the clusters by virtue of definition. Initially, all the labeled nodes are considered isolated so that every node is a cluster of its own size. The process starts by picking two distinct links, say and , randomly at each step. To apply the PR, we then calculate the products, and , of the size of the clusters that the two nodes on either side of each link contain. The link with the smaller value of the products and is occupied. On the other hand, if we find then we occupy one of the two links at random with equal probability. In the case of SR, we take the sum and instead of the product and do the rest exactly in the same way as we did for PR. Each time we occupy a link, either the size of an existing cluster grows due to occupation of an inter-cluster link or the cluster size remains the same due to addition of an intra-cluster link. In either case, the growth of large clusters are always disfavoured which is in sharp contrast to its RP counterpart. Thus, the emergence of a giant cluster is considerably slowed down but eventually when it happens, it happens abruptly but without discontinuity.

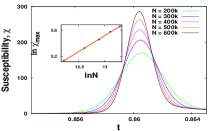
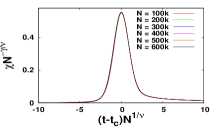
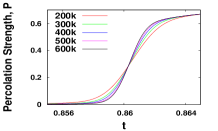
We first investigate not the itself but its successive jump within successive interval . The idea of successive jump size was first introduced by Manna ref.manna . We use it to define susceptibility as
| (1) |
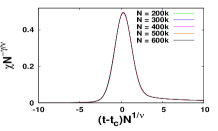
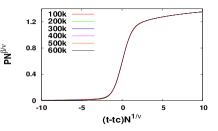
which essentially becomes the derivative of in the limit . In Figs. (1a) and (1b) we show plots of versus for both PR and SR model. According to the finite-size scaling (FSS) hypothesis, the susceptibility at increases following a power-law . In an attempt to verify this we plot vs , see insets of Figs. (1a) and (1b), and find straight lines with slopes for PR and for SR. Following the procedures in Ref. ref.Hassan_Rahman_1 we also get a rough estimate of the exponent for PR and for SR. The FSS theory further suggests that if we now plot vs , all the distinct plots of Figs. (1a) and (1b) should collapse into their respective universal curves. Indeed, by tuning and we find excellent data collapse, see Figs. (1c) and (1d), if we use and for PR and SR respectively. Note that value also affects the data collapse and hence tuning the initial estimates for we get the best data-collapse if we use for PR and for SR. The quality of data collapse itself provides a clear testament to the extent of accuracy of these values. What is most noteworthy, however, is that both PR and SR share the same value for the exponents and . Using now the relation in we find that
| (2) |
where for both PR and SR rules within the acceptable limit of error. We find that the susceptibility now diverges even without the exclusion of the largest cluster and that too with the same .
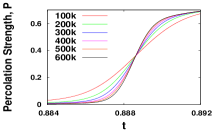
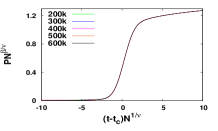
Now, we consider the order parameter itself and plot it as a function of in Figs. (2a) and (2b) for PR and SR respectively. We follow the same standard procedure as in Ref. ref.Hassan_Rahman_1 ; ref.Hassan_Rahman_explosive and find for both the variants. It is well-known that exhibits finite-size scaling. One way of testing it is to plot vs and check if all the distinct curves of vs curves collapse or not. Indeed, Figs. (2c) and (2d) suggest that they all collapse superbly with and values regardless of whether it is PR or SR. Substituting the relation in we get
| (3) |
This is exactly how the order parameter behaves near critical point in the thermal CPT as well. We once again find that both PR and SR rules share the same exponent within the acceptable limits of error. Such unusually low value of compared to that of the RP on ER where is the hallmark of EP transition ref.mori . Note also that Grassberger et al. obtained and for PR on ER ref.Grassberger . Our values are quite close to their values; however little differences are there which marks a significant improvement in the quality of data-collapse.
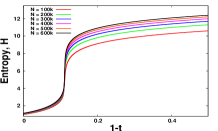
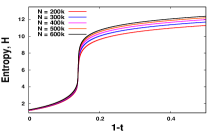
Phase transitions always entail a change in entropy and hence no model for phase transition is complete without a proper definition for it. To this end, we find that the most suitable choice for entropy in percolation is the Shannon entropy which is defined as
| (4) |
where we choose since it merely amounts to a choice of a unit of measure of entropy ref.shannon . Although there is no explicit restriction per se on the choice of there exist some implicit restrictions. The text-book definitions of thermal entropy and the specific heat suggest that the vs plot must always have a sigmoidal shape with positive slope ref.Stanley . Recently, Vieira et al. used the probability , that a node picked at random belongs to a cluster exactly of size , in Eq. (4) to measure Shannon entropy for explosive percolation and found that the entropy increases from zero at to reach its maximum value at followed by sharp decrease above ref.Vieira . We also know that the order parameter is also zero at . It means that the system is ordered and disordered at the same time which is not possible. Besides, the bell-shaped like entropy curve also violates the second law of thermodynamics. The problem lies in the fact that the sum in Eq. (4) is over each individual cluster not over a class of cluster of size and hence one cannot use to measure entropy. Note that the Shannon entropy measures how much information is contained in each cluster like in each message in the information theory. To find the appropriate probability for Eq. (4), we assume that for a given there are distinct and disjoint labeled clusters of size respectively. We then propose a labeled cluster picking probability (CPP) , that a node picked at random belongs to cluster , and assume that it depends on the size of the cluster itself, so that where .
Incorporating in Eq. (4) we obtain entropy for explosive percolation. To visualize we plot it in Figs. (3a) and (3b) as a function of for PR and SR respectively. We observe that the maximum entropy occurs at where which means that every node has the same probability to be picked if we hit one at random. This is exactly like the state of the isolated ideal gas since here too all accessible microstates are equally probable. The state is thus the most confused or disordered state. Now as we lower the value, we see that entropy decreases slowly but as we approach towards we observe a dramatic decrease in entropy. This is because as we approach from higher value we find that many moderately large sized clusters get accumulated as the AP discourages growth of large clusters and encourages the smaller ones. Eventually the crowding of the moderately large clusters reaches a critical state at where addition of a few links triggers the growth of the largest cluster in an explosive fashion. We find that at the entropy is minimally low but the order parameter is maximally high and hence it is clearly the ordered phase. We thus see that at the entropy is maximally high but the order parameter and hence it correspond to the disordered phase. On the other hand at , the order parameter is maximally high and entropy is minimally low. The term percolation therefore refers to the transition from ordered phase characterized by vanishingly small entropy at to disordered phase characterized by at as one tunes the control parameter . We thus find that in percolation too, like in the thermal CPT, entropy and order parameter compliments each other.
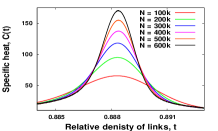
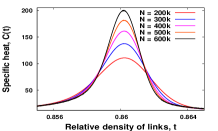

Once we know the entropy, we can find specific heat as we can define it as
| (5) |
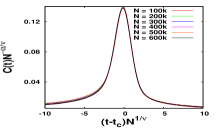
in analogy with the definition of its thermal counterpart. Taking differentiation of from first principles and multiplying that value with the corresponding value of , we can immediately obtain . We then plot in Figs. (4a) and (4b) as a function of for PR and SR respectively. To compute the corresponding critical exponent once again we use the FSS hypothesis and find for both PR and SR. Finally, we plot vs and obtain a perfect data-collapse with and for both PR and SR as shown in Figs. (4c) and (4d). We then use the relation in and immediately find that the specific heat diverges like
| (6) |
where for both PR and SR. The quality of data-collapse is a clear testament of the accuracy of value.
Classifications of any system into universality classes is always an interesting proposition. To this end, finding that PR and SR of explosive percolation belongs to the same universality class is a significant development especially when we know that the most expected site-bond universality breaks down even in the lattice. To check whether the Rushbrooke inequality holds in EP or not, we substitute our values of , and in the Rushbrooke relation and find . Thus, we find that the Rushbrooke inequality not only holds but also its value is close to equality, within the acceptable range of errors. Recently, we applied the same approach to the square and weighted planar stochastic (WPS) lattices where we found that RI holds in RP for both the lattices albeit they belong to different universality classes ref.hassan_didar . Moreover, in both the cases, we find that RI holds almost as an equality like in the thermal CPT. Thus, finding that RI holds for three different universality classes that include a class as exotic as EP provides sufficient confidence in our results. It implies that explosive percolation is indeed a paradigmatic model for continuous phase transition with some unusual finite-size behaviours since we find hysteresis loops in its forward and reverse processes, doublehump in the distributions of the order parameter , which, however, disappears in the thermodynamic limit ref.Grassberger ; ref.Bastas ; ref.Riordan ; ref.bastas_review ; ref.Choi . Besides, we also know that the time difference between the last step for which the largest cluster and the first step for which is not extensive while it is extensive for RP on ER . For all these reasons explosive percolation is indeed a non-trivial paradigmatic model for CPT.
To summarize, we have used our recently defined entropy, specific heat and re-defined susceptibility in explosive percolation on random network. Until now we could only quantify the extent of order in percolation by measuring the order parameter . Thanks to the definition of entropy, we can now quantify the other phase too. It is so high in the phase where that we can regard it as disordered phase. It implies that the high- phase is more disordered, i.e., has a higher symmetry than the low- phase thus revealing that percolation is an order-disorder transition like ferromagnetic transition. We have also shown that the specific heat and susceptibility diverge at the critical point without having to exclude the largest cluster which is in sharp contrast to the mean cluster size which also diverges at the critical point but only if we exclude the largest cluster from it. We obtained the critical exponents , , and numerically and found that their values for PR and SR are the same, revealing that they belong to the same universality class. Such PR-SR universality is highly intriguing and unexpected especially against the background of the breakdown of the usual site-bond universality even in the lattice. We have also shown that the value of the critical exponents , , obey the Rushbrooke inequality. Our work confirms that the explosive percolation model is a truly paradigmatic model for continuous phase transition since we now know that entropy, order parameter, specific heat, susceptibility and their critical exponents behave exactly in the same way as in the thermal CPT.
References
- (1) D. Stauffer and A. Aharony, Introduction to Percolation Theory (Taylor Francis, London, 1994).
- (2) A. A. Saberi, Phys. Rep. 578 1 (2015).
- (3) M.E.J. Newman and D.J. Watts, Phys. Rev. E 60 7332. (1999).
- (4) C. Moore and M.E.J. Newman, Phys. Rev. E 62 7059. (2000).
- (5) P. Erdös, A. Rényi, Publ. Math. Inst. Hungar. Acad. Sci. 5 17 (1960).
- (6) D. Achlioptas, R. M. D’Souza, and J. Spencer, Science 323 1453 (2009).
- (7) E. J. Friedman and A. S. Landsberg, Phys. Rev. Lett. 103 255701 (2010).
- (8) R. M. Ziff, Phys. Rev. Lett. 103 045701 (2009).
- (9) F. Radicchi and S. Fortunato, Phys. Rev. Lett. 103 168701 (2009).
- (10) R. A. da Costa, S. N. Dorogovtsev, A. V. Goltsev, J. F. F. Mendes, Phys. Rev. E 91 042130 (2015).
- (11) R. M. D’Souza and M. Mitzenmacher, Phys. Rev. Lett. 104 195702 (2010).
- (12) Y. S. Cho, J. S. Kim, J. Park, B. Kahng, and D. Kim, Phys. Rev. Lett. 103 135702 (2009).
- (13) N. A. M. Araújo and H. J. Herrmann, Phys. Rev. Lett. 105 035701 (2010).
- (14) R. A. da Costa, S. N. Dorogovtsev, A. V. Goltsev and J. F. F. Mendes, Phys. Rev. Lett. 105 255701 (2010).
- (15) P. Grassberger, C. Christensen, G. Bizhani, S-W Son, and M. Paczuski Phys. Rev. Lett. 106 225701 (2011).
- (16) N. Bastas, K. Kosmidis, and P. Argyrakis, Phys. Rev. E 84 066112 (2011).
- (17) O. Riordan and L. Warnke, Science 333 322 (2011).
- (18) W. Choi, S-H Yook, and Y. Kim, Phys. Rev. E 84 020102(R) (2011).
- (19) N. Bastas, P. Giazitzidis, M. Maragakis, and K. Kosmidis, Physica A, 407 54 (2014).
- (20) P. W. Kasteleyn and C. M. Fortuin, J. Phys. Soc. Japan 26 (Suppl.) ll (1969).
- (21) H. E. Stanley, Introduction to Phase Transitions and Critical Phenomena (Oxford University Press, Oxford and New York 1971).
- (22) R. M. Ziff, Phys. Rev. E 82 051105 (2010).
- (23) J. H. Qian, D. D. Han and Y. G. Ma, Europhys. Lett.100 48006 (2012).
- (24) M. K. Hassan, D. Alam, Z. I. Jitu and M. M. Rahman, arXiv:cond-mat/1703.04893 (to appear as a Rapid Communication in Physical Review E).
- (25) S. S. Manna, Physica A 391 2833 (2012).
- (26) M. K. Hassan and M. M. Rahman, Phys. Rev. E 92 040101(R) (2015); ibid 94 042109 (2016).
- (27) M. M. Rahman and M. K. Hassan, Phys. Rev. E 95 042133 (2017).
- (28) F. Mori and T. Odagaki, J. Phys. Soc. Jpn. 70 2485 (2001).
- (29) C. E. Shannon, Bell System Technical Journal 27 379 (1948).
- (30) T. M. Vieira, G. M. Viswanathan, and L. R. da Silva, Eur. Phys. J. B 88 213 (2015).