Top quark mass studies with at the LHC
Abstract
A precise measurement of the top quark mass, a fundamental parameter of the Standard Model, is among the most important goals of top quark studies at the Large Hadron Collider. Apart from the standard methods, numerous new observables and reconstruction techniques are employed to improve the overall precision and to provide different sensitivities to various systematic uncertainties. Recently, the normalised inverse invariant mass distribution of the system and the leading extra jet not coming from the top quark decays has been proposed for the production process, denoted as . In this paper, a thorough study of different theoretical predictions for this observable, however, with top quark decays included, is carried out. We focus on fixed order NLO QCD calculations for the di-lepton top quark decay channel at the LHC with TeV. First, the impact on the extraction of is investigated and afterwards the associated uncertainties are quantified. In one approach we include all interferences, off-shell effects and non-resonant backgrounds. This is contrasted with a different approach with top quark decays in the narrow width approximation. In the latter case, two cases are employed: NLO QCD corrections to the production process with leading order decays and the more sophisticated case with QCD corrections and jet radiation present also in top quark decays. The top quark mass sensitivity of is investigated and compared to other observables: the invariant mass of the top anti-top pair, the minimal invariant mass of the -jet and a charged lepton as well as the total transverse momentum of the system. Once top quark decays are included the invariant mass of the system shows better sensitivity to the top quark mass extraction and smaller dependence on the off-shell effects and non-resonant contributions of the top quark and the gauge boson than the observable.
Keywords:
NLO Computations, QCD Phenomenology, Heavy Quark Physics1 Introduction
The top quark is the most massive of all observed elementary particles. As a result it has a very short lifetime and decays before hadronic bound states can be formed. With a mass of the order of the electroweak scale, the top quark decays through the weak interaction into a boson and a down-type quark, most frequently into the bottom quark. This gives us an opportunity to study the unstable top quark via its decay products, i.e charged leptons, bottom- and light-jets as well as missing transverse momentum. The top quark Yukawa coupling to the Higgs boson, expressed as , is of the order of unity. This alone makes the top quark unique among the fermions and its closer relation to physics Beyond the Standard Model (BSM) is anticipated. In the Standard Model (SM) of particle physics the top quark coupling to the Higgs boson is controlled by the Yukawa sector of the model. Moreover, its couplings to the other particles are fixed through the gauge structure of the SM. On the other hand, the top quark mass is a fundamental parameter of QCD, which furthermore influences electroweak processes through virtual effects. Thus, the numerical value of the top quark mass affects theory predictions of cross sections and various differential distributions that are indispensable for example in studying the Higgs boson properties or in searching for BSM effects. Additionally, the stability of the electroweak vacuum depends crucially on the precise numerical value of , see e.g. Ref. Degrassi:2012ry ; Alekhin:2012py . Therefore, is a crucial input for the self-consistency of the SM.
The mass of the top quark can be measured in a variety of ways. However, the most precise experimental determinations are based on the direct kinematic reconstruction of the measured top quark decay products. Various differential distributions sensitive to are employed to perform multi-observable analyses. To this end, differential observables inferred from data are typically normalised to the inclusive cross section and compared to theoretical predictions generated with different top quark masses. The current standard for the latter comprises next-to-leading-order (NLO) QCD corrections to the production process matched to parton shower (PS) Monte Carlo (MC) programs, see e.g. Ref. Frixione:2003ei ; Frixione:2007nw . Only recently NLO+PS matching techniques that deal with radiation from top quark decays and which allow for a consistent treatment of top quark resonances have been introduced in Ref. Campbell:2014kua ; Jezo:2015aia ; Jezo:2016ujg . Apart from parton shower effects, non-perturbative physics must also be incorporated into measurements. Here, choices must be made for example on the proton parton distribution functions (PDFs), the hadronisation model, the underlying event, the modelling of colour re-connection and the description of additional interactions accompanying the hard scattering process, the so-called pile-up. Even though the definition and implementation of the top quark mass in NLO+PS MC tools is based on the on-shell renormalisation scheme of at one loop and it is identical to what is used in parton-level calculations, above mentioned effects play an important role as they enter in the relation between and physical observables. The top quark mass can also be extracted indirectly from the inclusive total cross section for the top quark pair production process. However, even the total cross section, , is not free from uncertainties due to the above mentioned non perturbative effects. Due to the extrapolation of the fiducial cross section to the full phase space the measured depends on hadronisation effects as it relies on the MC modelling of these phenomena. The dependence on non-perturbative effects is smaller than for exclusive observables, but, unfortunately, top quark mass determinations based on the mass dependence of the inclusive production cross section are less precise.
Since the discovery of the top quark, direct measurements of production have already been made at five different center-of-mass system energies, two at the Tevatron and three at the LHC. The top-quark mass has been measured in various decay channels, i.e. the +jets, the di-lepton, and the all-jets channel by all four experiments: CDF, D0, ALTAS and CMS. A combination of Tevatron and LHC measurements has been performed in 2014 and resulted in
| (1) |
with a total uncertainty of GeV. The latest and most precise combinations of various measurements presented separately by ATLAS and CMS collaborations, from June 2016 and September 2015 respectively, can be summarised as follows
| (2) |
with a total uncertainty of GeV (ATLAS) and GeV (CMS). The world’s best measurements by the ATLAS and CMS collaborations are in good agreement with the 2014 world average. These results can be further compared to extracted from the inclusive top quark pair production cross-section at and TeV. Using the expected dependence of the cross section on the top quark mass and comparing it to theoretical predictions at the next-to-next-to-leading order level including the resummation of next-to-next-to-leading logarithmic soft gluon effects (NNLO+NNLL) Czakon:2013goa the following values of have been determined
| (3) |
Predictions for production at NNLO+NNLL also employ the on-shell scheme for mass renormalisation since the scheme is commonly used for calculations of perturbative higher order predictions in top quark physics. However, the top quark pole mass, , has an uncertainty of its own, which is of the order of . For example, the intrinsic uncertainty on the definition due to renormalons has been recently estimated to be of the order of MeV Beneke:2016cbu ; Hoang:2017btd . On the experimental side, the main systematic uncertainties contributing to the top quark mass measurements typically originate from the understanding of the jet energy scale for light-quark and -quark originated jets and from modelling of the performance of the -tagging algorithms. Thus, various alternative methods to extract have been proposed to give a further insight by providing different sensitivities to various systematic uncertainties. Such methods, which can also help to improve the overall precision, comprise either new observables or new reconstruction techniques, see e.g. Ref. Biswas:2010sa ; Heinrich:2013qaa ; Frixione:2014ala ; Agashe:2016bok ; Heinrich:2017bqp ; Corcella:2017rpt ; Ravasio:2018lzi for production. Among others, a novel method to determine in the production process has been proposed in Ref. Alioli:2013mxa ; Fuster:2017rev for on-shell top quarks. It uses the normalised differential cross section as a function of the invariant mass of the system and the leading extra jet not coming from the top quark decays. To be more precise it is defined according to
| (4) |
where is a parameter that is of the order of the top quark mass and is the invariant mass of the system. In Ref. Alioli:2013mxa ; Fuster:2017rev NLO QCD corrections to on-shell production are matched with parton shower programs that are responsible for top quark decays, shower effects and non-perturbative physics. Since additional radiation depends on the mass of the top quark, the distribution should impact the extraction differently than for example the invariant mass of the top anti-top pair alone. As a consequence it should be studied in the context of a precise determination of the top quark mass. Indeed, the method, has already been applied by ATLAS and CMS experimental groups Aad:2015waa ; CMS:2016khu . The measured differential cross sections have been compared to the predicted cross sections for each bin of the observable for the full phase-space using different top quark masses. In the end the most probable top quark mass has been extracted yielding
| (5) |
In this paper we investigate the sensitivity of the observable even further by including NLO QCD corrections also in top quark decays. The main goal is to study the impact of top quark decay modelling on the extraction of the top quark mass in the di-lepton top quark decay channel. To this end we concentrate on fixed order NLO QCD predictions, which rigorously allows us to define the top quark pole mass as the input parameter. We compare three distinct theoretical predictions for the process at the NLO level in QCD. First a complete description of the final state as explained in Ref. Bevilacqua:2015qha ; Bevilacqua:2016jfk is employed, which takes into account all possible contributions, i.e. double (top quark), single (top quark) and non (top quark) resonant contributions together with their interferences and off-shell effects. Off-shell effects and non-resonant contributions due to the gauge boson are also properly taken into account. From the quantum field theory point of view this is the most comprehensive description of the production process at NLO QCD because all effects that are perturbatively calculable at are accounted for. We dub this approach the Full approach. As a second case, we consider the narrow width approximation (NWA) description for top quarks and gauge bosons Melnikov:2011qx , with the following decay chains and . Thus, NLO QCD corrections to top quark pair production with a hard jet are incorporated together with QCD radiative corrections to top quark decays including also the possibility that this hard jet is emitted in the decay stage. Even though and decays are treated in the NWA, NLO spin correlations are retained throughout the entire decay chain. This approach is dubbed NWA. Finally, mostly for comparisons, we employ calculations from Ref. Melnikov:2010iu , where the NLO QCD corrections to on-shell production are provided, however, top quark decays are included only at the leading order (LO) in perturbative QCD. Thus, the following decay chain is investigated , hence spin correlations are only contained at the LO level. This third approach is dubbed NWAProd.. At the end of the paper we are going to compare the normalised differential distribution to other observables that are commonly used in the top quark mass measurements, namely the invariant mass of the system, , and the (minimal) invariant mass of the charged lepton and the -jet, . We shall also present results for the total transverse momentum of the system, , owing to its similar sensitivity to as observed in the case of .
The paper is organised as follows. The general setup of our analysis is described in Section 2. In Section 3 we depict the main observable and discuss the details of methods used in the top quark mass extraction. In Section 4 we present our results on the extraction and assess theoretical uncertainties stemming from the scale dependence and various assumptions that enter into the parameterisation of the PDFs. For the latter case we follow PDF4LHC recommendations for LHC Run II Butterworth:2015oua by employing CT14, MMHT14 and NNPDF3 PDF sets. Results for a slightly modified version of are discussed in Section 5. In Section 6 a comparison between and other observables, that are also sensitive to , is performed. Following our conclusions that are given in Section 7, we include an appendix that presents the comparison between Full, NWA and NWAProd. obtained using a fixed scale choice, for several observables.
2 Setup of the Analysis
Numerical results with complete top quark and gauge boson off-shell effects and non-resonant backgrounds included, which are the basis for our top quark mass extraction studies, are obtained with the help of the Helac-Nlo Monte Carlo program Bevilacqua:2011xh , that comprises Helac-Dipoles Czakon:2009ss ; Bevilacqua:2013iha and Helac-1Loop vanHameren:2009dr . Theoretical aspects related to the complex mass scheme introduced in our calculations are explained in details in Ref. Bevilacqua:2010qb . On the other hand, a comprehensive description of NLO calculations in the NWA for the top quarks is given in Ref. Melnikov:2009dn . We, therefore, do not repeat these details here, but rather refer interested readers to our earlier publications. We consider the process at for the LHC Run II energy of = 13 TeV. Throughout, for the masses and widths of the and gauge bosons we use the following values
| (6) |
where, in the total decay rates for the and gauge bosons, the NLO QCD corrections to and have been included. Further electroweak parameters such as the electroweak coupling and the weak mixing angle are computed in the so called scheme with the Fermi constant through the following formulae
| (7) |
The mass and the width of the top quark are set to
| (8) |
where refers to the top quark width with gauge boson off-shell effects included and to the top quark width with an on-shell gauge boson as used in the NWA Jezabek:1988iv ; Denner:2012yc . Both values are derived for massless quarks since all leptons and partons are considered to be massless. The normalised differential distribution and other observables are also evaluated with different top quark masses to be used for the fitting procedure. Generally we shall use the following five values of : GeV, GeV, GeV (the default value), GeV and GeV. This corresponds to the following spread GeV in steps of GeV. For completeness, corresponding top quark decay widths are shown in Table 1.
The value of needed for and is obtained from via LHAPDF Buckley:2014ana . In general, the running of the strong coupling constant with two-loop accuracy is provided by the LHAPDF library and the number of active flavours is set to . We employ the CT14nlo Dulat:2015mca , NNPDF30-nlo-as-0118 Ball:2014uwa and MMHT2014nlo68clas118 Harland-Lang:2014zoa PDF sets that we dubbed as CT14, NNPDF3 and MMHT14. Suppressed contributions from bottom quarks in PDFs are not included. All final-state partons with pseudo-rapidity are recombined into jets with a separation parameter in the rapidity-azimuthal-angle plane via the IR-safe anti jet algorithm Cacciari:2008gp . The value of the jet radius is set to . When merging particles during the clustering procedure one must specify how to combine the momenta. We use the simplest procedure, currently used by the LHC experiments, and add the four-vectors of combined partons (the so called -scheme). Finally, we require exactly two -jets, at least one light jet, two charged leptons and missing transverse momentum, . These final states have to fulfil the following criteria
| (9) |
where stands for and whereas corresponds to light- and -jets. For renormalisation and factorisation scales, and , three cases are considered. Specifically, we use a fixed scale and two dynamical ones and , where the transverse energy of the system and the total transverse momentum of the system are defined according to
| (10) |
The dynamical scales are evaluated using the momenta after the application of the jet-algorithm. Thus, and are the -jets and is the light (hard) jet. In the case of two resolved jets the jet with the highest transverse momentum is chosen. Additionally, momenta of and are reconstructed from their decay products, i.e. and where comes from the -quark and from anti- quark.
3 Description of the Observable and the Methods Used
We start with the observable defined as normalised differential distribution of the jet cross section with respect to the inverse invariant mass of the final state, , that can be written in the following form
| (11) |
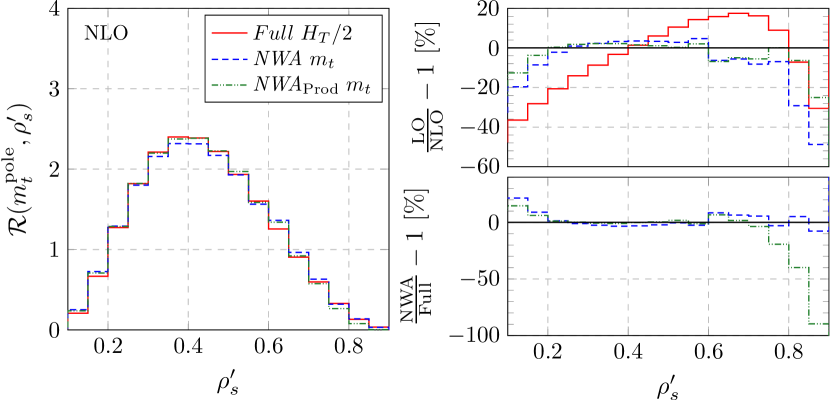
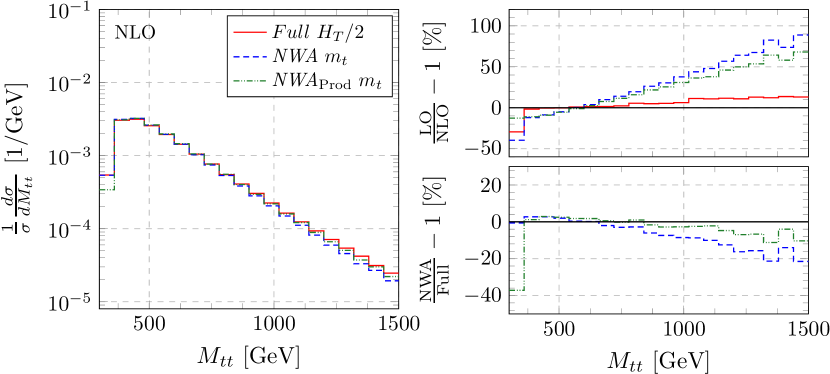
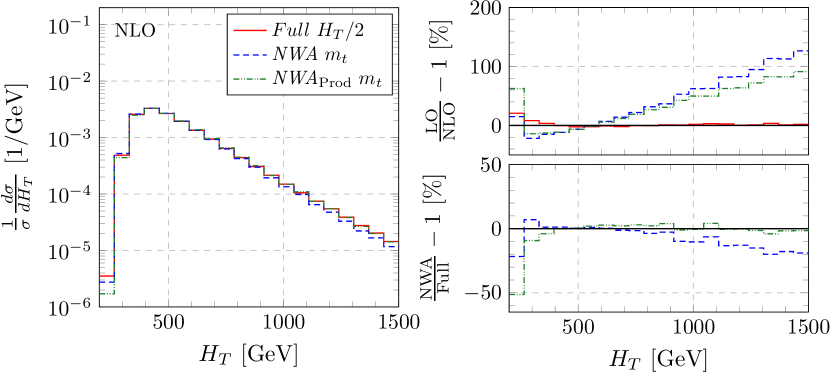
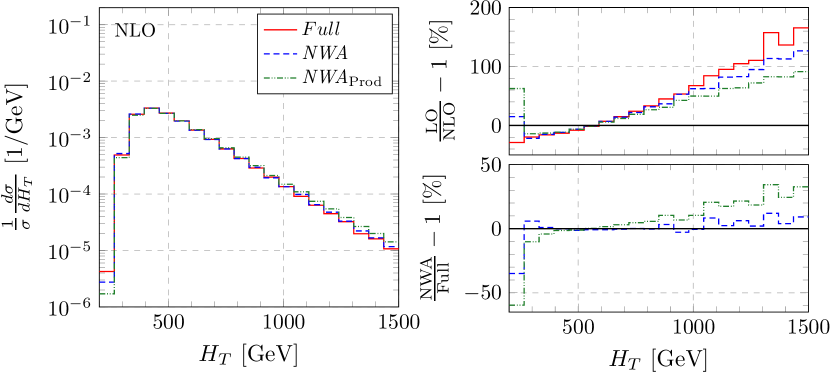
where GeV is a scale of the order of . We note here that top quarks are reconstructed from their decay products assuming exact gauge boson reconstruction and taking as the leading light jet irrespectively of its origin (production or decay). This corresponds to the invariant mass of the system, , which for brevity we dub . In Figure 1, we present the NLO predictions for considering the following three cases, namely Full (red solid line), NWA (blue dashed line) and NWAProd. (green dotted-dashed line) for that is a scale choice commonly used for the production process at the LHC and with the CT14 PDF set. Also shown are the relative NLO QCD corrections (upper right panel) and the relative deviation of the NWA results from the full calculation (lower right panel). Both are given in percent. To be more precise, in the former and the latter case shape differences are shown, since we consider normalised differential cross sections. For completeness in Table 2 integrated NLO cross sections are provided. Combined finite top quark and gauge boson width effects change the NLO cross section by , which is consistent with the expected uncertainty of the NWA, that is of the order of .
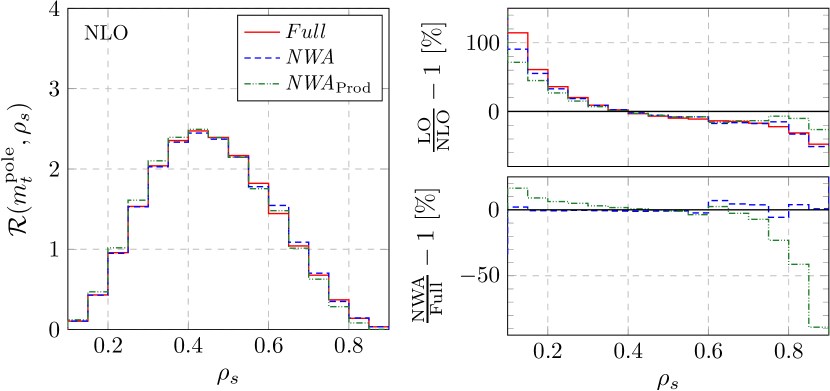
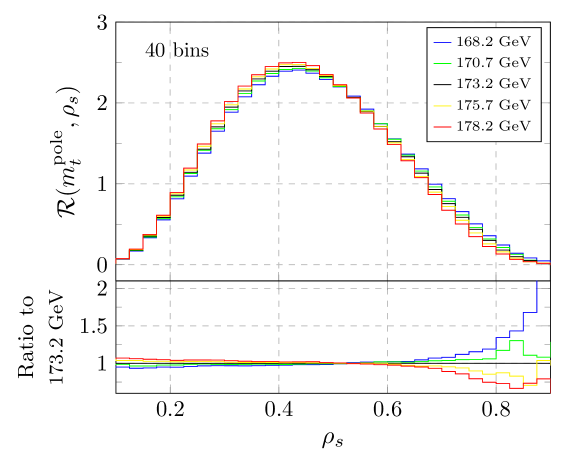
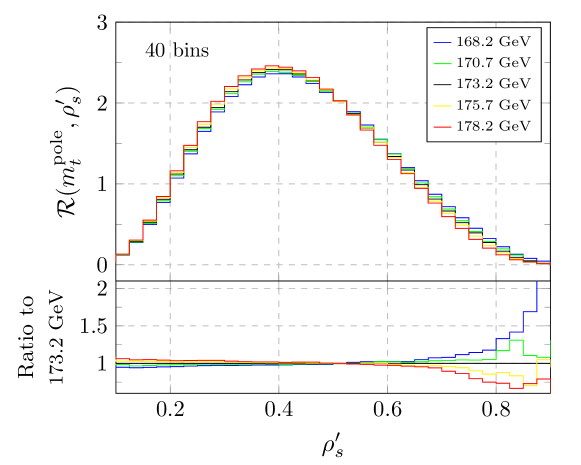
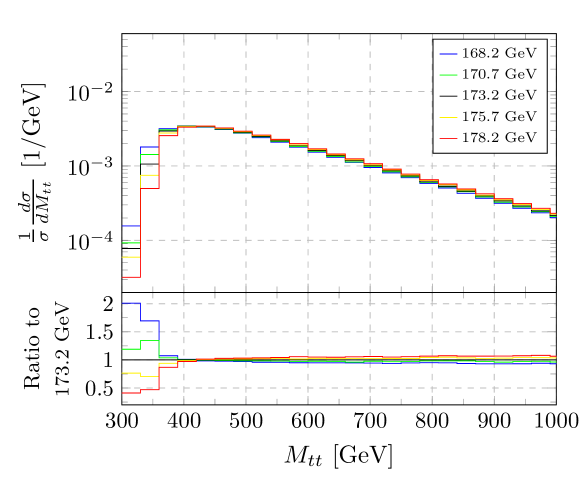
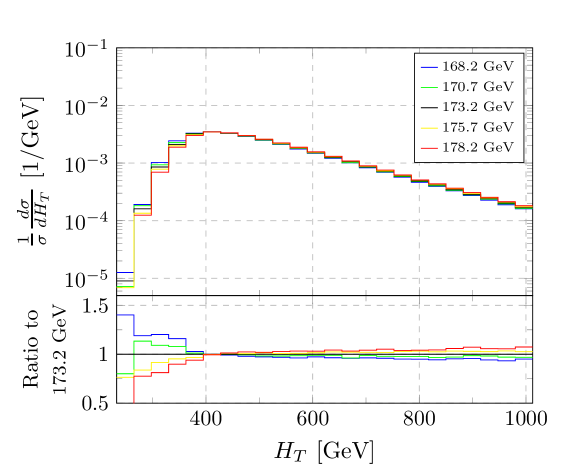
In Figure 2, we show as given by the best theoretical predictions (Full ) with for five different top quark masses, that is GeV. We also plot the ratio to the result with the default value of the top quark mass, i.e. GeV. To obtain these results the CT14 PDF set has been used, however, any of the PDF sets recommended by the PDF4LHC group can be employed here. A significant mass dependence can be observed for the regions and . The regions that are the most sensitive to the top quark mass extraction are above . The latter finding is a consequence of the fact that, the tail of the distribution is very sensitive to the position of the threshold, which in turn is sensitive to . On the other hand, the crossing of various curves that happens around marks a point where the normalised distribution is essentially insensitive to the top quark mass. We can observe from Figure 1 that in the most sensitive region deviations of NWA from the Full case are below . On the contrary, substantial differences, up to even , are visible for NWAProd. in that region. These differences should have a considerable impact on the extraction of . The comparison of NWA and NWAProd shows that in the region (close to production threshold) more than of the events originate from the radiative treatment of top quark decays. Conversely, in the region around this treatment leads to negative corrections with respect to the approximation where top quarks do not radiate hard jets in the decay stage. The correct perturbative description of this observable, therefore, requires hard jet emission in production and decay (and their mixed contributions). Note here that in Alioli:2013mxa ; Fuster:2017rev jet radiation by top quark decays is not included. Additionally, in the most sensitive region, sizeable NLO QCD corrections (shape differences), of the order of , are obtained for Full and NWA theoretical predictions. In the case of NWAProd. they are around . The dominant source of the large factor is final state radiation. Nevertheless, in each case differential factors are indeed far from constant. Thus, LO calculations together with a suitably chosen global -factor can not be applied to obtain results that well approximate the full NLO QCD calculation. As a consequence, great caution has to be taken for merging LO samples with parton shower programs to obtain realistic hadronic events, directly comparable with the experimental data. Instead, predictions with NLO QCD corrections included should be used in studies where the shape of the observable is important.
| Full | Full | NWA | NWAProd. | |||
| [fb] | 537.2 | 538.6 | 527.1 | 656.1 |
| 5 equal size bins | ATLAS binning | CMS binning |
|---|---|---|
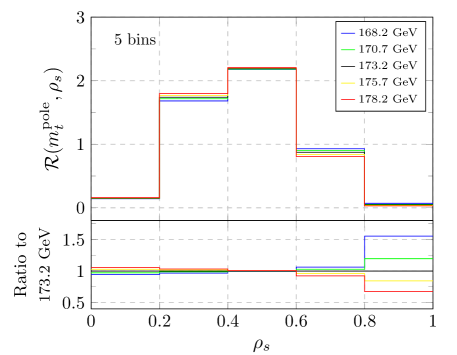
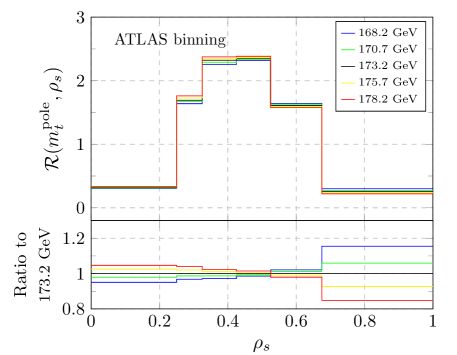
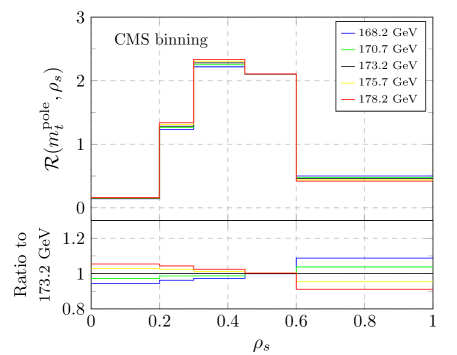
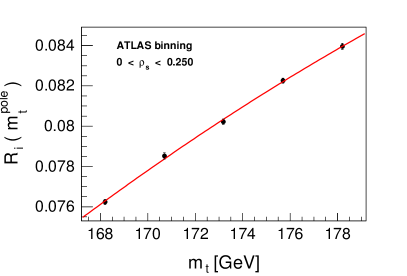
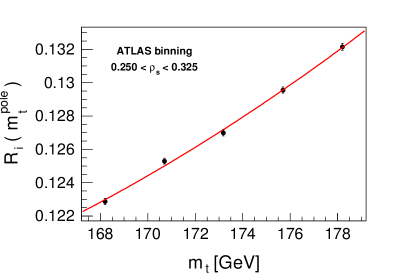
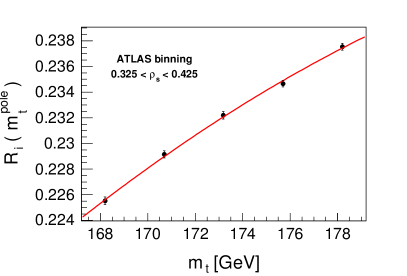
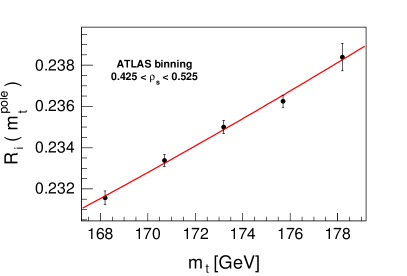
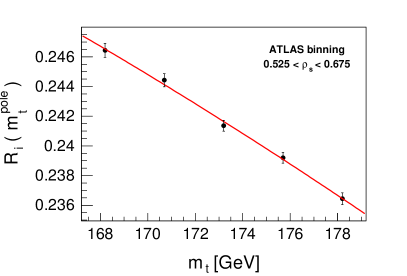
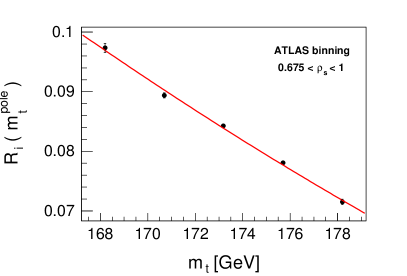
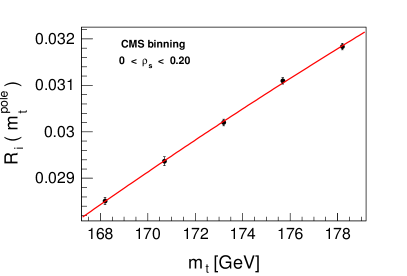
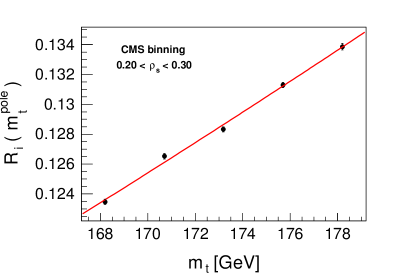
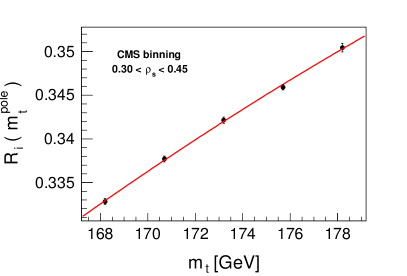
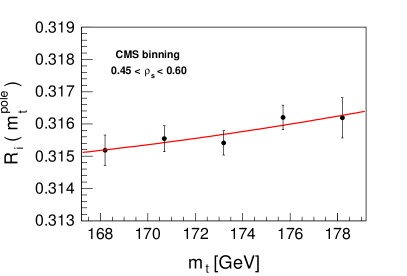
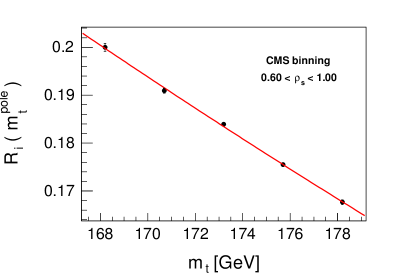
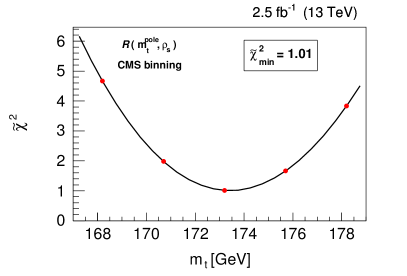
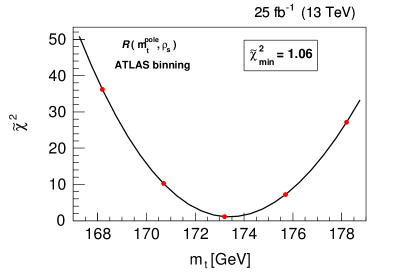
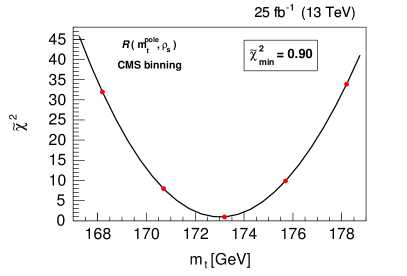
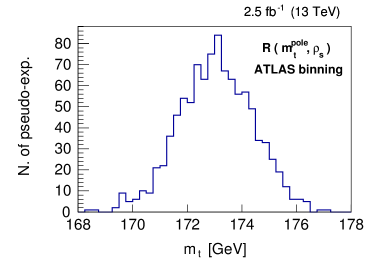


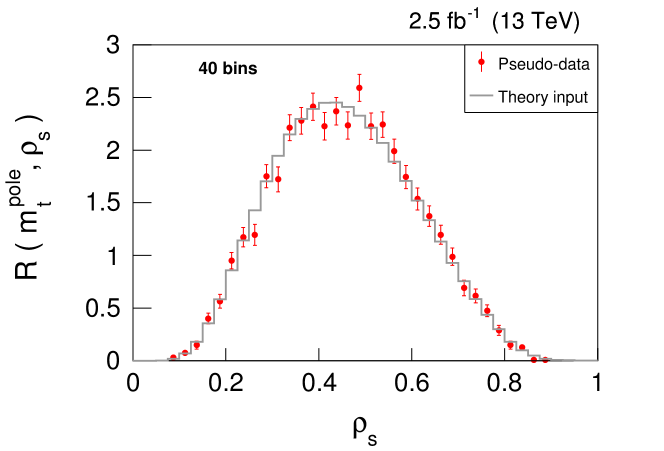
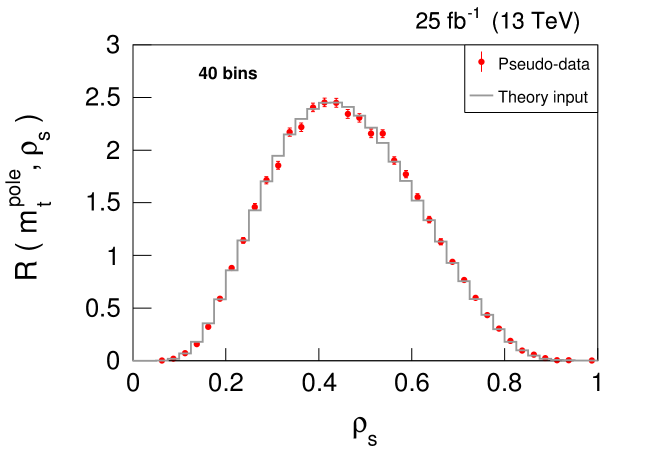
In the next step, the differential distributions shall be used to obtain the top quark mass. To this end a set of pseudo-data is compared to as generated with five different top quark masses and with three different theoretical descriptions of the production process. The pseudo-data set is generated randomly according to the best theoretical prediction at hand, i.e. the Full prediction at NLO in QCD as generated with GeV and . Unless explicitly mentioned this particular setup with the CT14 PDF set will always be employed for the generation of the pseudo-data sets for all considered observables. For completeness, in Figure 3 the normalised observable is plotted again, however, this time the Full case (red solid line) is shown for . When comparing the differential factor for the Full case in Figure 1 and Figure 3 we find that the large corrections in the region are removed. The effect can be attributed to the scale choice made. The kinematic tail of only shows perturbative convergence when dynamic scales are employed, and for the observable the high energy kinematic tail corresponds to low values of . Thus, in addition to differences for large values of present in Figure 1, there are now only differences up to at low values of . Since this region is sensitive to the top quark mass we expect to see an impact on . Moreover, even though we have only simulated decays of the weak bosons to different lepton generations, i.e. omitting same generation lepton interference effects as occurring in we adjust the counting factor to correspond to the production of all combinations of charged leptons of the first two generations. The interference effects can be safely neglected because they are at the per-mille level for our inclusive selection cuts as has been directly checked using LO results. The complete cross section with is, thus, obtained by multiplying the result for with a lepton flavour factor of . In this way, two cases of integrated luminosity and , that we shall consider in the following, correspond, assuming perfect detector efficiency, approximately to and events respectively. Errors on the pseudo-data are calculated according to the Bernoulli distribution. Notice that the theoretical predictions are calculated with such high statistics that the Monte Carlo errors in each bin are negligible compared to the errors of the pseudo-data samples with the chosen luminosities. Examples of the pseudo-data sets for both cases, fb-1 and fb-1, are shown in Figure 4. We shall consider various choices for the number of bins and the bin size for the observable to check whether there is any effect on . More precisely, we consider and bins of equal size as well as the bin intervals as proposed by ATLAS Aad:2015waa and CMS CMS:2016khu collaborations in their studies at the LHC with and TeV using the jets and the di-lepton top quark decay channels respectively. The latter three cases are summarised in Table 3. In Figure 5, templates for the Full case for five different top quark masses with the different bin size are given assuming and the CT14 set for PDFs. To emphasise the regions with the largest sensitivity to the top quark mass the ratio to the result with the default value of the top quark mass, 173.2 GeV, is also shown. The top quark mass is determined by a comparison of the pseudo-data with the theoretical predictions for different values of in individual bins of the normalised distribution. The most probable value of the top quark mass is extracted by means of the distribution for each bin . To be more precise, for each bin the predicted theoretical values (cross sections) for different are fitted using a second order polynomial function in order to obtain a continuous distribution as a function of the top quark mass. Example of such functions for the ATLAS and CMS intervals are shown in Figure 6 and Figure 7, where is defined as
| (12) |
with
| (13) |
Afterwards the distribution is constructed according to the following formula
| (14) |
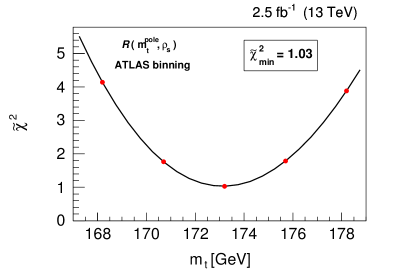
where represents the fit to the given theoretical predictions in the bin , is the number of the selected pseudo-data events in that bin and stands for statistical uncertainty of the pseudo-data in the bin . The distribution does not take into account the theoretical uncertainties stemming from the scale variation and from the PDF uncertainties, which are going to be treated as external variations as described below. The global is calculated by simply summing all bins since individual bins are not correlated
| (15) |
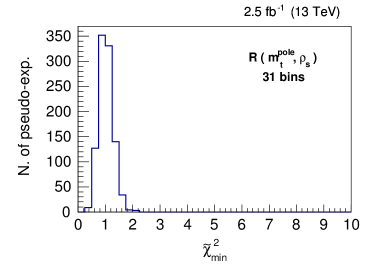
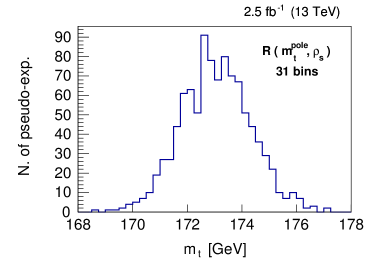
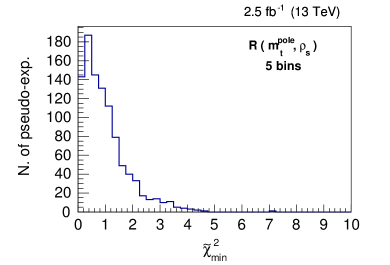
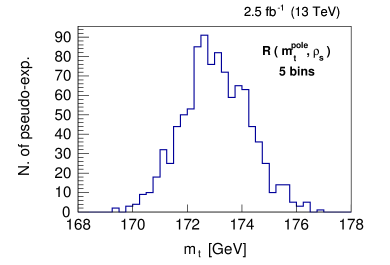
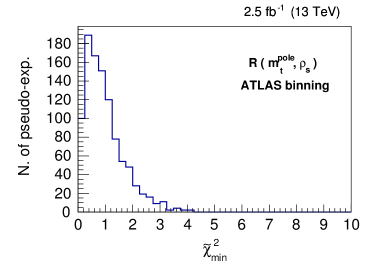
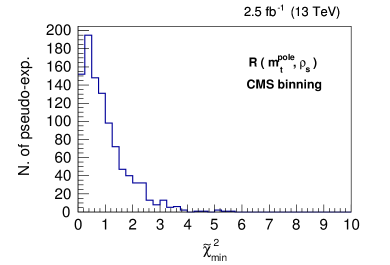
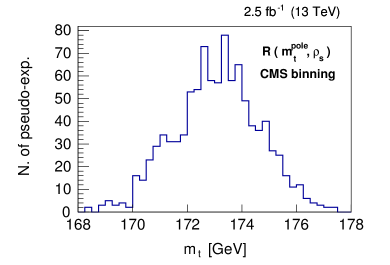
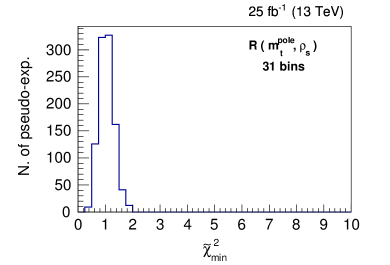
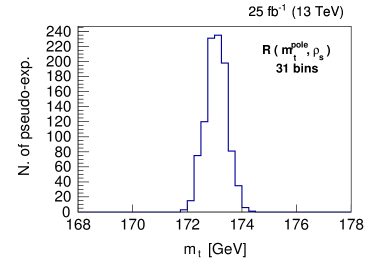
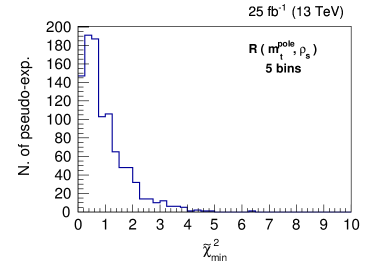
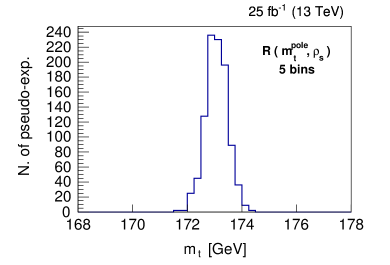
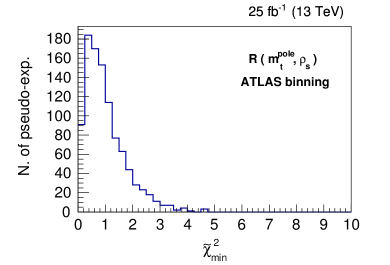
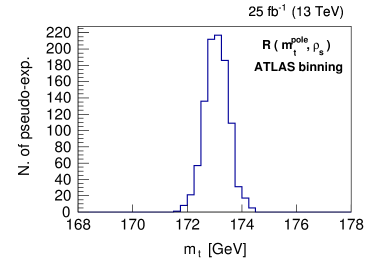
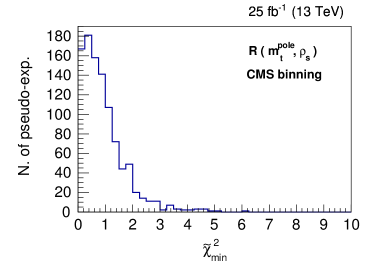
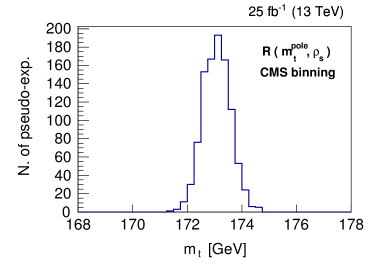
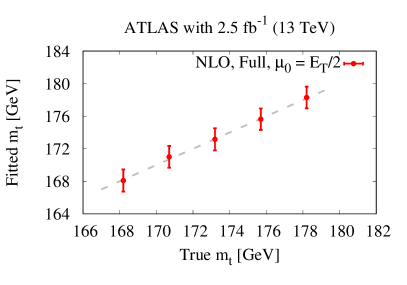
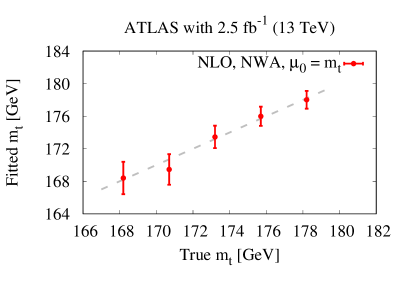
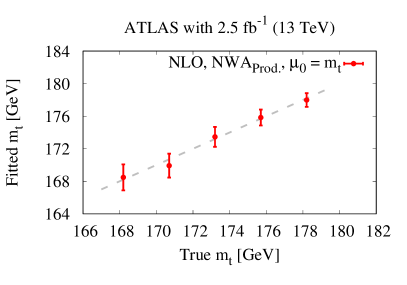
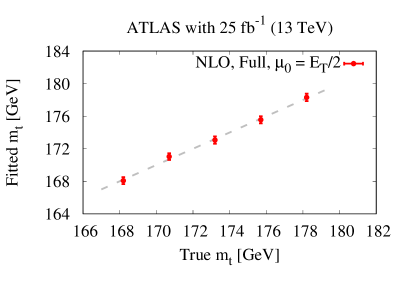
where is the number of bins. The number of degrees of freedom is reduced since one degree of freedom is used by the normalisation of the theoretical distributions. As usual we expect that the numerator of each term will be of the order of , so that each term in the sum will be of the order of unity. Hence a sample value of should be approximately equal to . If this is the case, we shall conclude that our pseudo-data are well described by the values we have chosen for the functions. If our sample value of turns out to be much larger than we may conclude the opposite. The resulting representative distributions with the binning as proposed by the ATLAS and the CMS collaborations for both cases of the integrated luminosity, i.e. fb-1 and fb-1, are shown in Figure 8. The position of the minimum of the distribution is taken as the extracted top quark mass value, . The statistical uncertainty on the top quark mass is calculated in the standard way, i.e as the deviation from the minimum by applying the variation. The sensitivity to the theoretical assumptions and their uncertainties is assessed by using one thousand pseudo-data sets. Afterwards, the averaged and are inferred and is taken as deviation from the averaged by applying C.L. to the following (sorted) spread , where counts the pseudo-experiments. Distributions of the minimum and of the corresponding top quark mass from the 1000 pseudo-experiments are presented in Figure 9 and Figure 10. Results are shown for fb-1 and fb-1 respectively, and for the Full theory with and the CT14 PDF set. For a given luminosity, a higher number of bins corresponds to the better top quark mass resolution and to a substantial decrease of the spread of the values. Once the luminosity is increased, see Figure 10, the top quark mass resolution is also improved as of course anticipated. The improved resolution can be used to make a more accurate determination of the top quark mass.
Theoretical uncertainties stemming from the scale variation and various PDF parameterisations are included in the following manner. For each source of uncertainty the normalised differential distribution with various top quark masses are prepared replacing old template distributions with default setup, i.e. with the and the CT14 PDF set. Thus, for each top quark mass value considered we generate the following additional normalised distributions
| (16) |
For each case, the distribution is calculated and the corresponding top quark mass is inferred. The difference between the central values of the new extracted top quark masses and as obtained from the default case, , is taken as the systematic uncertainty. To be more precise, the theoretical uncertainties are estimated according to the following formulae
| (17) |
| (18) |
To be more conservative the highest value from the two obtained is chosen and symmetrisation is not utilised. Let us note that the simultaneous variation of the renormalisation and factorisation scales up and down by a factor of 2 around the central value is motivated by our previous findings. In Ref. Bevilacqua:2016jfk we have shown that the scale variation for the process under consideration is fully driven by the changes in independently of the scale choice. Let us additionally add that scale variations are applied to the numerator and denominator of the normalised distributions in a correlated way.
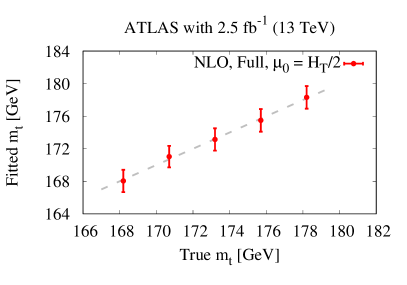
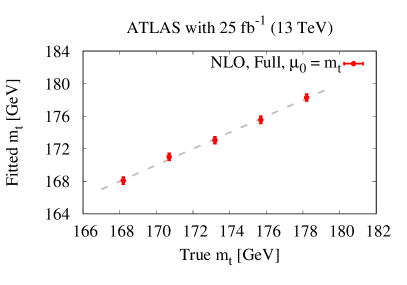
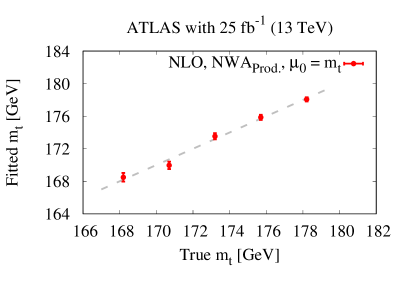
At last, possible biases on the extraction have also been examined by employing all theoretical descriptions to obtain the pseudo-data sets. Thus, the Full case for three different scale choices , and as well as NWA and NWAProd. for have been used not only as templates but also for the pseudo-data generation. In the end, the value of the top quark mass obtained from the global distribution has been compared to the top quark mass of the theoretical sample used as an input. The final results, assuming the ATLAS binning, are presented in Figure 11 and Figure 12 separately for fb-1 and fb-1. A good agreement within the corresponding statistical errors has been found for each top quark mass, for all theoretical predictions and for both luminosity cases. Neither a favoured value of the top quark mass nor a bias towards a higher or a lower has been observed. Thus, we can conclude that the method used is indeed unbiased.
4 Numerical Results for Based on the Normalised Distribution
| Theory, NLO QCD | Averaged | Probability | ||
|---|---|---|---|---|
| CT14 PDF | [GeV] | p-value | [GeV] | |
| 31 bins | ||||
| Full, | 173.38 1.34 | 1.04 | 0.40 (0.8) | |
| Full, | 172.84 1.33 | 1.05 | 0.39 (0.9) | |
| Full, | 174.11 1.39 | 1.07 | 0.37 (0.9) | |
| NWA, | 175.70 0.96 | 1.17 | 0.24 (1.2) | |
| NWAProd., | 169.93 0.98 | 1.20 | 0.20 (1.3) | |
| 5 bins | ||||
| Full, | 173.15 1.32 | 0.93 | 0.44 (0.8) | |
| Full, | 172.55 1.18 | 1.07 | 0.37 (0.9) | |
| Full, | 173.92 1.38 | 1.48 | 0.20 (1.3) | |
| NWA, | 175.54 0.97 | 1.38 | 0.24 (1.2) | 2.34 |
| NWAProd., | 169.37 1.43 | 1.16 | 0.33 (1.0) | 3.83 |
| ATLAS binning | ||||
| Full, | 173.05 1.31 | 0.99 | 0.42 (0.8) | |
| Full, | 172.19 1.34 | 1.05 | 0.39 (0.9) | |
| Full, | 173.86 1.39 | 1.42 | 0.21 (1.2) | |
| NWA, | 175.22 1.15 | 1.38 | 0.23 (1.2) | |
| NWAProd., | 169.39 1.46 | 1.12 | 0.35 (0.9) | |
| CMS binning | ||||
| Full, | 173.09 1.53 | 0.94 | 0.44 (0.8) | |
| Full, | 172.20 1.54 | 0.96 | 0.43 (0.8) | |
| Full, | 173.94 1.49 | 1.42 | 0.22 (1.2) | |
| NWA, | 175.66 1.10 | 1.42 | 0.22 (1.2) | |
| NWAProd., | 169.96 1.80 | 1.00 | 0.41 (0.8) |
| Theory, NLO QCD | Averaged | Probability | ||
|---|---|---|---|---|
| CT14 PDF | [GeV] | p-value | [GeV] | |
| 31 bins | ||||
| Full, | 173.09 0.42 | 1.04 | 0.41 (0.8) | |
| Full, | 172.45 0.39 | 1.12 | 0.30 (1.0) | |
| Full, | 173.76 0.40 | 1.87 | 0.003 (3.0) | |
| NWA, | 175.65 0.31 | 2.99 | (5.4) | |
| NWAProd., | 169.59 0.30 | 3.10 | (5.6) | |
| 5 bins | ||||
| Full, | 173.08 0.40 | 0.94 | 0.44 (0.8) | |
| Full, | 172.48 0.38 | 1.58 | 0.18 (1.3) | |
| Full, | 173.75 0.40 | 6.76 | (4.3) | |
| NWA, | 175.49 0.30 | 5.31 | (3.7) | |
| NWAProd., | 169.39 0.47 | 3.42 | (2.6) | 3.81 |
| ATLAS binning | ||||
| Full, | 173.06 0.44 | 0.97 | 0.44 (0.8) | |
| Full, | 172.36 0.44 | 1.38 | 0.23 (1.2) | |
| Full, | 173.84 0.42 | 5.12 | (3.9) | |
| NWA, | 175.23 0.37 | 5.28 | (4.0) | |
| NWAProd., | 169.43 0.50 | 2.61 | 0.02 (2.3) | |
| CMS binning | ||||
| Full, | 173.09 0.50 | 0.96 | 0.43 (0.8) | |
| Full, | 172.22 0.48 | 1.32 | 0.26 (1.1) | |
| Full, | 174.02 0.46 | 6.57 | (4.2) | |
| NWA, | 175.74 0.34 | 6.00 | (3.9) | |
| NWAProd., | 170.22 0.53 | 2.19 | 0.07 (1.8) |
Our findings for the top quark mass, as determined from the normalised distribution using the methods described in the previous section, are summarised in Table 4 and Table 5. They are obtained for the integrated luminosity of fb-1 and fb-1 at the LHC with TeV. We show the mean value of the top quark mass as collected from the 1000 pseudo-experiments, , the C.L. (1) statistical error on the top quark mass, , and the averaged minimal . The significance of a discrepancy between the pseudo-data and what one expects under the assumption of particular theoretical description is quantified by giving the probability value, the p-value. The latter is defined as the probability to find in the region of equal or lesser compatibility with the theory in question than the level of compatibility observed with the pseudo-data. Thus, in Table 4 and Table 5 the p-value is also provided together with the corresponding number of standard deviations, which is shown in parentheses. Let us note at this point, that the smaller the p-value the larger the significance because it tells us that the theoretical description under consideration might not adequately describe the pseudo-data. We would normally start to question the theoretical description employed only if we were to have found the p-value smaller than (larger than ). If the p-value is larger than (smaller than ) then we assume that the pseudo-data are consistent with the theoretical approach used to model the process under consideration. Results with p-value smaller than (larger than ) can be considered to be disfavoured by the pseudo-data. Finally, in Table 4 and Table 5 we also give the top quark mass shift, defined as , where GeV.
We start with results for 2.5 fb-1 that are collected in Table 4. The first thing that we can notice is an overall agreement, within , between various theoretical descriptions and the pseudo-data. Moreover, for all considered cases, the averaged minimal is of the order of . However, depending on the theory at hand, various mass shifts are observed. For the Full case, independently of the bin size and the scale choice, a difference from up to GeV can be identified. On the other hand, a shift of GeV is visible for NWA. Should we use the Full case with the fixed scale for the generation of the pseudo-data instead, the shift of GeV would rather be seen for NWA. However, the statistical uncertainty is still quite high for this case, that is of the order of GeV. For the higher luminosity case, that we shall present in the next step, despite the diminished quality of the fit the mass shifts will persist. They are again up to GeV for NWA with when pseudo-data are generated from the Full case with . In that case is of the order of GeV only. Thus, the off-shell effects and non-resonant contributions of the top quark and the gauge boson are not negligible for the top quark mass extraction from the observable. For the last case considered, that is NWAProd., a substantial deviation from of the order of GeV is observed, which can be explained by substantial shape differences of the normalised distribution in the regions sensitive to . The large mass shifts for two NWA cases suggest that for the full theory description for the production process is indeed required. Additionally, when examining Full and NWA cases closer, for example for the same scale choice, that is for , we can see that the statistical uncertainty of is always higher in the former case. This suggests underestimation of by about in the case of NWA. Let us remind here, that the NWAProd. case is far from complete theory since only higher order corrections to on-shell top quark pair production with one hard jet are incorporated. Thus, we mostly show this case for reasons of comparison and to underline the importance of QCD corrections and jet radiation in top quark decays. Moreover, let us stress here, that in ATLAS and CMS experimental analyses Aad:2015waa ; CMS:2016khu , the on-shell production process calculated at NLO in QCD is combined with a parton shower. Top quark decays are treated in the parton shower approximation omitting spin correlations. However, the shower programs include higher-order corrections to the hard subprocess in an approximate way by including the leading-logarithmic contributions to all orders. These dominant contributions are associated with collinear parton splittings or soft gluon emissions. Additionally, the parton shower approximation takes into account not only the collinear enhanced real parton emissions at each order in perturbation theory but also, by unitarity, virtual effects of the same order. Such effects are included in the probability of not splitting during evolution from one scale to the other encoded in the Sudakov form factor. Finally, top quark decays in standard shower programs are not based on a strict NWA, but rather obey a Breit-Wigner distribution that should account for the dominant off-shell effects. Therefore, NLO plus parton shower results are better approximations of NWA rather than of NWAProd.. Nevertheless, in Ref. Aad:2015waa ; CMS:2016khu , such predictions are first tuned to data and afterwards unfolded back to the parton level to obtain the on-shell top quarks, that are used to construct .
In the next step, we concentrate on results obtained for increased integrated luminosity of 25 fb-1, which are summarised in Table 5. First, as expected, the statistical uncertainty decreases with the square root of luminosity. Secondly, our conclusions about the top quark mass shift derived for 2.5 fb-1 are not altered. Thirdly, underestimation of the statistical uncertainties on by the NWA case can still be observed. Here this effect amounts to . However, unlike the case of low integrated luminosity, for 25 fb-1 sensitivity to the various theoretical predictions is clearly visible. This can be best observed in the changes of and the p-value. The pseudo-data are properly described only by Full either with () or with (). The best agreement in the former case is rather trivial. Full with will always work since it is used to obtain our pseudo-data sets. Less trivial is the fact that also Full with performs very well at least with the integrated luminosity at hand. This is due to the fact that these two scales provide very similar results. On the other hand, independently of the bin size the NWA case is disfavoured at the level and NWAProd. at the level. Even for the Full case with discrepancies at the level of are observed. The latter finding underlines the fact that when differential cross sections are employed not only the full off-shell effects and non-resonant background contributions of the top quark and gauge boson but also the scale choices play an important role. We note here, that a higher number of bins that corresponds to increased sensitivity to , helps to clearly distinguish between the case where the theory (still) agrees with the pseudo-data and the one where the theory is disfavoured by such pseudo-data.
In the following, systematic uncertainties on are examined. They are estimated based on the full theory because ultimately only this description should be used for the normalised distribution. Our findings are luminosity independent. However, as expected, in the case of the scale dependence they depend on the scale choice. Additionally they vary with the bin size used. For and theoretical uncertainties stemming from the scale variation have been estimated to be of the order of , whereas for they are larger of the order of . The smallest values are obtained for the case of the largest number of bins of equal size. As mentioned before the theoretical uncertainties, as obtained from the scale dependence of the templates, are not the only source of systematic uncertainties. Another source comes from various PDF parameterisations. Here, quite uniform uncertainties in the range of have been obtained. Thus, PDF uncertainties on for the process under scrutiny are well below the theoretical uncertainties due to scale dependence, which remain the dominant source of the theoretical systematics on the top quark mass extraction.
5 Comparison to the Observable
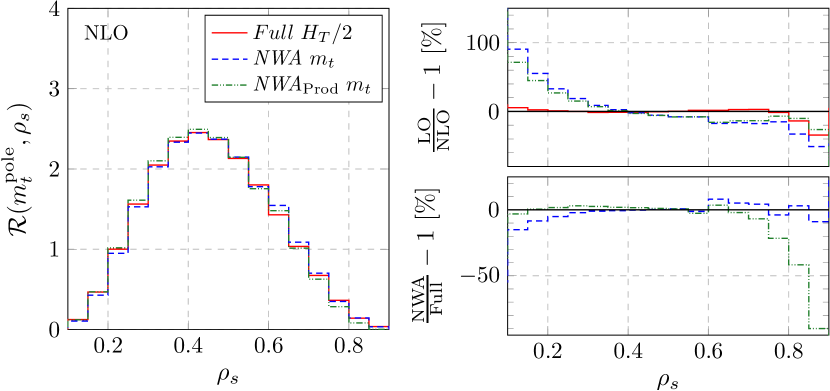
We also examine a slightly modified version of the normalised distribution dubbed . The difference between and comes from the second hard jet. Namely, if a second (leading-order) jet is resolved, it is added to the invariant mass of the system. The upper part of Figure 13 presents the differential distribution for three considered cases, Full, NWA and NWAProd.. The renormalisation and factorisation scales are set to the common value , where for both NWA cases and for the Full case. Also shown are the relative NLO QCD corrections and the relative deviation of the NWA results from the full calculation. On the other hand, in the lower part of Figure 13 the dependence on of is provided. We show the best theoretical prediction, Full, with for five different top quark masses. We can see that the beginning of the spectrum is mostly affected, because the additional hard jet essentially modifies the tails of . Moreover, the peak of the distribution is shifted towards smaller values of . The magnitude and sign of higher order corrections for NWA and NWAProd. have also changed for . For the Full case we have obtained shape differences from to , which once again underline the importance of the inclusion of higher-order corrections. Nevertheless, a large impact on the top quark mass extraction is not expected since the highest sensitivity falls in the range of high values of as can be deduced from the lower part of Figure 13 where a similar dependence on as in the case of is visible. For low values of we observe differences up to for NWA and for NWAProd., however, they are present only around where the dependence on is diminished. Our findings on can be summarised as follows. For the low luminosity case all extracted top quark masses are at most away from the corresponding values obtained with the help of . As a consequence, a similar size of the top quark mass shifts is noted. We should stress here that the quality of is worsened for all but the Full case with and . For 25 fb-1 only these two cases should be employed since other theoretical approaches are disfavoured beyond level. The main reason for which the previously defined variable should be used instead of , however, is the size of theoretical uncertainties. Once is used the theoretical uncertainties due to the scale dependence are driven by the leading order scale dependence of the second hard jet and a significant increase is observed. Namely, they amount to for the Full case with or . On the other hand, the magnitude of the PDF uncertainties is the same.
6 Comparison to Other Observables
In the following, we shall focus on examining the sensitivity of the normalised distribution by comparing it to other observables sensitive to in the production process. Since is defined as the (inverse) invariant mass of the plus additional hard jet system the natural observable to start with is the invariant mass of the top anti-top pair alone. In such a way we can assess the impact of the additional hard jet on the extraction. The normalised differential distribution is presented in Figure 14 together with its dependence on . For the top quark mass study a range up to TeV has only been used, the reason being the minimised difference between Full and NWA in this region. Furthermore, high energy regions are not only sensitive to electroweak corrections but also could be potentially diluted by new, not yet discovered, heavy resonances decaying to final states. Our findings are summarised in Table 6. For the same luminosity, the differential distribution seems to perform better than yielding statistical uncertainties a factor of to smaller. More importantly, the shift of the top quark mass, , is greatly reduced. For Full and NWA it is below or of the order of GeV and for the NWAProd. case it is equal to GeV. For a measurement not only the sensitivity is important but also the reliability of the observable used. For example in the case of a good sensitivity is achieved mostly due to a few first bins. In this extreme threshold regime, however, theoretical predictions would require to go beyond fixed order perturbation theory resumming threshold effects and soft gluon emissions. Such studies have been carried out for the invariant mass distribution of the on-shell top quarks in the production process at the LHC with TeV Kiyo:2008bv . From that study one can conclude that in the threshold region the enhancement of the cross section amounts to roughly a factor , additionally a significant shift of the threshold is observed. Compared to the inclusive fixed order NLO total cross section for production with , however, the increase is relatively small, of the order of only. In principle the shape of the differential distribution could be distorted in the threshold region, which in turn can affect the mean value of and shift it towards smaller values. In practise, however, one needs to realise here, that the size of the region where these effects can be visible is of the order of GeV only. Therefore a very fine resolution would be required to get sensitivity to the threshold effects. In our studies such effects are incorporated into one bin of GeV size. We have even checked a larger bin size of GeV (smaller number of bins) and confirmed that our findings on extraction are unchanged as can be seen from Table 6. Therefore, we conclude that we are below any sensitivity to such threshold effects since they are completely washed out by our resolution. Consequently, can be safely used. We are not aware of similar studies for the on-shell production at the LHC. Thus, it is still not clear to which extent the normalised distribution can be affected by initial state radiation as well as bound state corrections for . The theoretical uncertainties of based on stemming from the scale variation are estimated to be of the order of GeV, thus slightly larger than in the case of . On the other hand, by comparison the PDF uncertainties are negligible, at the level of GeV. One more time, we can observe that for 25 fb-1 only the Full theory adequately describes the pseudo-data. We would like to stress here, that the observable, similarly as the normalised distribution, allows to unfold the (real) data to the perturbative partonic level uniquely linking the value to the top quark mass from the SM Lagrangian.
| Theory, NLO QCD | Averaged | Probability | ||
|---|---|---|---|---|
| CT14 PDF | [GeV] | p-value | [GeV] | |
| 25 bins 2.5 fb-1 | ||||
| Full, | 173.24 0.55 | 1.03 | 0.42 (0.8) | |
| Full, | 173.11 0.54 | 1.04 | 0.41 (0.8) | |
| Full, | 173.52 0.57 | 1.08 | 0.36 (0.9) | |
| NWA, | 173.72 0.51 | 1.17 | 0.25 (1.1) | |
| NWAProd., | 171.36 0.48 | 1.62 | 0.03 (2.2) | |
| 25 bins 25 fb-1 | ||||
| Full, | 173.18 0.18 | 1.03 | 0.42 (0.8) | |
| Full, | 173.10 0.17 | 1.11 | 0.32 (1.0) | |
| Full, | 173.50 0.16 | 1.87 | 0.006 (2.7) | |
| NWA, | 173.73 0.17 | 3.03 | (4.9) | |
| NWAProd., | 171.39 0.15 | 7.84 | 0 () | |
| 12 bins 2.5 fb-1 | ||||
| Full, | 173.21 0.52 | 1.01 | 0.43 | |
| Full, | 173.10 0.55 | 1.02 | 0.42 | |
| Full, | 173.48 0.54 | 1.13 | 0.33 | |
| NWA, | 173.67 0.51 | 1.23 | 0.26 | |
| NWAProd., | 170.92 0.47 | 1.31 | 0.21 | |
| 12 bins 25 fb-1 | ||||
| Full, | 173.17 0.17 | 1.00 | 0.45 | |
| Full, | 173.10 0.17 | 1.18 | 0.30 | |
| Full, | 173.51 0.17 | 2.72 | 0.002 | |
| NWA, | 173.67 0.16 | 3.69 | ||
| NWAProd., | 170.96 0.16 | 4.36 |
Similar performance as in the case of can been obtained with the help of the more exclusive observable, , defined as the invariant mass of a -jet and a charged lepton. This observable is frequently used for top quark mass measurements by both ATLAS and CMS experimental collaborations in the di-lepton top quark decay channel, see e.g. Ref. Aaboud:2016igd ; Sirunyan:2017idq . We employ the invariant mass of the positron and a -jet, keeping in mind that experimentally one cannot uniquely determine which -jet should be taken into account to build the observable. If the pair that returns the smallest invariant mass will be chosen, however, then the probability that both final states come from the decay cascade initiated by the same top quark increases Beneke:2000hk . Thus, we define as
| Theory, NLO QCD | Averaged | Probability | ||
|---|---|---|---|---|
| CT14 PDF | [GeV] | p-value | [GeV] | |
| 31 bins 2.5 fb-1 | ||||
| Full, | 173.09 0.48 | 1.05 | 0.38 (0.9) | 0.11 |
| Full, | 173.01 0.50 | 1.06 | 0.37 (0.9) | 0.19 |
| Full, | 173.07 0.49 | 1.22 | 0.18 (1.3) | 0.13 |
| NWA, | 173.90 0.50 | 1.11 | 0.30 (1.0) | 0.70 |
| NWAProd., | 172.56 0.54 | 1.64 | 0.01 (2.6) | 0.64 |
| 31 bins 25 fb-1 | ||||
| Full, | 173.18 0.15 | 1.02 | 0.42 (0.8) | 0.02 |
| Full, | 173.23 0.15 | 1.03 | 0.41 (0.8) | 0.03 |
| Full, | 173.22 0.16 | 1.78 | 0.005 (2.8) | 0.02 |
| NWA, | 173.98 0.16 | 2.56 | 5 (4.6) | 0.78 |
| NWAProd., | 172.62 0.17 | 8.23 | 0 () | 0.58 |
| (19) |
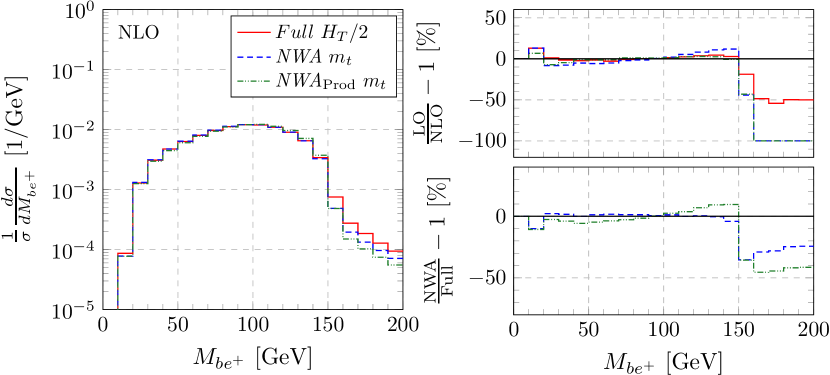
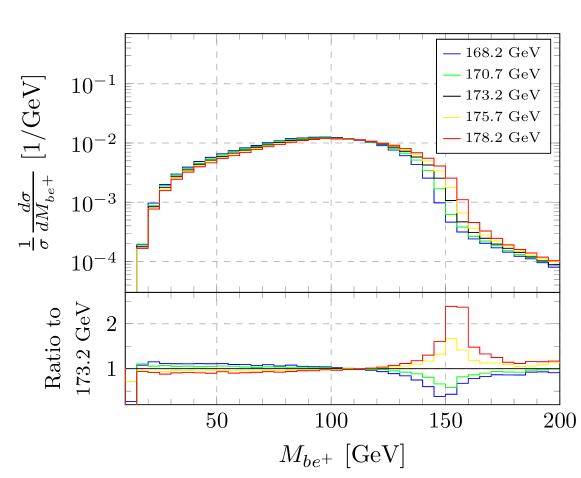
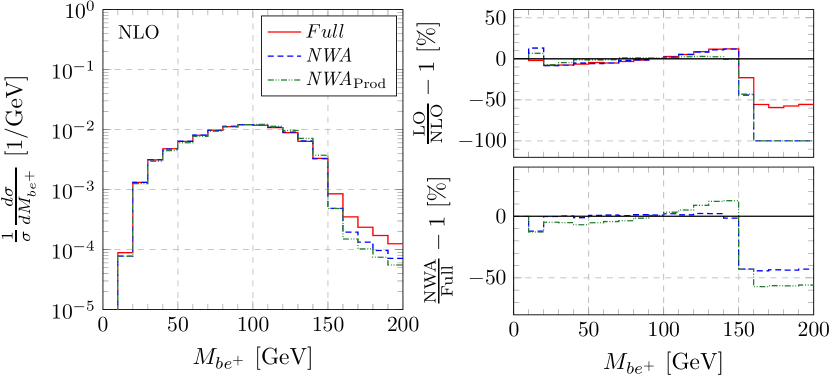
The observable possesses a kinematic endpoint that can be derived from the on-shell top-quark decay into . Since we have the invariant mass of the positron and the bottom quark is given by and in the massless case should be smaller or equal to . When both the quark and the gauge boson are treated as on-shell particles at the lowest order this strict kinematic limit amounts to GeV. Additional radiation, for example from parton showers or the real emission part of the higher order corrections, as well as off-shell effects and non-resonant contributions of the top quark and the gauge boson introduce a smearing of . In Figure 15, is shown together with its top quark mass dependence. A sharp fall of the cross section around the value of GeV is clearly observed. In the range below the kinematical cut-off the size of off-shell effects is negligible. Above the value, however, these effects are large, of the order of or even if only LO top quark decays are incorporated. In spite of that, a substantial impact on is not expected if the whole range of is to be taken into account, the reason being a drop of the cross section by one or even two orders of magnitude for . Our findings on are recapitulated in Table 7. We first observe that for the same case of the integrated luminosity a similar size of statistical uncertainties is obtained as for . Next, for the Full case with 2.5 fb-1 the top quark mass shift is much smaller of the order of GeV only. When luminosity is increased it is even further reduced down to GeV. At the same time for NWA and NWAProd. we have obtained a change by GeV. Comparing the NWA case with pseudo-data generation from Full with we find a shift in the top quark mass extraction of GeV. We note that this result is compatible with the shift of GeV observed for the process in Ref. Heinrich:2017bqp , that was generated for the similar setup. Also for 2.5 fb-1 all theoretical descriptions can be employed, whereas for the case of 25 fb-1 only the Full approach provides p-value larger than (below ). Lastly, theoretical uncertainties are very small, i.e. of the order of GeV for the Full case with dynamical scale choice and GeV for the Full case with a fixed scale. The PDF uncertainties are independent of the scale choice and yield GeV. Overall, considering all aspects, i.e. statistical uncertainties on , the top quark mass shift, the quality of the fit as well as theoretical uncertainties, the observable provides the best sensitivity to the top quark mass when the Full case is employed.
| Theory, NLO QCD | Averaged | Probability | ||
|---|---|---|---|---|
| CT14 PDF | [GeV] | p-value | [GeV] | |
| 22 bins 2.5 fb-1 | ||||
| Full, | 173.14 1.18 | 1.01 | 0.44 (0.8) | |
| Full, | 172.49 1.19 | 1.05 | 0.39 (0.8) | |
| Full, | 173.39 1.23 | 1.07 | 0.37 (0.9) | |
| NWA, | 174.47 1.19 | 1.06 | 0.38 (0.9) | |
| NWAProd., | 171.21 1.15 | 1.06 | 0.37 (0.9) | |
| 22 bins 25 fb-1 | ||||
| Full, | 173.27 0.39 | 1.03 | 0.41 (0.8) | |
| Full, | 172.55 0.37 | 1.17 | 0.26 (1.1) | |
| Full, | 173.45 0.40 | 1.83 | 0.01 (2.6) | |
| NWA, | 174.62 0.36 | 1.89 | 0.008 (2.6) | |
| NWAProd., | 171.22 0.34 | 1.48 | 0.07 (1.8) | |
| 22 bins 50 fb-1 | ||||
| Full, | 173.27 0.27 | 1.02 | 0.43 () | |
| Full, | 172.56 0.27 | 1.40 | 0.11 () | |
| Full, | 173.45 0.28 | 2.79 | () | |
| NWA, | 174.63 0.25 | 2.82 | () | |
| NWAProd., | 171.25 0.25 | 2.00 | 0.004 |
Our last (exclusive) observable, that we would like to examine, is the total transverse momentum of the top anti-top plus one hard jet system, , defined as
| (20) |
Let us remind that in the case of two resolved jets the one with highest transverse momentum is chosen. In Figure 16, this observable is presented, again together with its dependence on . For normalised distributions a shape difference between Full and NWAProd. is noticeable, which will be definitely reflected on the mean value of . By applying the same arguments as for also here a range only up to TeV is used in the top quark mass studies. Our results on are provided in Table 8. This observable has a similar performance in terms of statistical uncertainties as the normalised distribution. The top quark mass shift for the Full case is also comparable, i.e. between GeV independently of the luminosity considered and reduced in the case of NWA and NWAProd.. In the latter cases it amounts to GeV and GeV respectively. What seems to be different, however, is the good quality of the fit independently of the theory applied and luminosity examined. To be more precise, for 2.5 fb-1 all theoretical descriptions are within with the pseudo-data whereas for the 25 fb-1 case the same applies to the Full case with and . Nevertheless, for Full, NWA and NWAProd. with we have an agreement within with the pseudo-data. This suggests that a larger integrated luminosity is required to clearly differentiate among various theoretical approaches used in the calculation of higher order QCD corrections to the production process in the di-lepton channel at the LHC. Indeed, already for 50 fb-1, which corresponds approximately to events, again only the Full case with a dynamical scale choice, either or , reproduces the pseudo-data adequately as can be seen from Table 8. The remaining cases, Full and NWA with , are disfavoured beyond the level. In the former case the difference can be simply attributed to the fixed scale choice used for the description of the differential distribution, which not sufficiently describes tails of the distribution. As to the theoretical uncertainties the contribution related to unknown higher-order corrections is estimated to be of the order of GeV GeV for a dynamical scale choice and GeV for a fixed scale. We have also analysed the theoretical error arising from different parametrisation of PDFs, being able to quantify it at the level of GeV, thus well below the uncertainty associated with the scale dependence.
7 Summary and Conclusions
In this paper we have studied the normalised differential distribution including the leptonic top quark decays. We focused on fixed order NLO QCD calculations at the LHC with TeV. Three different theoretical descriptions of the top quark decay chain have been investigated. In the first approach we included all interferences, off-shell effects and non-resonant backgrounds. In the second case top quark decays in the narrow width approximation have been considered. To be more precise two cases have been employed: NLO QCD corrections to the production process with leading order decays and the more sophisticated case with QCD corrections and jet radiation present also in top quark decays. We have used these various theoretical prescriptions to investigate their impact on the extraction of the top quark mass. We have compared them to the pseudo-data sets, that have been generated from the best theoretical description, i.e. the Full prediction at NLO in QCD as generated with GeV and . Moreover, we have quantified associated theoretical uncertainties. For the low integrated luminosity case with that corresponded in our case to approximately events assuming perfect detector efficiency and to the statistical uncertainty on the top quark mass of the order of , all theoretical prescriptions seemed to be in agreement with the pseudo-data sets. The largest discrepancy amounted to only. Additionally, the averaged minimal was always around . However, substantial mass shifts, even up to GeV and GeV, have been observed in the case of NWA and NWAProd. respectively. We have checked that generating the pseudo-data sets with the Full case but for does not change the situation, namely mass shifts up to GeV for NWA and GeV for NWAProd. are still obtained. Thus, they cannot be ascribed only to effects of the scale choice used in the generation of the pseudo-data sets. For the higher luminosity case, that corresponded to events and , despite the diminished quality of the fit these mass shifts remained unchanged. Taking into account the size of the statistical uncertainty on the top quark mass and the negligible statistical errors of theoretical predictions as compared to pseudo-data errors we conclude that independently of the integrated luminosity case only the Full prediction with either or should be used to extract the top quark mass from the normalised differential distribution once top quark decays are included. Using the best theoretical description at hand, we have established that theoretical uncertainties stemming from the scale variation were luminosity independent and of the order of . The smallest value has been obtained for the normalised observable with the largest number of bins. Once a fixed scale has been used instead, they increased to . Thus, additionally, the importance of the proper scale choice for the description of the differential cross sections has been shown here. Another source of theoretical uncertainties on the top quark mass extraction coming from various PDF parameterisations has been estimated to be in the range of .
In the next step we examined a slightly modified version of the normalised differential distribution. Namely, if the second resolved jet was present it has been included in the definition of the observable. We have found similar performance as in the case for all aspects but theoretical uncertainties. The theoretical errors from the scale dependence increased to for the Full case either with or . The latter raise has been driven by the leading order nature of the second resolved jet.
Finally, to check the sensitivity of the observable we have made a comparison to the invariant mass of the system and to two other more exclusive observables like the minimal invariant mass of the charged lepton and -jet as well as the total transverse momentum of the system. In terms of the statistical errors on the extraction of and the mass shift the normalised invariant mass of the top anti-top pair has performed better than . For the same integrated luminosity case, was lower by a factor of . The quality of the fit seemed similar, however, the shift was below GeV for the Full case with the dynamical scale choice, GeV for the fixed scale and GeV for the NWA case. In the case of NWAProd. a somewhat higher value of the shift, around GeV, has been obtained. Thus, in the chosen range, i.e. up to TeV, and for the low integrated luminosity case, the off-shell effects and non-resonant contributions of the top quark and gauge boson were not very crucial. It turned out that the inclusion of the higher order corrections to the top quark decays was more important. Both Full and NWA cases could be employed for the extraction. Generally speaking, the case of the low integrated luminosity has shown lack of a sensitivity to the details of the top quark decays. Once increased luminosity was considered, however, the NWA case has been disfavoured at the level considering only the statistical uncertainties. The performance of the normalised observable was similar to the performance of the more exclusive and very well known observable used in the alternative measurements, i.e. the (normalised) minimal invariant mass of the bottom jet and the charged lepton, , which has also been examined. The last observable that we have studied was the normalised differential cross section. This exclusive observable proved to be similar to in terms of and the quality of the fit, however, the observed mass shifts were smaller, of the order of GeV for Full, GeV for NWA and GeV for NWAProd.. In addition, in order to disfavour the NWA approach beyond the level the integrated luminosity had to be increased times unlike for all other cases where the smaller change from to has been sufficient to obtain the level. Overall, among all studied normalised differential cross sections, has shown the highest sensitivity to the top quark and gauge boson off-shell effects and non-resonant background contributions.
Let us note here that this is a theoretical study and additional systematic uncertainties need to be addressed. Among others the impact of the parton shower on the shape of , , and observables should be carefully examined as well as non-perturbative effects together with the -tagging and neutrino reconstruction efficiencies should be estimated. These uncertainties are, however, beyond the scope of this paper. We plan to study them in a separate publication. Even though we can not quantify the size of systematic uncertainties on the experimental side we can make the following general statement. If, for the particular observable that we have scrutinised for which large mass shifts have not been present, the systematic uncertainties are larger or of the same order as our statistical uncertainty for fb-1, various theoretical descriptions at NLO in QCD, that have been investigated in the paper, can be employed to simulate the production process in the di-lepton top quark decay channel. This is possible since we do not have sufficient sensitivity to see differences in the various descriptions of the top quark decays. In the case of observables with a large mass shift, e.g. or , all these theoretical descriptions may still be used but one would have to compensate for the shift. If the size of systematic uncertainties, however, is rather similar to for fb-1 or in the case of to for fb-1, only the Full theoretical description with the dynamical scale choice, either or , should be used to simulate the production process at the LHC to extract the top quark mass.
A few additional comments are in order. The differential observable has already been employed by the ATLAS and CMS experimental collaborations at the LHC to determine the top quark mass. In both studies, on-shell top quarks have been used to build the normalised observable. In practise, various Monte Carlo programs have been used where at most on-shell or samples at NLO in QCD have been matched with parton shower programs like PYTHIA or HERWIG. Nevertheless, such theoretical predictions have been first tuned to data to account for missing perturbative and non-perturbative contributions. In the next step they are unfolded back to the so-called parton level to obtain on-shell top quarks. These calibrations come with additional uncertainties that the experimental collaborations need to consider. Finally, such predictions are contrasted with the same data to extract the top quark mass. NLO QCD calculations with complete top quark and gauge boson off-shell effects and non-resonant contributions included allow, instead, to define top quarks using kinematics and selection cuts making them much closer to the experimental data. Thus, for example the top quark mass can be measured using the fiducial differential cross section as a function of or . To summarise, the aim of such precise theoretical predictions can be twofold. First, they can be used for a direct comparison with the LHC data at the parton level, which would lead to the much simplified calibration procedure and substantial reduction of the systematic uncertainties. Secondly, they can be utilised by the experimental collaborations at the intermediate level to test the quality of the tuning and unfolding procedures. Close collaboration on these issues with experimental colleagues from ATLAS and CMS is already planned.
Acknowledgements.
We would like to thank Juan Fuster for careful reading of the manuscript and his valuable comments. Furthermore, we thank Jamie Tattersall and Peter Uwer for discussions. The work of M.W. and H.B.H. was supported in part by the German Research Foundation (DFG) under Grant No. WO 1900/2 Top-Quarks under the LHCs Magnifying Glass: From Process Modelling to Parameter Extraction. Furthermore, the work of H.B.H. was supported by a Rutherford Grant ST/M004104/1. The research of G.B. was supported by grant K 125105 of the National Research, Development and Innovation Office in Hungary. Simulations were performed with computing resources granted by RWTH Aachen University under project rwth0165.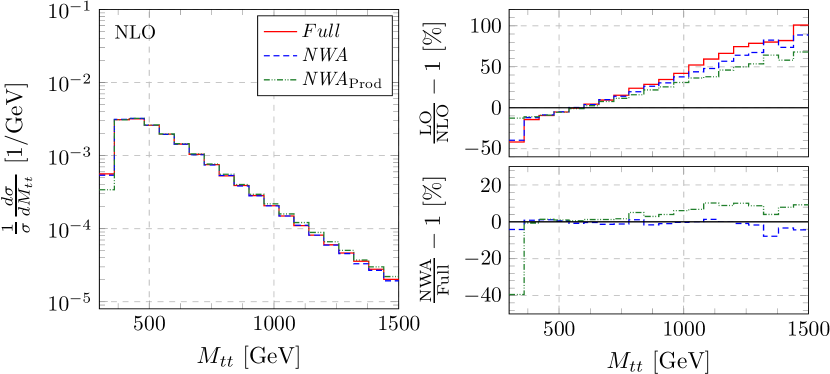
Appendix A Comparison between Full, NWA and NWA for
In Figures 14, 15 and 16, we have shown the comparison between three theoretical predictions corresponding to different modellings of top-quark decays: Full with , NWA with and NWAProd. with , for , and observables. Here, is the common value chosen for the renormalizaton and factorization scales, . These comparisons were relevant for our top-quark mass extraction studies performed in Section 6. In this Appendix, we show the very same comparison albeit with a common scale choice, , used for all three theoretical predictions. We believe such comparison will better reflect the finite-top-width and finite--width effects in Full compared to NWA. In Figures 17, 18 and 19, we show Full, NWA and NWAProd. predictions, all with for normalised , and observables.
References
- (1) G. Degrassi, S. Di Vita, J. Elias-Miro, J. R. Espinosa, G. F. Giudice, G. Isidori and A. Strumia, Higgs mass and vacuum stability in the Standard Model at NNLO, JHEP 1208 (2012) 098 [arXiv:1205.6497 [hep-ph]].
- (2) S. Alekhin, A. Djouadi and S. Moch, The top quark and Higgs boson masses and the stability of the electroweak vacuum, Phys. Lett. B 716 (2012) 214 [arXiv:1207.0980 [hep-ph]].
- (3) S. Frixione, P. Nason and B. R. Webber, Matching NLO QCD and parton showers in heavy flavor production, JHEP 0308 (2003) 007 [hep-ph/0305252].
- (4) S. Frixione, P. Nason and G. Ridolfi, A Positive-weight next-to-leading-order Monte Carlo for heavy flavour hadroproduction, JHEP 0709 (2007) 126 [arXiv:0707.3088 [hep-ph]].
- (5) J. M. Campbell, R. K. Ellis, P. Nason and E. Re, Top-Pair Production and Decay at NLO Matched with Parton Showers, JHEP 1504 (2015) 114 [arXiv:1412.1828 [hep-ph]].
- (6) T. Jezo and P. Nason, On the Treatment of Resonances in Next-to-Leading Order Calculations Matched to a Parton Shower, JHEP 1512 (2015) 065 [arXiv:1509.09071 [hep-ph]].
- (7) T. Jezo, J. M. Lindert, P. Nason, C. Oleari and S. Pozzorini, An NLO+PS generator for and production and decay including non-resonant and interference effects, Eur. Phys. J. C 76 (2016) no.12, 691 [arXiv:1607.04538 [hep-ph]].
- (8) [ATLAS, CDF, CMS and D0 Collaborations], First combination of Tevatron and LHC measurements of the top-quark mass, arXiv:1403.4427 [hep-ex].
- (9) M. Aaboud et al. [ATLAS Collaboration], Measurement of the top quark mass in the di-lepton channel from TeV ATLAS data, Phys. Lett. B 761 (2016) 350 [arXiv:1606.02179 [hep-ex]].
- (10) V. Khachatryan et al. [CMS Collaboration], Measurement of the top quark mass using proton-proton data at = 7 and 8 TeV, Phys. Rev. D 93 (2016) no.7, 072004 [arXiv:1509.04044 [hep-ex]].
- (11) M. Czakon, P. Fiedler and A. Mitov, Total Top-Quark Pair-Production Cross Section at Hadron Colliders Through , Phys. Rev. Lett. 110 (2013) 252004 [arXiv:1303.6254 [hep-ph]].
- (12) G. Aad et al. [ATLAS Collaboration], Measurement of the production cross-section using events with b-tagged jets in pp collisions at = 7 and 8 with the ATLAS detector, Eur. Phys. J. C 74 (2014) no.10, 3109 Addendum: [Eur. Phys. J. C 76 (2016) no.11, 642] [arXiv:1406.5375 [hep-ex]].
- (13) V. Khachatryan et al. [CMS Collaboration], Measurement of the t-tbar production cross section in the e-mu channel in proton-proton collisions at = 7 and 8 TeV, JHEP 1608 (2016) 029 [arXiv:1603.02303 [hep-ex]].
- (14) A. M. Sirunyan et al. [CMS Collaboration], Measurement of the production cross section using events with one lepton and at least one jet in pp collisions at = 13 TeV, JHEP 1709 (2017) 051 [arXiv:1701.06228 [hep-ex]].
- (15) M. Beneke, P. Marquard, P. Nason and M. Steinhauser, On the ultimate uncertainty of the top quark pole mass, Phys. Lett. B 775 (2017) 63 [arXiv:1605.03609 [hep-ph]].
- (16) A. H. Hoang, C. Lepenik and M. Preisser, On the Light Massive Flavor Dependence of the Large Order Asymptotic Behavior and the Ambiguity of the Pole Mass, JHEP 1709 (2017) 099 [arXiv:1706.08526 [hep-ph]].
- (17) S. Biswas, K. Melnikov and M. Schulze, Next-to-leading order QCD effects and the top quark mass measurements at the LHC, JHEP 1008 (2010) 048 [arXiv:1006.0910 [hep-ph]].
- (18) G. Heinrich, A. Maier, R. Nisius, J. Schlenk and J. Winter, NLO QCD corrections to production with leptonic decays in the light of top quark mass and asymmetry measurements, JHEP 1406 (2014) 158 [arXiv:1312.6659 [hep-ph]].
- (19) S. Frixione and A. Mitov, Determination of the top quark mass from leptonic observables, JHEP 1409 (2014) 012 [arXiv:1407.2763 [hep-ph]].
- (20) K. Agashe, R. Franceschini, D. Kim and M. Schulze, Top quark mass determination from the energy peaks of b-jets and B-hadrons at NLO QCD, Eur. Phys. J. C 76 (2016) no.11, 636 [arXiv:1603.03445 [hep-ph]].
- (21) G. Heinrich, A. Maier, R. Nisius, J. Schlenk, M. Schulze, L. Scyboz and J. Winter, NLO and off-shell effects in top quark mass determinations, arXiv:1709.08615 [hep-ph].
- (22) G. Corcella, R. Franceschini and D. Kim, Fragmentation Uncertainties in Hadronic Observables for Top-quark Mass Measurements, arXiv:1712.05801 [hep-ph].
- (23) S. Ferrario Ravasio, T. Jezo, P. Nason and C. Oleari, A Theoretical Study of Top-Mass Measurements at the LHC Using NLO+PS Generators of Increasing Accuracy, arXiv:1801.03944 [hep-ph].
- (24) S. Alioli, P. Fernandez, J. Fuster, A. Irles, S. O. Moch, P. Uwer and M. Vos, A new observable to measure the top-quark mass at hadron colliders, Eur. Phys. J. C 73 (2013) 2438 [arXiv:1303.6415 [hep-ph]].
- (25) J. Fuster, A. Irles, D. Melini, P. Uwer and M. Vos, Extracting the top-quark running mass using events produced at the Large Hadron Collider, Eur. Phys. J. C 77 (2017) no.11, 794 [arXiv:1704.00540 [hep-ph]].
- (26) G. Aad et al. [ATLAS Collaboration], Determination of the top-quark pole mass using 1-jet events collected with the ATLAS experiment in 7 TeV pp collisions, JHEP 1510 (2015) 121 [arXiv:1507.01769 [hep-ex]].
- (27) CMS Collaboration [CMS Collaboration], Determination of the normalised invariant mass distribution of jet and extraction of the top quark mass, CMS-PAS-TOP-13-006.
- (28) G. Bevilacqua, H. B. Hartanto, M. Kraus and M. Worek, Top Quark Pair Production in Association with a Jet with Next-to-Leading-Order QCD Off-Shell Effects at the Large Hadron Collider, Phys. Rev. Lett. 116 (2016) no.5, 052003 [arXiv:1509.09242 [hep-ph]].
- (29) G. Bevilacqua, H. B. Hartanto, M. Kraus and M. Worek, Off-shell Top Quarks with One Jet at the LHC: A comprehensive analysis at NLO QCD, JHEP 1611 (2016) 098 [arXiv:1609.01659 [hep-ph]].
- (30) K. Melnikov, A. Scharf and M. Schulze, Top quark pair production in association with a jet: QCD corrections and jet radiation in top quark decays, Phys. Rev. D 85 (2012) 054002 [arXiv:1111.4991 [hep-ph]].
- (31) K. Melnikov and M. Schulze, NLO QCD corrections to top quark pair production in association with one hard jet at hadron colliders, Nucl. Phys. B 840 (2010) 129 [arXiv:1004.3284 [hep-ph]].
- (32) J. Butterworth et al., PDF4LHC recommendations for LHC Run II, J. Phys. G 43 (2016) 023001 [arXiv:1510.03865 [hep-ph]].
- (33) G. Bevilacqua, M. Czakon, M. V. Garzelli, A. van Hameren, A. Kardos, C. G. Papadopoulos, R. Pittau and M. Worek, Helac-NLO, Comput. Phys. Commun. 184 (2013) 986 [arXiv:1110.1499 [hep-ph]].
- (34) M. Czakon, C. G. Papadopoulos and M. Worek, Polarizing the Dipoles, JHEP 0908 (2009) 085 [arXiv:0905.0883 [hep-ph]].
- (35) G. Bevilacqua, M. Czakon, M. Kubocz and M. Worek, Complete Nagy-Soper subtraction for next-to-leading order calculations in QCD, JHEP 1310 (2013) 204 [arXiv:1308.5605 [hep-ph]].
- (36) A. van Hameren, C. G. Papadopoulos and R. Pittau, Automated one-loop calculations: A Proof of concept, JHEP 0909 (2009) 106 [arXiv:0903.4665 [hep-ph]].
- (37) G. Bevilacqua, M. Czakon, A. van Hameren, C. G. Papadopoulos and M. Worek, Complete off-shell effects in top quark pair hadroproduction with leptonic decay at next-to-leading order, JHEP 1102 (2011) 083 [arXiv:1012.4230 [hep-ph]].
- (38) K. Melnikov and M. Schulze, NLO QCD corrections to top quark pair production and decay at hadron colliders, JHEP 0908 (2009) 049 [arXiv:0907.3090 [hep-ph]].
- (39) M. Jeżabek and J. H. Kühn, QCD Corrections to Semileptonic Decays of Heavy Quarks, Nucl. Phys. B 314 (1989) 1.
- (40) A. Denner, S. Dittmaier, S. Kallweit and S. Pozzorini, NLO QCD corrections to off-shell top-antitop production with leptonic decays at hadron colliders, JHEP 1210 (2012) 110 [arXiv:1207.5018 [hep-ph]].
- (41) A. Buckley, J. Ferrando, S. Lloyd, K. Nordström, B. Page, M. Rüfenacht, M. Schönherr and G. Watt, LHAPDF6: parton density access in the LHC precision era, Eur. Phys. J. C 75 (2015) 132 [arXiv:1412.7420 [hep-ph]].
- (42) S. Dulat et al., New parton distribution functions from a global analysis of quantum chromodynamics, Phys. Rev. D 93 (2016) no.3, 033006 [arXiv:1506.07443 [hep-ph]].
- (43) R. D. Ball et al. [NNPDF Collaboration], Parton distributions for the LHC Run II, JHEP 1504 (2015) 040 [arXiv:1410.8849 [hep-ph]].
- (44) L. A. Harland-Lang, A. D. Martin, P. Motylinski and R. S. Thorne, Parton distributions in the LHC era: MMHT 2014 PDFs, Eur. Phys. J. C 75 (2015) 5, 204 [arXiv:1412.3989 [hep-ph]].
- (45) M. Cacciari, G. P. Salam and G. Soyez, The Anti-k(t) jet clustering algorithm, JHEP 0804 (2008) 063 [arXiv:0802.1189 [hep-ph]].
- (46) Y. Kiyo, J. H. Kühn, S. Moch, M. Steinhauser and P. Uwer, Top-quark pair production near threshold at LHC, Eur. Phys. J. C 60 (2009) 375 [arXiv:0812.0919 [hep-ph]].
- (47) A. M. Sirunyan et al. [CMS Collaboration], Measurement of the top quark mass in the dileptonic decay channel using the mass observables , , and in pp collisions at TeV, Phys. Rev. D 96 (2017) no.3, 032002 [arXiv:1704.06142 [hep-ex]].
- (48) M. Beneke et al., Top quark physics, Published in Geneva 1999, Standard model physics (and more) at the LHC, 419-529 [hep-ph/0003033].