A Green Bank Telescope Survey of Large Galactic HII Regions
Abstract
As part of our ongoing H II Region Discovery Survey (HRDS), we report the Green Bank Telescope detection of 148 new angularly-large Galactic H II regions in radio recombination line (RRL) emission. Our targets are located at a declination , which corresponds to at . All sources were selected from the WISE Catalog of Galactic H II Regions, and have infrared angular diameters . The Galactic distribution of these “large” H II regions is similar to that of the previously-known sample of Galactic H II regions. The large H II region RRL line width and peak line intensity distributions are skewed toward lower values compared with that of previous HRDS surveys. We discover 7 sources with extremely narrow RRLs . If half the line width is due to turbulence, these 7 sources have thermal plasma temperatures . These temperatures are lower than any measured for Galactic H II regions, and the narrow line components may arise instead from partially ionized zones in the H II region photo-dissociation regions. We discover G039.515+00.511, one of the most luminous H II regions in the Galaxy. We also detect the RRL emission from three H II regions with diameters , making them some of the physically largest known H II regions in the Galaxy. This survey completes the HRDS H II region census in the Northern sky, where we have discovered 887 H II regions and more than doubled the previously-known census of Galactic H II regions.
1 Introduction
H II regions begin their lives as small zones of ionized gas surrounding their central ionizing stars. Because of the pressure difference between the H II region plasma and the neutral gas of the ambient interstellar medium (ISM), they expand with time. The total mass of ionized gas in an H II region is related to the stellar output of ionizing photons and is therefore relatively constant throughout the ionizing stars’ main sequence lifetimes. As they evolve and increase in size, H II region electron densities decrease until they become large, diffuse nebulae (e.g., Dyson & Williams, 1997).
Their low infrared and radio surface brightness values make such evolved nebulae difficult to observe. Such large nebulae have been detected in optical surveys (e.g. Haffner et al., 2003), but there are few radio studies, and even fewer studies at any other wavelength dedicated to them. Instead, much of the H II region research over the past 30 years has focused on young H II regions, e.g., ultra-compact or hyper-compact nebulae. Radio work on large H II regions as a class began and ended with Lockman et al. (1996, hereafter L96), who observed 130 such nebulae in radio recombination line (RRL) emission. Our lack of knowledge about the large H II region population means that our sample of Galactic H II regions remains incomplete. Because they have low surface brightnesses, such regions are also likely to be missed in extragalactic studies. This discrepancy in the H II region census may therefore impede our ability to accurately determine the properties of Galactic star formation as traced by H II regions.
Despite their low surface brightnesses, large H II regions may be among the most luminous in the Galaxy. As part of the H II Region Discovery Survey (HRDS; Bania et al., 2010; Anderson et al., 2011), we discovered the “G52L” large H II region, which had not yet been observed in RRL emission (Bania et al., 2012). We inferred the velocity of this nebula through its association with compact H II regions, together with H I, and . This large region is 10 kpc distant and has a 1.4 GHz flux density of Jy (Bania et al., 2012). This implies an ionizing luminosity of s-1, equivalent to 2 main sequence O4 stars or main sequence O7 stars (Sternberg et al., 2003). Because it is relatively faint, G52L is not in the Murray & Rahman (2010) catalog of large massive star forming regions. Its exclusion from their catalog hints that other, yet to be discovered, luminous large H II regions such as G52L may make important contributions to the total ionization of the Galaxy.
Large H II regions may also play a key role in maintaining the warm ionized medium (WIM), the origins of which are still debated. In many cases, we observe that the photo-dissociation regions (PDRs) of large H II regions are fragmentary, which indicates that they may be leaking a significant number of ionizing photons into the ISM. Leaking photons from the OB stars powering H II regions help to maintain the WIM (Haffner et al., 2009). The WIM appears strongly correlated in position and velocity with H II regions (Alves et al., 2012), although the particulars of the situation are not yet well understood (Roshi et al., 2012).
In our ongoing HRDS census, we are trying to identify and observe all possible Galactic H II regions in RRL emission. The detection of RRL emission provides a velocity, which can then be turned into a kinematic distance by assuming a Galactic rotation model (e.g., Anderson & Bania, 2009; Anderson et al., 2012b). With a large sample of H II regions that have distances, we may better trace Galactic structure and the properties of global massive star formation in the Galaxy. The HRDS has detected the RRL emission from over 800 nebulae to date (Anderson et al., 2011; Bania et al., 2012; Anderson et al., 2015a; Brown et al., 2017) spanning the entire sky. For all HRDS surveys, targets were identified by matching mid-infrared (MIR) emission [from Spitzer or the Wide-field Infrared Survey Explorer (WISE)] with public radio continuum data. Previous HRDS surveys mostly targeted regions small with respect to the telescope beam (e.g. Anderson et al., 2011).
Here, we report Green Bank Telescope (GBT) observations of a sample of angularly large H II region candidates located North of ( at ). This survey completes the HRDS H II region census in the Northern sky. Although they are H II region candidates in the WISE Catalog remaining, these are too faint to be detected in RRL emission for reasonable integration times.
2 Target Selection
We draw our targets from the WISE Catalog of Galactic H II Regions (Anderson et al., 2014), which lists H II region candidates identified from WISE data (Wright et al., 2010) that have associated radio continuum emission. As in Anderson et al. (2015a), we also include in our sample Sharpless H II regions not yet observed in RRL emission. In Anderson et al. (2011), we showed that the signature of H II regions in the MIR is µm emission surrounding µm emission. Our RRL detection rate of 95% in previous HRDS surveys shows that this criterion accurately identifies bona fide H II regions. It can be applied using Spitzer data (at 8.0 µm and 24 µm) as in Anderson et al. (2011); Bania et al. (2012), and also WISE data (at 12 µm and 22 µm) as in Anderson et al. (2015a).
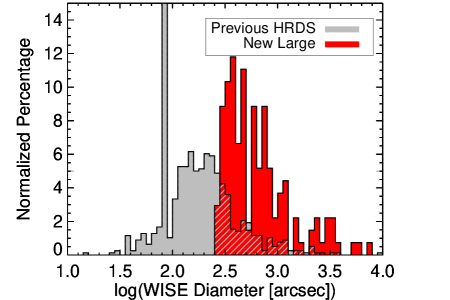
The candidates have angular diameters as defined from MIR data in the WISE H II region catalog. Because the infrared size of an H II region includes the emission from its PDR, the radio sizes of H II regions are smaller than the infrared sizes, on average by approximately a factor of two (Bihr et al., 2016). Compared with that of previous HRDS surveys, our sample is skewed toward angularly large regions (Figure 1).
All objects targeted here also have spatially coincident cm continuum emission. We use this 20 cm continuum data to determine the expected antenna temperature of our RRL observations. We primarily use the VLA Galactic Plane Survey 21 cm continuum data (VGPS; Stil et al., 2006) in the first Galactic quadrant, the Canadian Galactic Plane Survey 21 cm continuum data (CGPS; Taylor et al., 2003) in the second Galactic quadrant, and 20 cm NRAO VLA Sky Survey otherwise (NVSS; Condon et al., 1998). We select only candidates that have peak 20 cm radio continuum emission of at least 45 . After extrapolating the 20 emission to our observed 6 cm wavelength by assuming optically thin free-free continuum emission (), a RRL line-to-continuum flux density ratio of 20, and a GBT gain of 2 K Jy-1, this results in a lower-limit predicted RRL intensity of 5 mK, or 2.5 mJy.
3 Observations and Data Reduction
We observe our targets using the 100-m GBT at C-band (4–8 ). Previous HRDS surveys used X-band (8–10 ) observations, but these nebulae are better matched to the GBT C-band beam of . Additionally, RRLs from low-density plasma are amplified by stimulated emission, an effect that is frequency-dependent. Plasma of density , which is not unreasonable for many of these regions, is amplified most strongly at C-band (Salem & Brocklehurst, 1979). This in principle makes the detection of RRL emission from large H II regions easier than it would be at other frequencies. Finally, hardware upgrades at the GBT make RRL observations with the GBT at C-band extremely sensitive.
We employ total-power position-switching RRL spectroscopic observations with six-minute on-source and off-source integrations, hereafter a “pair.” The off-source positions are located in Right Ascension from the on-source locations, which ensures that they track the same path on the sky. We observe nearly all sources for two pairs, or 12-minutes on-source. We alter this integration time slightly such that the integration times for the brightest extrapolated C-band continuum emission are 6-minutes (one pair), and the faintest one 24-minutes (four pairs). Unlike in previous GBT HRDS surveys, due to the low surface brightness of these targets and confusion within the Galactic plane, we do not measure their continuum emission.
The GBT recently upgraded both its spectrometer and also the C-band receiver. The new spectrometer, called the Versatile GBT Astronomical Spectrometer (VEGAS; Prestage et al., 2015), can simultaneously observe 64 spectral windows. The upgraded C-band receiver has a 3.80 instantaneous bandwidth, from 3.95 to 8.00 . Using the VEGAS/C-band combination, we simultaneously observe 22 transitions from H117 to H95, not including H113 (which is compromised by H142). These transitions span frequencies from 4.05 to 7.55 . We observe each line in two orthogonal linear polarizations.
We made extensive tests of the VEGAS/C-band configuration to ensure stability across the bandpass, and to verify the intensity calibration. Because of instabilities at the extremes of the instantaneous bandpass, we disregard data from the H117, H116, H115, H96, and H95 lines in our analysis. The total usable instantaneous bandpass is to , which includes 17 uncompromised hydrogen RRLs. We verified the performance of our configuration by observing the strong RRL source W3 at the beginning of each observing session. The measured hydrogen RRL intensities for W3 across the usable bandpass agree with those measured in previous work (Balser et al., 2016). Furthermore, the intensities of the W3 RRLs were stable in time, and invariant with weather, to within 10%.
We initially calibrated the spectra using the measured temperature of a noise diode whose power was periodically injected into the signal path during observations. In previous work with the GBT at X-band, we found that this calibrates the data to within 10% (e.g., Anderson et al., 2015a). We additionally observed the primary flux calibrator 3C286 in two modes: 1) by making small fully-sampled maps scanning in R.A. and Dec, and 2) using total power position-switched observations. For both modes, we use the same spectrometer configuration as for the science targets. In previous HRDS surveys, we used the Digital Continuum Receiver (DCR) to perform flux calibration measurements by tuning the DCR to each observed frequency. Because of the large number of frequencies we now observe simultaneously, it is not feasible to use the DCR by tuning to each frequency individually. We derive the continuum intensities of 3C286 from the vertical offset of the spectral baselines, i.e., the change in system temperature as we switch from on- to off-source positions, and assume a gain of 2 K Jy-1. For the maps, we find that the derived flux densities averaged over all spectral windows agree with the values for 3C286 given in Ott et al. (1994) to within 4%, for all weather conditions. For the pointed observations, the agreement between the noise-diode calibrated data and the data for 3C286 is good to within in good weather, and in poorer weather. Presumably the discrepancy between the results of the two modes is due to better sky subtraction in the maps. The C-band intensity scale is relatively insensitive to opacity and elevation gain corrections, which both have magnitudes of (Ghigo et al., 2001). We conclude that the absolute intensities of the derived line parameters are good to within 15%, even in the worst observing conditions. We make no attempt to correct for calibration uncertainties, opacity effects, or elevation effects.
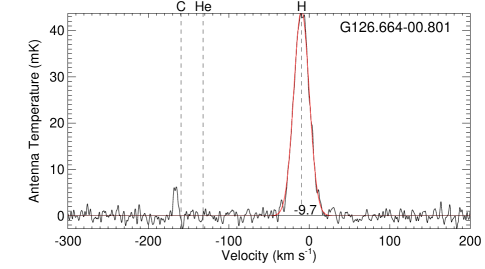
We follow the same data reduction steps as in previous HRDS surveys, employing the TMBIDL software package (Bania et al., 2016, V8, Zenodo, doi:10.5281/zenodo.32790). We average the two polarizations of each transition, then average all 17 usable transitions after regridding to the velocity scale of the H95 transition. This line-stacking method was originally demonstrated by Balser (2006), and later employed in all HRDS surveys. Averaging the spectra in this way improves the RRL signal-to-noise ratio, allowing for significantly reduced integration times. We remove a low-order polynomial baseline (typically 4th order), smooth to 1.82 resolution, and fit Gaussian line profiles to the resultant spectrum. Thus, we derive the LSR111Defined as the kinematic local standard of rest (LSR) frame using the radio Doppler shift convention. The kinematic LSR is defined by a solar motion of 20.0 toward (Gordon, 1976). velocity, line intensity, and full width at half-maximum (FWHM) line width for each hydrogen RRL component. We identify the highest-velocity line as being from hydrogen. We also identify helium and carbon RRLs, offset by and from the hydrogen RRLs, respectively.
The GBT beam at the observed frequencies ranges from () to (), a difference of 60%. The regions observed all have WISE-derived diameters of or greater (and therefore radio-diameters of perhaps , c.f. Bihr et al., 2016). Because many of these regions are resolved, each frequency may sample a slightly different portion of each region. We attempt no correction for this complication.
4 The Catalog of Large H II Regions
We detect hydrogen RRLs from 148 of the 157 observed sources, for a 94% detection rate. This is comparable to the 95% detection rate of the original GBT HRDS (Anderson et al., 2011) and the 93% detection rate of the GBT HRDS extension Anderson et al. (2015a). Twenty-three of the 148 detections are of Sharpless H II regions not previously detected in RRL emission. We give the derived hydrogen RRL parameters in Table 4, which lists the source name, the Galactic longitude and latitude, the line intensity, the FWHM line width, the LSR velocity, and the r.m.s. noise in the spectrum. The errors given in Table 4 for the line parameters are the uncertainties from the Gaussian fits. For sources with multiple velocity components detected along the line of sight, we append to their names additional letters “a”, “b”, or “c” in order of decreasing peak line intensity. All listed hydrogen lines have a signal-to-noise ratio (SNR) of at least 5, where the SNR as defined by Lenz & Ayres (1992) is
| (1) |
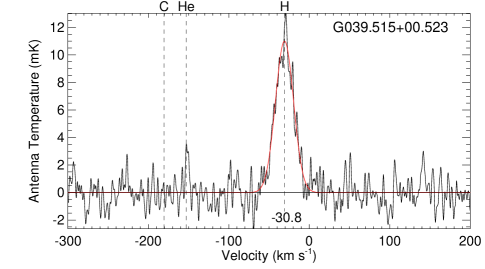
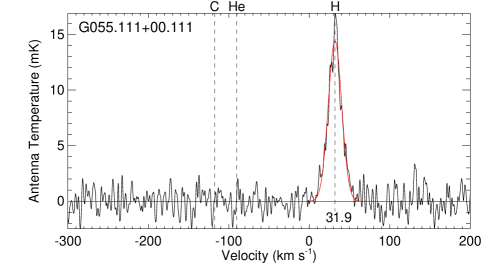
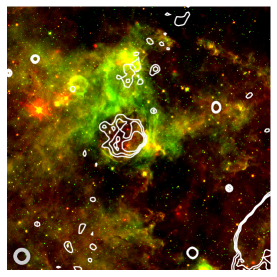
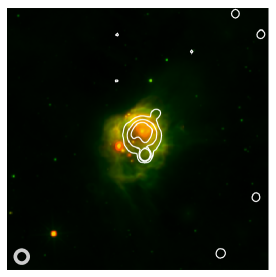
where is the peak line height, r.m.s. is the root-mean-squared spectral noise, is FWHM line width in , and the factor of 1.82 is the FWHM of the Gaussian smoothing kernel we used. We show example spectra in Figure 2.
| SourceaaSource names for HII regions with multiple detected hydrogen RRL components are appended by “a,” “b,” or “c,” in order of decreasing hydrogen RRL intensity. | r.m.s. | ||||||||
|---|---|---|---|---|---|---|---|---|---|
| () | () | (mK) | (mK) | () | () | () | () | (mK) | |
| S17a | 0.003 | +0.128 | 7.5 | 1.7 | |||||
| S17b | 0.003 | +0.128 | 1.7 | ||||||
| S19 | 0.124 | 0.568 | 15.5 | 2.3 | |||||
| G003.25300.280 | 3.253 | 0.280 | 5.1 | 1.0 | |||||
| G003.59700.206a | 3.597 | 0.206 | 1.0 | ||||||
| G003.59700.206b | 3.597 | 0.206 | 8.8 | 1.0 | |||||
| G003.71300.215a | 3.713 | 0.215 | 4.1 | 1.0 | |||||
| G003.71300.215b | 3.713 | 0.215 | 1.0 | ||||||
| G006.38900.198 | 6.389 | 0.198 | 23.7 | 1.3 | |||||
| S31 | 7.205 | 2.188 | 4.2 | 1.1 | |||||
| G007.22100.212 | 7.221 | 0.212 | 25.6 | 1.0 | |||||
| S32 | 7.294 | 2.044 | 6.0 | 1.1 | |||||
| G007.38000.264a | 7.380 | 0.264 | 31.8 | 1.1 | |||||
| G007.38000.264b | 7.380 | 0.264 | 9.7 | 1.1 | |||||
| G007.48500.188a | 7.485 | 0.188 | 48.4 | 1.1 | |||||
| G007.48500.188b | 7.485 | 0.188 | 3.7 | 1.1 | |||||
| G007.48500.188c | 7.485 | 0.188 | 31.5 | 1.1 |
Note. — Table 4 is available in its entirety in the electronic edition of the Astrophysical Journal. A portion is shown here for guidance regarding its form and content.
We additionally fit the helium and carbon RRLs. We detect 21 helium lines (Table 4) with a SNR as defined in Equation 1 of at least 5 and 16 carbon lines (Table 3) with a SNR of at least 3 (the narrow width of the carbon lines allows for a lower SNR threshold since it is less likely to be confused with background fluctuations). These data will be analyzed in a future publication; we provide them here for completeness. Although most of the carbon lines are weak, that they are found at the expected offset velocities gives us additional confidence in their detections. Due to its higher atomic mass, the helium line widths should be less than that of hydrogen, perhaps by 25% to 50% (depending on the amount of turbulence). The smoothing of 1.82 therefore has minimal impact on the derived helium line parameters. The carbon lines, however, are much narrower than those of hydrogen, due to carbon’s higher atomic mass and because carbon RRL originate in cooler H II region photo-dissociation regions.
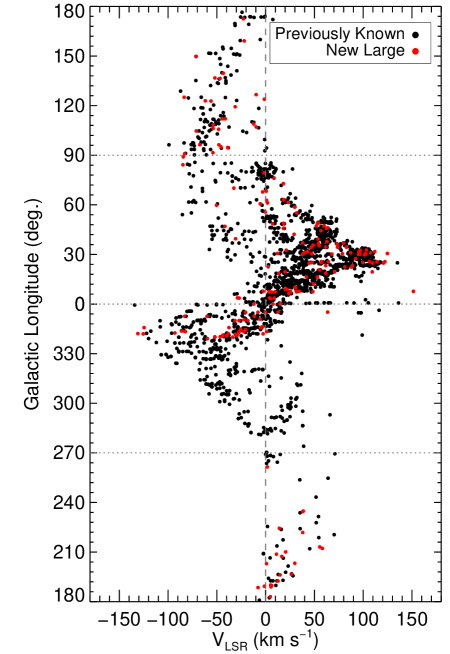
The new large regions appear to have a similar Galactic distribution compared with the previously-known sample of Galactic H II regions. This is also true of the “diffuse” region sample reported by Lockman et al. (1996). In Figure 3 we show the longitude-velocity location of the new large and previously-known regions compiled in the WISE Catalog. We note two slight discrepancies between the distributions. First, there are 21 new third-quadrant detections, versus 36 previously-known, a 37% increase in the known H II region population. Over the rest of the present survey, the 128 detections in the first, second, and fourth Galactic quadrants only represent a 9% increase in the known H II region population. Second, we only detect 10 negative-velocity H II regions (7%) in the first Galactic quadrant (restricted to ), whereas the combination of results from previous HRDS surveys gives 13%. Such regions have large Heliocentric distances and are located outside of the Solar orbit.
Since our regions were selected based on their angular sizes and not their physical sizes, these results are unsurprising. Because of our angular size selection criterion, we would expect that the nearer regions of the third quadrant are over-represented in our sample, whereas the more distant regions of the first-quadrant outer Galaxy are under-represented. Because we lack distances to a high fraction of the sample (see Section 4.2), we cannot test this hypothesis rigorously.
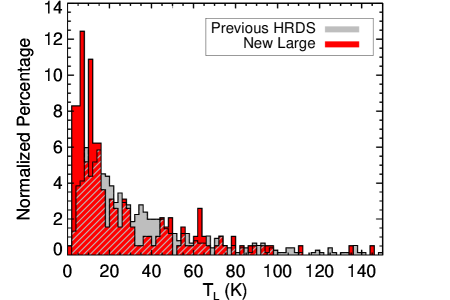
The distribution of hydrogen RRL peak line intensities for the new large region sample is shifted toward lower values compared with the previously-observed HRDS sample (Figure 4). Shown in this figure (and subsequent calculations) are the intensities of all hydrogen lines detected by the GBT, including all lines from multiple RRL sources. Previous HRDS surveys were conducted at X-band rather than C-band. For optically thin H II regions the observed antenna temperature is roughly proportional to the observing frequency. Based on this effect alone, the C-band RRLs should be brighter than the X-band RRLs by a factor of . Instead, the mean peak line intensity for the new large regions is 25 with a standard deviation of 26 , whereas for previous X-band HRDS surveys the values are 45 and 111 , respectively. This low average peak intensity value shows that the new sample contains many truly low surface brightness regions.
Of the 148 detections, 36 have spectra with multiple hydrogen RRL components at different velocities. In total, we detect emission from 201 hydrogen RRL components (112 sources with one line, 19 with two lines, and 17 with three lines). As in Anderson et al. (2015b), we hypothesize that one of these components is from the discrete H II region that we targeted and the other(s) are from diffuse ionized gas along the line of sight. In Anderson et al. (2015b) we derived a set of criteria that can be used to determine which RRL component is from the discrete H II region and which component originates from diffuse gas. Unfortunately, the lack of continuum data here restricts our ability to use some of these criteria. The application of the remaining criteria was not successful in determining which component arises from discrete H II regions. Because of this, we are unable to determine which component arises from the discrete H II regions.
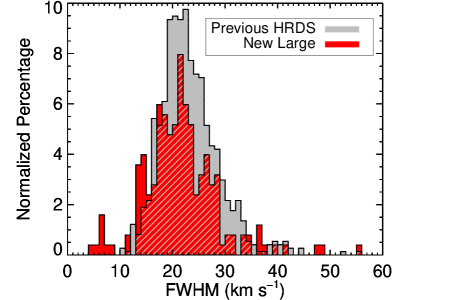
The RRL FWHM line widths of the current sample are lower on average compared with that of previous HRDS surveys. We show in Figure 5 histograms of the current sample of large regions (red) and those of previous HRDS surveys catalog (grey). The average FWHM for the new large regions is , whereas it is for the sample from previous X-band HRDS surveys. Although these values are similar within the standard deviations of the sample, a Kolmogorov-Smirnov (K-S) test shows that the two FWHM samples are statistically distinct. The difference is entirely due to the large regions with FWHM values (see below). If these are removed, the K-S test shows that the samples are not distinct.
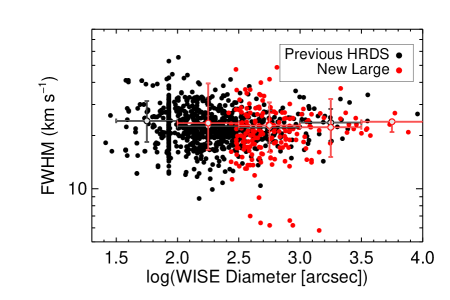
Our sample is large in angular size compared with that of previous HRDS surveys and a higher fraction of the nebulae have low RRL FWHM line widths. There is, however, no correlation between the angular size and the RRL FWHM. We therefore do not believe that these two quantities are causal. In Figure 6 we show the RRL FWHM values as a function of the WISE Catalog-defined angular diameter. Note that many large regions were contained in previous HRDS surveys, although they were not identified as such.
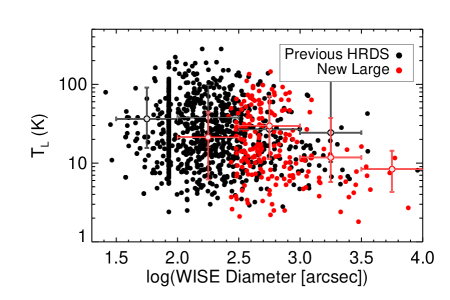
There is a weak relationship between the peak RRL line intensity and the WISE Catalog-defined angular diameter, as shown in Figure 7, such that the line intensity is lower on average for the larger regions. The relationship, although weak, is expected. H II regions expand as they evolve. Because the ionizing photon flux from OB stars is roughly constant throughout their main sequence lifetimes, their total ionized gas content is relatively constant. Therefore, their RRL intensities should decrease as their physical sizes increase.
4.1 Narrow Line Width Nebulae
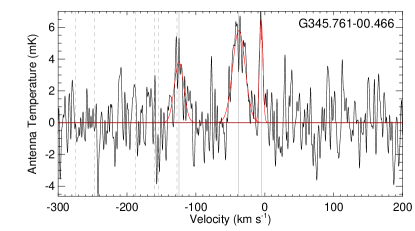
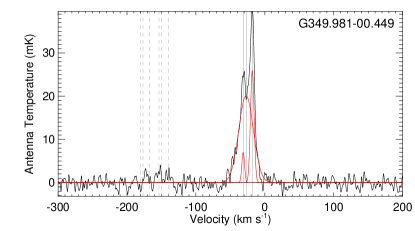
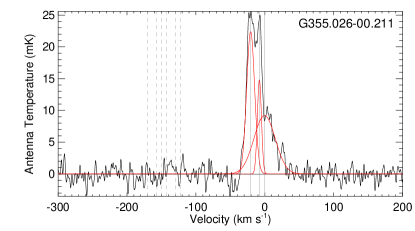
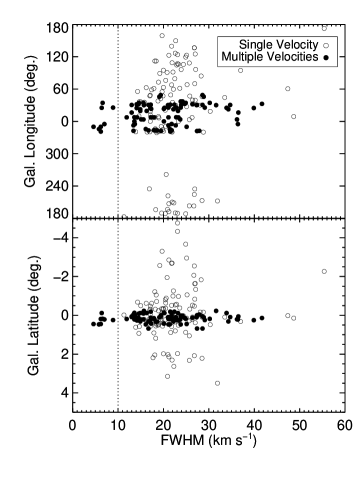
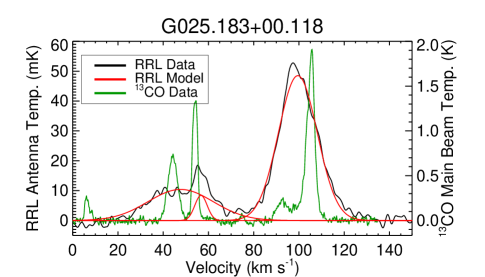
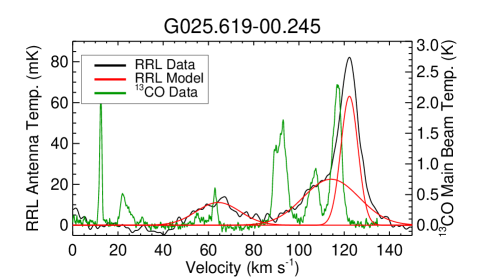
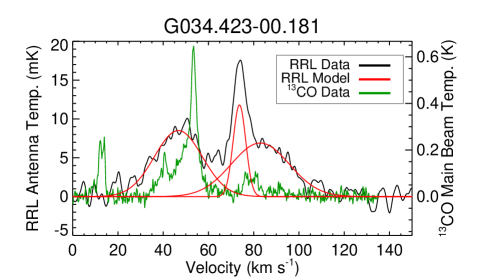
We detect the RRL emission from seven nebulae with FWHM line widths : G025.183+00.118, G025.61900.245, G034.42300.181, G341.12500.188, G345.76100.466, G349.98100.449 (two narrow RRL components), and G355.02600.211. The spectra for all seven sources, shown in Figure 8, have multiple RRL components. For all but G345.76100.466, the narrow component is blended with a broader component. Additionally, six of the seven nebulae have three velocity components, with only G341.12500.188 showing just two. In Figure 9, we show that all narrow-line sources are located toward in the inner Galaxy at low Galactic latitudes. The infrared morphologies of these seven sources are unremarkable; they look similar to other regions discovered in the HRDS.
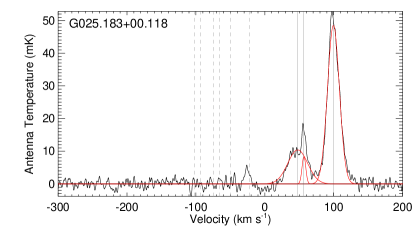
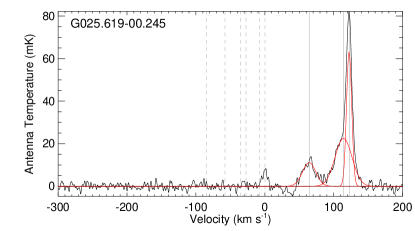
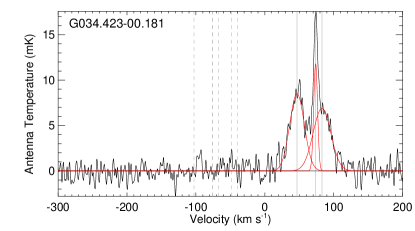
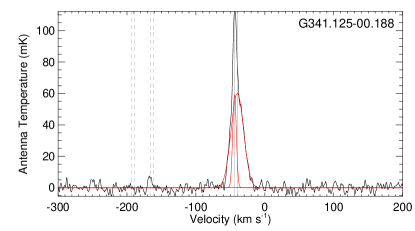
For each narrow-line source, we examine the individual single-polarization spectra H114 through H97 to verify that the narrow lines in the combined spectra are not due to radio frequency interference, instrumental artifacts, or some other transition within the bandpass. We fit Gaussian models to the individual spectra if the narrow lines are bright enough. The r.m.s. noise in individual spectra at a single polarization is , so the lines must be to be detectable. This limits the analysis to G025.61900.245, 341.12500.188, G349.98100.449, and G355.02600.211. For the narrow velocity components of these sources, the average derived FWHM values from the individual spectra differ by at most 20% from those from the combined spectra. This exercise provides confirmation that the narrow lines of these four sources are real, and furthermore that the narrow lines are seen in spectra taken with beam sizes from to .
If the line broadening is caused only by thermal motions, line widths between 5 and 10 corresponds to electron temperatures between 500 and 2200 . If the thermal and turbulent broadening contribute equally to the line widths, the thermal line widths are then between 3.5 and 7.1 , and the electron temperatures are between 300 and 1100 . We note that the lowest electron temperatures derived using RRL measurements of Galactic H II regions that have simple RRL profiles fit with single Gaussian models are near 6000 (Balser et al., 2011), as are those derived using optical emission lines (Deharveng et al., 2000).
There are many possible explanations for such narrow RRLs. Similarly narrow RRL profiles have been found at multiple positions in the W33 complex (Bieging et al., 1978), and have been argued to exist as a diffuse component of the Galactic disk (Lockman, 1980). The authors speculate that the narrow lines may be caused by interactions between ionized and molecular gas. The narrow lines may also arise from partially ionized hydrogen within the H II region PDRs, as has been discussed for W3 (Adler et al., 1996). In the case of W3, however, the line profiles for the partially ionized and fully ionized components are at the same velocity, whereas here ours are all offset. If these lines do arise from partially-ionized zones, the PDRs would have to be moving relative to the ionized gas. The offset between hydrogen (which traces the ionized gas) and carbon (which traces PDRs) RRL velocities is for Galactic H II regions (Wenger et al., 2013). If the narrow lines are from partially ionized zones, the relative motion of the ionized gas and the PDRs would be exceptional for Galactic H II regions. Runaway OB stars could also create large offsets between partially and fully ionized components, although there is no indication from the source morphologies that these regions are powered by runaway OB stars. Onello et al. (1995) observed very narrow RRLs () toward the source G70.7+1.2 and concluded that the narrow lines may be caused by cold gas near the outer boundary of a bow shock. This object is unusual in many respects and this therefore cannot be a good explanation for the narrow lines discovered here.
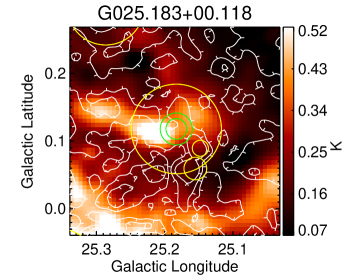
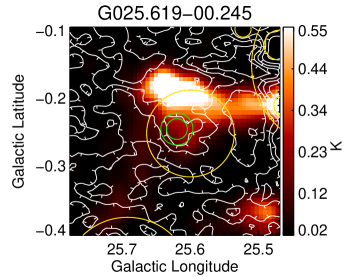
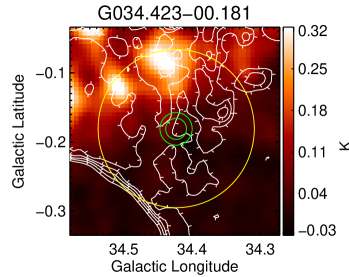
We find that although there is molecular emission at the narrow-RRL velocities, there is no strong indication that the 13CO and narrow line components are related. We examine 13CO data from the Galactic Ring Survey (GRS; Jackson et al., 2006) for the three regions within the GRS survey area: G025.183+00.118, G025.61900.245, and G034.42300.181. We show the spectra and position-position images of 13CO intensity in Figure 10. We created the position-position images by averaging over the narrow RRL velocity range. The molecular emission looks similar to that of other angularly-large H II regions analyzed previously in Anderson et al. (2009). Furthermore, the observed locations are far away from the PDRs enclosed by the red circles. These data are too confusing to provide evidence on the subject of whether the narrow-lines are coming from interactions with molecular clouds or from partially ionized zones within the H II region PDRs.
Although we do not have a suitable explanation for these narrow-line regions, one clue may be that they all have multiple hydrogen RRL components and are located in the inner Galaxy. This may be coincidence, or may indicate that the narrow RRL components may be caused in some way by the WIM. The WIM also exists in the inner Galaxy and is the source of many additional RRL components detected in observations of H II regions (Anderson et al., 2015b). There were four narrow-line sources with FWHM in the HRDS survey of Anderson et al. (2015a), and all four have multiple RRL line components and exist in the inner Galaxy. There was only one such narrow RRL source in the original HRDS (Anderson et al., 2011), and it too was a multiple RRL source in the inner Galaxy.
4.2 Distances
We derive kinematic distances for 45 of the detected H II regions, 35 of which lie in the outer Galaxy (). The results of our kinematic distance analysis, in addition to the numbers of regions known previously, are summarized in Table 4.2, which lists the source name, the LSR velocity, the near, far, and tangent point distances, the Galactocentric radius, the tangent point velocity, the kinematic distance ambiguity resolution (“KDAR;” “T” = tangent point distance, “O” = outer Galaxy), the Heliocentric distance, the Heliocentric distance uncertainty computed from the Anderson et al. (2014) model, and the vertical distance, , from the Galactic mid-plane. The Anderson et al. (2014) distance uncertainty model includes contributions from streaming motions, the uncertainty in the “true” rotation curve model, and uncertainty in the Solar rotation parameters.
Kinematic distances use a model for Galactic rotation to derive distances as a function of observed velocity for a given line of sight. Here we use the Brand & Blitz (1993) rotation curve. Kinematic distances are prone to large uncertainties in certain parts of the Galaxy. As in previous work, we estimate kinematic distance uncertainties by adding in quadrature the uncertainties associated with the rotation curve choice, streaming motions of 7 , and changes to the Solar circular rotation speed. Such uncertainties were first computed by Anderson et al. (2012a), and expanded to the entire Galaxy by Anderson et al. (2014). We use the latter analysis here.
We do not compute kinematic distances for sources within of the Galactic center or within of the Galactic anti-center because such distances would be uncertain by (Anderson et al., 2014). We also exclude H II regions with multiple RRL velocities for which the source velocity is unknown, as they have at least two possible kinematic distances. We exclude sources in the first and fourth Galactic quadrants for which the absolute value of the tangent point velocity is less than 10 . Finally, we also do not provide distances to regions whose distance uncertainties as computed using the model of Anderson et al. (2014) are that of their kinematic distances.
Sources in the inner Galaxy suffer from the well-known kinematic distance ambiguity (KDA): inner Galaxy H II regions have two possible Heliocentric distances (called “near” and “far”) for each measured velocity. The KDA does not exist for the 35 Outer Galaxy H II regions in our sample (including the seven first-quadrant sources with negative RRL velocities and the seven fourth quadrant sources with positive velocities). For all these regions, there is no ambiguity in the calculation of Galactocentric distances.
There are 75 inner-Galaxy single-velocity H II regions in our sample. The large regions detected here are too faint for H I Emission/Absorption analyses using extant H I data (e.g. Anderson & Bania, 2009; Anderson et al., 2012a). Additionally, large H II regions have poor associations with molecular gas (Anderson et al., 2009), which makes using the H I self-absorption technique difficult to use. As a result of these difficulties, we do not attempt to resolve the kinematic distance ambiguity (KDA) for any of the detected regions. All of the kinematic distance ambiguity resolutions (KDARs) are therefore for regions that have RRL velocities within 10 of the tangent point velocity; we place these 11 nebulae at the tangent point distance. To determine distances to the other 75 nebulae we would need more sensitive H I observations.
4.3 Extremely Luminous H II Regions
In Section 1 we mentioned the H II region G52L, which despite being extremely luminous was missed by many previous H II region surveys. There are no equally luminous nebulae in the present survey, although we lack distances and hence luminosities for many sources. We did, however, identify G039.515+00.511 (Figure 2), which has a VGPS 21 cm continuum flux density of and a WISE-identified angular diameter of . At a distance of 16.3 , its physical diameter is 80 . Using the relationship in Rubin (1968), we compute an ionizing photon emission rate of s-1, which is 60% that of G52L, and double that of the next most luminous nebula in the present survey. This is equivalent to the ionization rate of one O4 star, or five O7 stars (Sternberg et al., 2003). Although not as luminous as G52L, this ionization rate places it in the top 1% of all Galactic H II regions discovered to date (J. Mascoop, 2017, in prep.).
We detected the RRL emission from three additional nebulae with WISE-defined angular diameters : G070.099+01.629 (S99; 105 ), G090.856+01.691 (115 ), and G094.890-01.643 (130 ). The luminosities of these regions are much lower that of G039.515+00.511. These are among the largest H II regions known in the Milky Way. For example, there are only five other regions with diameters in the WISE Catalog.
5 Summary
We detected hydrogen RRL emission from 148 new large Galactic H II regions located north of declination ( at ). These regions were drawn from the WISE Catalog of Galactic H II Regions, and all have infrared angular diameters . We also detect the helium RRLs from 21 of the nebulae, and carbon RRLs from 16.
The regions are on average fainter than those of previous H II region surveys, larger in angular size, and have narrower RRL line widths. We discover seven regions with line widths , which implies nebular electron temperatures if half the line width is due to turbulence. We do not have a satisfactory explanation for these low line width sources. Previous authors have speculated that the narrow lines may be caused by interactions with nearby molecular clouds or by partially ionized zones in the H II region photo-dissociation regions. We note that all but one of the narrow-line regions has three hydrogen RRL components, and all are located toward the inner Galaxy.
We find one extremely luminous outer-Galaxy H II region, G039.515+00.511, which is one of the most luminous H II regions known in the Galaxy. We also detect the RRL emission from three of the largest known Galactic H II regions, G070.099+01.629 (S99; 105 ), G090.856+01.691 (115 ), and G094.89001.643 (130 ).
This survey completes the HRDS Northern census of Galactic H II regions. The Northern HRDS surveys have together discovered 887 new Galactic H II regions, whereas prior to the HRDS, the previously known sample over the same area compiled in the WISE Catalog numbered just 716.
Appendix A Web Sites
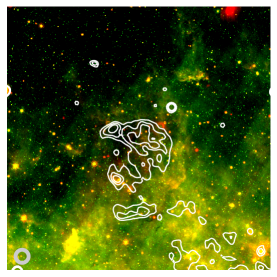
We have updated the GBT HRDS website with the results reported here222http://go.nrao.edu/hrds. This site contains images such as those in Figure 2 for all detected sources, as well as the same for all previous HRDS surveys. We have also updated the WISE Catalog of Galactic H II Regions web site333http://astro.phys.wvu.edu/wise with results from these observations.
References
- Adler et al. (1996) Adler, D. S., Wood, D. O. S., & Goss, W. M. 1996, ApJ, 471, 871
- Alves et al. (2012) Alves, M. I. R., Davies, R. D., Dickinson, C., Calabretta, M., Davis, R., & Staveley-Smith, L. 2012, MNRAS, 422, 2429
- Anderson et al. (2015a) Anderson, L. D., Armentrout, W. P., Johnstone, B. M., Bania, T. M., Balser, D. S., Wenger, T. V., & Cunningham, V. 2015a, ApJS, 221, 26
- Anderson & Bania (2009) Anderson, L. D., & Bania, T. M. 2009, ApJ, 690, 706
- Anderson et al. (2014) Anderson, L. D., Bania, T. M., Balser, D. S., Cunningham, V., Wenger, T. V., Johnstone, B. M., & Armentrout, W. P. 2014, ApJS, 212, 1
- Anderson et al. (2011) Anderson, L. D., Bania, T. M., Balser, D. S., & Rood, R. T. 2011, ApJS, 194, 32
- Anderson et al. (2012a) —. 2012a, ApJ, 754, 62
- Anderson et al. (2009) Anderson, L. D., Bania, T. M., Jackson, J. M., Clemens, D. P., Heyer, M., Simon, R., Shah, R. Y., & Rathborne, J. M. 2009, ApJS, 181, 255
- Anderson et al. (2015b) Anderson, L. D., Hough, L. A., Wenger, T. V., Bania, T. M., & Balser, D. S. 2015b, ApJ, 810, 42
- Anderson et al. (2012b) Anderson, L. D., et al. 2012b, A&A, 542, A10
- Balser (2006) Balser, D. S. 2006, AJ, 132, 2326
- Balser et al. (2016) Balser, D. S., Anish Roshi, D., Jeyakumar, S., Bania, T. M., Montet, B. T., & Shitanishi, J. A. 2016, ApJ, 816, 22
- Balser et al. (2011) Balser, D. S., Rood, R. T., Bania, T. M., & Anderson, L. D. 2011, ApJ, 738, 27
- Bania et al. (2016) Bania, T., Wenger, T., Balser, D., & Anderson, L. 2016, TMBIDL: Single dish radio astronomy data reduction package, Astrophysics Source Code Library
- Bania et al. (2012) Bania, T. M., Anderson, L. D., & Balser, D. S. 2012, ApJ, 759, 96
- Bania et al. (2010) Bania, T. M., Anderson, L. D., Balser, D. S., & Rood, R. T. 2010, ApJ, 718, L106
- Bieging et al. (1978) Bieging, J. H., Pankonin, V., & Smith, L. F. 1978, A&A, 64, 341
- Bihr et al. (2016) Bihr, S., et al. 2016, A&A, 588, A97
- Brand & Blitz (1993) Brand, J., & Blitz, L. 1993, A&A, 275, 67
- Brown et al. (2017) Brown, C., et al. 2017, ArXiv e-prints
- Condon et al. (1998) Condon, J. J., Cotton, W. D., Greisen, E. W., Yin, Q. F., Perley, R. A., Taylor, G. B., & Broderick, J. J. 1998, AJ, 115, 1693
- Deharveng et al. (2000) Deharveng, L., Peña, M., Caplan, J., & Costero, R. 2000, MNRAS, 311, 329
- Dyson & Williams (1997) Dyson, J. E., & Williams, D. A. 1997, The physics of the interstellar medium (The physics of the interstellar medium. Edition: 2nd ed. Publisher: Bristol: Institute of Physics Publishing, 1997. Edited by J. E. Dyson and D. A. Williams. Series: The graduate series in astronomy. ISBN: 0750303069)
- Ghigo et al. (2001) Ghigo, F., Maddalena, R., Balser, D., & Langston, G. 2001, GBT Commissioning Memo 10
- Gordon (1976) Gordon, M. A. 1976, in Methods of Experimental Physics: Volume 12: Astrophysics, Part C: Radio Observations, ed. M. L. Meeks (Academic Press), 277–283
- Haffner et al. (2003) Haffner, L. M., Reynolds, R. J., Tufte, S. L., Madsen, G. J., Jaehnig, K. P., & Percival, J. W. 2003, ApJS, 149, 405
- Haffner et al. (2009) Haffner, L. M., et al. 2009, Reviews of Modern Physics, 81, 969
- Jackson et al. (2006) Jackson, J. M., et al. 2006, ApJS, 163, 145
- Lenz & Ayres (1992) Lenz, D. D., & Ayres, T. R. 1992, PASP, 104, 1104
- Lockman (1980) Lockman, F. J. 1980, in Astrophysics and Space Science Library, Vol. 80, Radio Recombination Lines, ed. P. A. Shaver, 185–204
- Lockman et al. (1996) Lockman, F. J., Pisano, D. J., & Howard, G. J. 1996, ApJ, 472, 173
- Murray & Rahman (2010) Murray, N., & Rahman, M. 2010, ApJ, 709, 424
- Onello et al. (1995) Onello, J. S., Depree, C. G., Phillips, J. A., & Goss, W. M. 1995, ApJ, 449, L127
- Ott et al. (1994) Ott, M., Witzel, A., Quirrenbach, A., Krichbaum, T. P., Standke, K. J., Schalinski, C. J., & Hummel, C. A. 1994, A&A, 284, 331
- Prestage et al. (2015) Prestage, R. M., et al. 2015, in 2015 URSI-USNC Radio Science Meeting, 19-24 July 2015, Vancouver, BC, Canada
- Roshi et al. (2012) Roshi, D. A., Plunkett, A., Rosero, V., & Vaddi, S. 2012, ApJ, 749, 49
- Rubin (1968) Rubin, R. H. 1968, ApJ, 154, 391
- Salem & Brocklehurst (1979) Salem, M., & Brocklehurst, M. 1979, ApJS, 39, 633
- Sternberg et al. (2003) Sternberg, A., Hoffmann, T. L., & Pauldrach, A. W. A. 2003, ApJ, 599, 1333
- Stil et al. (2006) Stil, J. M., et al. 2006, AJ, 132, 1158
- Taylor et al. (2003) Taylor, A. R., et al. 2003, AJ, 125, 3145
- Wenger et al. (2013) Wenger, T. V., Bania, T. M., Balser, D. S., & Anderson, L. D. 2013, ApJ, 764, 34
- Wright et al. (2010) Wright, E. L., et al. 2010, AJ, 140, 1868