Information measure for financial time series:
quantifying short-term market heterogeneity
Abstract
A well-interpretable measure of information has been recently proposed based on a partition obtained by intersecting a random sequence with its moving average. The partition yields disjoint sets of the sequence, which are then ranked according to their size to form a probability distribution function and finally fed in the expression of the Shannon entropy. In this work, such entropy measure is implemented on the time series of prices and volatilities of six financial markets. The analysis has been performed, on tick-by-tick data sampled every minute for six years of data from 1999 to 2004, for a broad range of moving average windows and volatility horizons. The study shows that the entropy of the volatility series depends on the individual market, while the entropy of the price series is practically a market-invariant for the six markets. Finally, a cumulative information measure - the ‘Market Heterogeneity Index’- is derived from the integral of the proposed entropy measure. The values of the Market Heterogeneity Index are discussed as possible tools for optimal portfolio construction and compared with those obtained by using the Sharpe ratio a traditional risk diversity measure.
1 Introduction
Several connections between economics and statistical thermodynamics have been suggested over the years. Marginal utility and disutility have been related respectively to force, energy and workfisher1892mathematical . Differential pressure and volume in an ideal gas have been linked to price and volume in financial systems samuelson1972maximum . Analogies have been put forward between money utility and entropy lisman1949econometrics and between temperature and velocity of circulation of money pikler1955utility . As a result of the growing diversification and globalization of economy, applications of entropy concepts to finance and economics are receiving renewed attention as instruments to monitor and quantify market diversity chen2015unity ; le2006evaluating ; ponta2011information ; zhou2013applications ; ormos2014entropy ; yu2014diversified ; sheraz2015entropy ; pola2016entropy ; contreras2017construction ; bekiros2017information ; chen2017study . Heterogeneity of private and institutional investments, might result at a microscopic level, among other effects, in imperfect and asymmetric flow of information, ultimately undermining the theory of efficient market with its assumption of a homogeneous random process underlying the stock prices dynamics fama1970efficient .
In the last decades, the interplay of noise and profitability with specific focus on volatility investment strategies has therefore gained interest and is under intense scrutiny gunasekarage2001profitability ; menkhoff2007obstinate ; frommel2016does ; smith2016sentiment . Volatility series exhibit remarkable features suggesting the existence of some amount of ‘order’ out of the seemingly random structure. The degree of ‘order’ is intrinsically linked to the information, embedded in the volatility patterns, whose extraction and quantification might shed light on microscopic phenomena in finance zhou2013applications ; yu2014diversified ; ormos2014entropy ; sheraz2015entropy ; pola2016entropy ; bekiros2017information ; contreras2017construction ; chen2017study . The Volatility Index (VIX), defined as the near-term volatility conveyed by stock index option prices, has been suggested to monitor investor sentiment. VIX futures and options have been introduced as trading instruments. The Chicago Board Options Exchange (http://www.cboe.com/) calculates and updates the values of more than 25 indexes designed to measure the expected volatility of different securities.
In this scenario, new tools for portfolio optimization and asset pricing should be designed on the basis of the expected volatility to evaluate market performances at microscopic level, beyond the figures of risk provided by more traditional techniques.
In this work, the information measure approach proposed in carbone2013information ; carbone2007scaling ; carbone2004analysis is applied to prices and volatilities of tick-by-tick data, recorded from 1999 to 2004, of six financial markets. The investigation is performed over a broad range of volatility and moving average windows. Remarkably, it is found that the entropy of the volatility series takes different values for the different markets as opposed to the entropy of the prices, which is mostly constant and consistent with a homogeneous random walk structure of the time series. In order to provide a compact visualization of the results and a clear procedure for practically uses of the proposed approach, a market heterogeneity index (MIX) is introduced, defined on the basis of the integral of the entropy functional. MIX estimates are provided for prices and volatilities of the six financial markets, over different volatility horizons and moving average windows. The values of the index are finally compared with the results obtained by using the Sharpe ratio, a traditional estimate of portfolio risk.
2 Entropy
The definition of entropy, adopted in the framework of this work carbone2013information ; carbone2007scaling ; carbone2004analysis , stem from the idea of Claude Shannon to quantify the ‘expected’ information contained in a message extracted from a sequence shannon1948mathematical by using the functional:
| (2.1) |
with a probability distribution function associated with the time sequence . Different approaches have been proposed for the evaluation of the entropy of a random sequence (see Refs. grassberger1983characterization ; pincus1991approximate ; bandt2002permutation ; rosso2007distinguishing ; crutchfield2012between ; marcon2014generalization for a few examples of entropy measures). The preliminary but fundamental step is the symbolic representation of the data, through a partition suitable to map the continuous phase-space into disjoint sets. The method commonly adopted for partitioning a sequence is based on a uniform division in blocks having equal size. Then the entropy is estimated over subsequent partitions corresponding to different block sizes grassberger1983characterization . The choice of the optimal partition is not a trivial task, as it is crucial to effectively discriminate between randomness/determinism of the encoded/decoded data (see Section III of Ref.daw2003review for a short review of the partition methods).
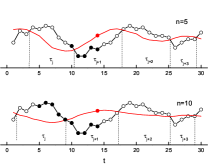
Here, the partition is obtained by taking the intersection of with the moving average for different moving average window carbone2013information ; carbone2007scaling ; carbone2004analysis . For each window , the subsets between two consecutive intersections are ranked according to their size to obtain the probability distribution function . The elements of these subsets are the segments between consecutive intersections and have been named clusters (see the illustration shown in Fig. 1). The present approach directly yields either power-law or exponential distributed blocks (clusters), thus enabling us to separate the sets of inherently correlated/uncorrelated blocks along the sequence. Moreover, the clusters are exactly defined as the portions of the series between death/golden crosses according to the technical trading rules. Therefore, the information content has a straightforward connection with the trader’s view of the price and volatility series.
For the sake of clarity, the main relationships relevant to the investigation carried in this paper will be shortly recalled in the next paragraphs.
Consider the time series of length and the moving average of length with the moving average window. The function generates, for each , a partition of non-overlapping clusters between two consecutive intersections of and . Each cluster has duration:
| (2.2) |
where the instance and refer to two subsequent intersections as shown in Fig.1.
The probability distribution function can be obtained by ranking the number of clusters according to their length for each .
For a fractional Brownian motion, a stationary sequence of self-affine clusters is generated with probability distribution function varying as carbone2013information :
| (2.3) |
with the factor taking the form , to account for the finite size effects when , resulting in the drop-off of the power-law and the onset of the exponential decay.
By using Eq. (2.3), Eq. (2.1) writes (the details of the derivation can be found in carbone2013information ; carbone2004analysis ):
| (2.4) |
where is a constant, and are related respectively to the terms and .
The constant in Eq. (2.4) can be evaluated as follows: in the limit , consistently with the minimum value of the entropy that corresponds to a fully ordered (deterministic) set of clusters with same duration . The maximum value of the entropy is then obtained when with the maximum length of the sequence. This condition corresponds to the maximum randomness (minimum information) carried by the sequence, when a single cluster is obtained coinciding with the whole series.
Since the exponent is equal to the fractal dimension with the Hurst exponent of the time series, the term in Eq. (2.4) can be interpreted as a generalized form of the Boltzmann entropy , where can be thought of the volume occupied by the fractional random walker.
The term in Eq. (2.4) represents an excess entropy (excess noise) added to the intrinsic entropy term by the partition process. It depends on and is related to the finite size effect discussed above. This issue has been discussed in carbone2013information , while the general issue of the finite size effects on entropy measure has been discussed in Refs. herzel1994finite ; grassberger1988finite ; stammler2016correcting ; levina2017subsampling
The method and Eqs. (2.1 - 2.4) have been applied for estimating the probability distribution function and the entropy of the 24 nucleotide sequences of the human chromosomes in carbone2013information . It is worth noting that the characteristic sizes and (respectively cluster length and duration) are equivalent from a statistical point of view. However, from the meaning viewpoint, the cluster duration is more suitable than the length when dealing with time series . Furthermore, the duration is particularly relevant to financial market series, due to its straightforward connection to the duration of the investment horizon via the volatility window and the moving average window , entering as parameters in the above calculation.
Before entering the details of the application of the method to the six financial indexes, it is worthy to clarify the implication of partitioning a random sequence by either using boxes having equal size or by using the clusters obtained through the intersection with the moving average. For same size boxes, the excess noise term vanishes, thus the entropy reduces to the logarithmic term (see Eq. (8) in Ref. grassberger1983characterization ). The logarithmic term corresponds to the intrinsic entropy of an ideal fractional random walk of dimension . When a moving average partition is used, an excess entropy term emerges accounting for the additional heterogeneity introduced by the random partitioning process (operated by the moving average partition). This is not a detail especially for financial applications as it represents the disorder specifically introduced by this trading mechanism.
3 Results
The information measure described in the previous section is here applied to financial prices and volatilities of six market indices (BOBL, BUND, DAX, Euro Currency, Euro Stoxx and FIB30). For each index, the data set includes tick-by-tick prices sampled every minute from 4 January 1999 to 24 March 2004. The length of the series is set for all the six markets equal to 517041, determined on the basis of the length of the shortest series which is the Eurocurrency. The six time series are shown in Fig. 2. Further details are provided in the Supplementary Material.
Among other reasons, the main motivation for selecting the six markets mentioned above is the fact that they operate in a very similar socio-economic context, being all traded within the EU zone. This rules out that the diversity featured by the entropy measure might stem from exogenous drives rather than from the intrinsic dynamics of the market.
In this work, the continuously compounded return:
| (3.1) |
and the log-return:
| (3.2) |
have been considered, with and the maximum length of the time series.
The volatility has been taken as:
| (3.3) |
where are the above defined return, the volatility window, the average value of the return taken over the window . It is well known that the volatility definition is not univocal, however this work has been focused on Eq. (3.3).
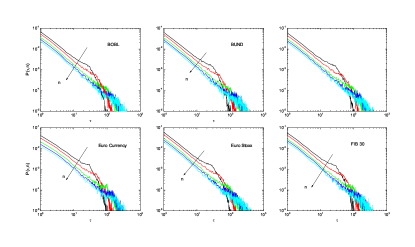
Next, the series of the prices of the six markets, shown in Fig. 2, are used to calculate the probability distribution functions and the entropy according to the procedure described in the previous section. The probability for the six price series is shown in Fig. 3. For the clarity of visualization, only the curves corresponding to moving average windows , , , , are plotted, though the analysis has been performed for ranging between and . The curves exhibit a power law behaviour for , and an exponential decay, for , respectively. The exponents agree with the theoretical prediction expected for fractional Brownian motions. The curves shown in Fig. 3 are thus consistent with Eq. (2.3) over the whole range of investigated values.
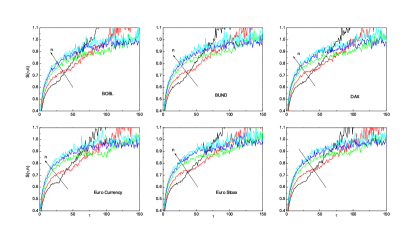
Fig. 4 shows the entropy calculated by using the probability distribution functions plotted in Fig. 3. The curves correspond to moving average values , , , , . The range of investigated moving average windows is much broader (from to ) but it is not shown for visualization clarity. The behavior of the curves is quite carefully reproduced by Eq. (2.4): the first part increases as a logarithmic function, then for a sharp increase is observed corresponding to the onset of the linear term . One can note that is -invariant for small values of , while its slope decreases as at larger , as expected according to Eq. (2.4), meaning that clusters with duration are not power-law correlated, due to the finite-size effects introduced by the partition with window . Hence, they are characterized by a value of the entropy exceeding the curve , which corresponds to power-law correlated clusters. It is worthy to remark that clusters with same duration can be generated by different values of the moving average window . For constant , larger entropy values are obtained as increases.
Next, the probability distribution function and the entropy have been calculated for a large set of volatility series. and have been calculated for (i) linear return and (ii) logarithmic return with volatility window ranging from half a trading day to 20 trading days. In particular , , , , , , , , , , , have been analysed, that correspond to half a business day, one to ten business days and one business month, respectively.
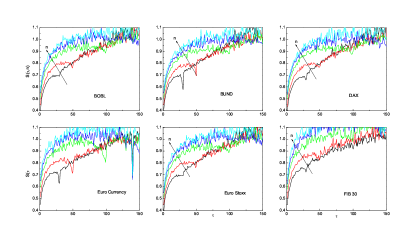
The entropy for the volatility of logreturn with is shown in Fig. 5 for the six markets. By comparing the results shown in Fig. 5 and in Fig. 4, one can note a general increase of the entropy curves of the volatilities compared to those of the prices. Such an increase has been systematically found in all the series analysed, both for linear and logarithmic return with diverse volatilities windows .
The sharp drop of the entropy is related to a deviation of the probability distribution function of the real time series from the behavior predicted on the basis of the Eq. (3) deduced for an ideal fractional Brownian motion. The deviation is related to the reduced randomness and data redundancy in the series. These issues are in particular enhanced when the data are fed in the volatility relationship (Eq. (7)) which, as a variance, enhances the variability compared to that of the prices.


To better quantify the behaviour of prices and volatilities of the different markets, we have introduced a cumulative information heterogeneity index defined as follows:
| (3.4) |
The function has been plotted in Fig. 6 for the prices (a) and the volatilities with linear (b) and logarithmic return (c). The function is almost constant for the prices of the six markets (a), conversely it takes different values for the volatilities (b,c).
In order to compare the obtained results with traditional portfolio risk estimator, the quantity has been calculated as the integral of the function over :
| (3.5) |
The MIX is a cumulative figure of heterogeneity suitable to quantify the reduced information content (excess entropy) and make a comparison across the different markets. The absolute value of the market heterogeneity index (MIX) has been plotted in Fig. 7 for the six markets. In particular the data in Fig. 7 (a) corresponds to integrals under the curves shown in Fig. 6 (a) for the prices. The data of Fig. 7 (b) correspond to the integrals of the volatility curves with linear return shown in Fig. 6 (b). The data of Fig. 7 (c) correspond to the integrals of the volatility curves with the logarithmic return shown in Fig. 6 (c). Different symbols corresponds to the different volatility windows, namely (circles), (squares), (up triangles), (down triangles). Consistenly with the results shown in Fig. 6, a strong variability of the MIX is observed for the volatility curves (b,c) compared to prices (a). It is worthy of note that the investment horizon of the current entropy measure is defined by the range of the cluster duration i.e of the order or smaller than the maximum moving average window . Conversely, the optimization based on the Sharpe ratio refers to the whole duration of the financial data series. Therefore the time scale of the proposed measure refers to a short term investment horizon (day-by-day trading).
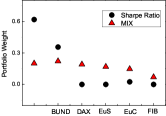
Next we will discuss the issue that the information heterogeneity index evaluated on volatility (with linear or logarithmic return) can be used for constructing the weights of a portfolio asset. By using the MIX strategy, the fraction of investments in each market normalized to 1 can be obtained by taking the values . These values are shown in Fig. 8 (up triangles) for the MIX values shown in Fig. 7 (b). In Fig. 8 the weights of an efficient portfolio that maximize the Sharpe Ratio are shown for comparison (circles). The Sharpe Ratio is a measure for calculating risk-adjusted return. It is the average return earned in excess of the risk-free rate per unit of volatility or total risk:
| (3.6) |
where is the expected portfolio return, the risk free rate and the portfolio standard deviation. Generally, the greater the value of the Sharpe ratio, the more attractive the risk-adjusted return. The values have been obtained by using the Sharp Ratio optimazation tool provided by MATLAB. The portfolio weights obtained via the MIX startegy and the Sharpe ratio are shown in Table 1. There is a very good correspondence between the weights obtained with the two strategy. It is worth noting that the portfolio that maximizes the Sharpe ratio correspond to a strategy limited to only 3 out of the 6 markets, as opposed to the MIX strategy that has a smoother variation of the weights.
Conclusion
The implementation of the moving average algorithm to estimate the Shannon entropy of a long-range correlated sequence has been illustrated to analyse the tick-by-tick data of six markets BOBL, BUND, DAX, Euro Currency, Euro Stoxx and FIB30 from 1999 to 2004. By considering several runs of the algorithm for the different parameters (mainly moving average and volatility windows) this study has systematically shown, the entropy measured on the price is practically market invariant, whereas the entropy of the volatilities is market dependent. A cumulative market heterogeneity index (MIX) has been built and its values compared with those of a standard risk measure (the Sharpe ratio). Compared to the Sharpe ratio, the MIX index provide a more accurate and smooth evaluation of the portfolio composition, that might be an advantage for practical applications of the entropy measure. The novelty of the present approach resides in the method used for partitioning the sequence which allows one to separate the sets of inherently informative/uninformative clusters along the sequence. Moreover, the clusters are exactly defined as the portions of the series between death/golden crosses according to the technical traders rules. Therefore, the information content quantified by this approach is intimately linked to technical trader’s viewpoint on the analysed markets. The six markets used in this study have been chosen because they operate in close socio-economic contexts within the EU. The similarity of the external context permits to rule out external causes as the source of the market heterogeneity, while ensuring that the diversity is due to endogenous processes. The current work will be extended to evaluate extended portfolio including markets beyond Europe and other volatile assets.
References
- (1) Fisher I. Mathematical investigations in the theory of value and prices. Yale University. 1892.
- (2) Samuelson PA. Maximum principles in analytical economics: Nobel Lecture 1970. The American Economic Review. 1972;62(3):249–262.
- (3) Lisman JH. Econometrics and thermodynamics: a remark on Davis’ theory of budgets. Econometrica: Journal of the Econometric Society. 1949; p. 59–62.
- (4) Pikler AG. Utility theories in field physics and mathematical economics (II). The British Journal for the Philosophy of Science. 1955;5(20):303–318.
- (5) Chen J. The unity of science and economics: A new foundation of economic theory. Springer; 2015.
- (6) Le Gallo J, Dall’Erba S. Evaluating the temporal and spatial heterogeneity of the European convergence process, 1980–1999. Journal of Regional Science. 2006;46(2):269–288.
- (7) Ponta L, Pastore S, Cincotti S. Information-based multi-assets artificial stock market with heterogeneous agents. Nonlinear Analysis: Real World Applications. 2011;12(2):1235 – 1242. doi:http://dx.doi.org/10.1016/j.nonrwa.2010.09.018.
- (8) Zhou R, Cai R, Tong G. Applications of entropy in finance: A review. Entropy. 2013;15(11):4909–4931.
- (9) Ormos M, Zibriczky D. Entropy-based financial asset pricing. PloS one. 2014;9(12):e115742.
- (10) Yu JR, Lee WY, Chiou WJP. Diversified portfolios with different entropy measures. Applied Mathematics and Computation. 2014;241:47–63.
- (11) Sheraz M, Dedu S, Preda V. Entropy Measures for Assessing Volatile Markets. Procedia Economics and Finance. 2015;22:655–662.
- (12) Pola G. On entropy and portfolio diversification. Journal of Asset Management. 2016;17(4):218–228.
- (13) Contreras J, Rodríguez YE, Sosa Al. Construction of an efficient portfolio of power purchase decisions based on risk-diversification tradeoff. Energy Economics. 2017;64:286–297.
- (14) Bekiros S, Nguyen DK, J L S, Uddin GS. Information diffusion, cluster formation and entropy-based network dynamics in equity and commodity markets. European Journal of Operational Research. 2017;256(3):945–961.
- (15) Chen X, Tian Y, Zhao R. Study of the cross-market effects of Brexit based on the improved symbolic transfer entropy GARCH model—An empirical analysis of stock–bond correlations. PloS one. 2017;12(8):e0183194.
- (16) Fama EF. Efficient capital markets: A review of theory and empirical work. The Journal of Finance. 1970;25(2):383–417.
- (17) Gunasekarage A, Power DM. The profitability of moving average trading rules in South Asian stock markets. Emerging Markets Review. 2001;2(1):17–33.
- (18) Menkhoff L, Taylor MP. The obstinate passion of foreign exchange professionals: technical analysis. Journal of Economic Literature. 2007;45(4):936–972.
- (19) Frömmel M, Lampaert K. Does frequency matter for intraday technical trading? Finance Research Letters. 2016;18:177–183.
- (20) Smith DM, Wang N, Wang Y, Zychowicz EJ. Sentiment and the effectiveness of technical analysis: Evidence from the hedge fund industry. Journal of Financial and Quantitative Analysis. 2016;51(6):1991–2013.
- (21) Carbone A. Information Measure for Long-Range Correlated Sequences: the Case of the 24 Human Chromosomes. Scientific Reports. 2013;3:2721.
- (22) Carbone A, Stanley HE Scaling properties and entropy of long-range correlated time series Physica A: Statistical Mechanics and its Applications 384 (1), 21-24
- (23) Carbone A, Castelli G, Stanley HE. Analysis of clusters formed by the moving average of a long-range correlated time series. Phys Rev E. 2004;69:026105. doi:10.1103/PhysRevE.69.026105.
- (24) Shannon CE. A mathematical theory of communication, Part I, Part II. Bell Syst Tech J. 1948;27:623–656.
- (25) Grassberger P, Procaccia I. Characterization of strange attractors. Physical Review Letters. 1983;50(5):346.
- (26) Pincus SM. Approximate entropy as a measure of system complexity. Proceedings of the National Academy of Sciences. 1991;88(6):2297–2301.
- (27) Bandt C, Pompe B. Permutation entropy: a natural complexity measure for time series. Physical Review Letters. 2002;88(17):174102.
- (28) Rosso OA, Larrondo HA, Martin MT, Plastino A, Fuentes MA. Distinguishing noise from chaos. Physical Review Letters. 2007;99(15):154102.
- (29) Crutchfield JP. Between order and chaos. Nature Physics. 2012;8(1):17–24.
- (30) Marcon E, Scotti I, Hérault B, Rossi V, Lang G. Generalization of the partitioning of Shannon diversity. Plos One. 2014;9(3):e90289.
- (31) Daw CS, Finney CEA, Tracy ER. A review of symbolic analysis of experimental data. Review of Scientific Instruments. 2003;74(2):915–930.
- (32) Herzel H, Schmitt A, Ebeling W. Finite sample effects in sequence analysis. Chaos, Solitons & Fractals. 1994;4(1):97–113.
- (33) Grassberger P. Finite sample corrections to entropy and dimension estimates. Physics Letters A. 1988;128(6-7):369–373.
- (34) Stammler S, Katzenbeisser S, Hamacher K. Correcting Finite Sampling Issues in Entropy l-diversity. In: International Conference on Privacy in Statistical Databases. Springer; 2016. p. 135–146.
- (35) Levina A, Priesemann V. Subsampling scaling. Nature communications. 2017;8:15140.
Supporting information
In this work, six different financial data sets have been investigated: BUND, BOBL, DAX, EuroCurrency, EuroSTOXX, FIB 30. A short description of the data and the markets is provided here below.
BUND is a debt security issued by Germany’s federal government, and it is the German equivalent of a U.S. Treasury bond. The German government uses bunds to finance its spending, and bonds with long-term durations are the most widely issued securities. Bunds are auctioned only with original maturities of 10 and 30 years.
Bunds represent long-term obligations of the German federal government that are auctioned off in the primary market and traded in the secondary market. Bunds can be stripped, meaning their coupon payments can be separated from their principal repayments and traded individually. Bunds pay interest and principal typically once a year, and they represent an important source of financing for the German government.
The principal characteristics of bunds are that they are nominal bonds with fixed maturities and fixed interest rates. All German government debt instruments, including bunds, are issued by making a claim in the government debt register rather than producing paper certificates. A typical bund issue will state its issuance volume, maturity date, coupon rate, payable terms and interest calculation standard used.
BOBL is a futures contract with medium term debt that is issued by the Federal Republic of Germany as its underlying asset. The contract has a notional contract value of 100,000 euros, with a term to maturity of 4.5 to five years. Unlike most other types of future contracts, BOBL future contracts tend to be settled by delivery.
In America, these futures contracts are traded on the Chicago Board of Trade, under the symbol GBM. The Euro-Bobl future, along with the Euro-Bund and Euro-Schatz futures, are the most heavily traded fixed-income securities in the world.
BOBL is an acronym for bundesobligationen. This translates to ’federal obligations’ in English .
DAX, the “Deutscher Aktien indeX”, is the derivative of the main German stock index consisting of the 30 major German companies trading on the Frankfurt Stock Exchange.
Just like the FTSE 100 and S&P500, DAX is a capitalization-weighted index so it essentially measures the performance of the 30 largest, publicly traded companies in Germany. It is therefore a strong indicator of the strength of the German economy and investor sentiment towards German equities.
The DAX has been a relatively stable index with 16 companies of the original 30 remaining in the index since its inception in 1988.
The index began with a base date of 30 December 1987 and a base value of 1,000. Over the years the DAX has seen a large amount of takeovers, mergers, bankruptcies, and restructurings.
Since 1 January 2006, the index is calculated after every seconds. It is computed daily between 09:00 and 17:30 CET.
Euro Stoxx is an index of the Eurozone stocks designed by STOXX, a provider owned by Deutsche Börse Group. The Euro Stoxx 50 provides a blue-chip representation of Supersector leaders in the Eurozone. It is made up of fifty of the largest and most liquid stocks.
The Euro Stoxx 50 was introduced on 26 February 1998. Its composition is reviewed annually in September. The index is available in several currency (EUR, USD, CAD, GBP, JPY) and return (Price, Net Return, Gross Return) variant combinations. Calculation takes place every 15 seconds between 09:00 CET and 18:00 CET for the EUR and USD variants of any return type, while the CAD, GBP and JPY variants are available as end-of-day calculation only (18:00 CET).
The Euro Stoxx 50 Index is derived from the 19 Euro Stoxx regional Supersector indices and represents the largest super-sector leaders in the Eurozone in terms of free-float market capitalization. The index captures about 60% of the free-float market capitalization of the Euro Stoxx Total Market Index (TMI), which in turn covers about 95% of the free-float market capitalizaion of the represented countries.
It is one of the most liquid indices for the Eurozone: an ideal underlying for financial products or for benchmarking purposes. Additionally, the index serves as an underlying for many strategy indices, such as the Euro Stoxx 50 Risk Control Indices. Buffers are used to achieve the fixed number of components and to maintain stability of the indices by reducing index composition changes. Selection methodology ensures a stable and up-to-date index composition. Fast-entry and fast-exit rules ensure the index accurately represents the performance of only the biggest and most liquid stocks.
Euro Currency Index () represents the arithmetic ratio of four major currencies against the Euro: US-Dollar, British Pound, Japanese Yen and Swiss Franc. All currencies are expressed in units of currency per Euro. The index was launched in 2004 by the exchange portal Stooq.com. Underlying are 100 points on 4 January 1971.
Based on the progression, Euro Currency Index can show the strength or weakness of the Euro. A rising index indicates an appreciation of the Euro against the currencies in the currency basket, a falling index in contrast, a devaluation. Relationships to commodity indices are recognizable. A rising Euro Currency Index means a tendency of falling commodity prices. This is especially true for agricultural commodities and the price of oil. Even the prices of precious metals (gold and silver) are correlated with the index.
Arithmetically weighted Euro Currency Index is comparable to the trade-weighted Euro Effective exchange rate index of the European Central Bank (ECB). The index of ECB measures much more accurately the value of the Euro, compared to the Euro Currency Index, since the competitiveness of European goods in comparison to other countries and trading partners is included in it.
FIB30 is the derivative of the MIB 30 stock market index consisting of the 30 major Italian companies trading on the Borsa Italiana until the 2003. In fact in 2003 it is substituted by the S&P/MIB, and in the 2009 by the FTSE-MIB index based on the 40 major company traded in the Italian market.
The FTSE MIB index is the major benchmark index of the Italian stock markets. This index, which accounts for about 80% of the domestic market capitalization, consists of companies of primary importance and high liquidity in the various ICB sectors in Italy.
The FTSE MIB Index measures the performance of 40 Italian securities and intends to reproduce the weights of the expanded Italian equity market. The Index is derived from the trading universe of securities on the main stock market of Borsa Italiana (BIt). Each title is analyzed by size and liquidity, and the Index provides a representation of sectors. The FTSE MIB is a weighted index based on market capitalization.
It is computed daily between 9:00 and 17:50 CET.