Non-Gaussian Error Distributions of Galactic Rotation Speed Measurements
Abstract
We construct the error distributions for the galactic rotation speed () using 137 data points from measurements compiled in De Grijs et al.de Grijs and Bono (2017), with all observations normalized to the galactocentric distance of 8.3 kpc. We then checked (using the same procedures as in works by Ratra et al) if the errors constructed using the weighted mean and the median as the estimate, obey Gaussian statistics. We find using both these estimates that they have much wider tails than a Gaussian distribution. We also tried to fit the data to three other distributions: Cauchy, double-exponential, and Students-t. The best fit is obtained using the Students- distribution for using the median value as the central estimate, corresponding to a -value of 0.1. We also calculate the median value of using all the data as well as using the median of each set of measurements based on the tracer population used. Because of the non-gaussianity of the residuals, we point out that the subgroup median value, given by km/sec should be used as the central estimate for .
pacs:
97.60.Jd, 04.80.Cc, 95.30.SfI Introduction
Recently, de Grijs and Bono de Grijs and Bono (2017) (hereafter G17), compiled a list of 162 galactic rotation speed measurements (denoted as ) using data from all the published literature starting from 1927 right up to 2017. Two main goals of this meta-analysis was to look for evidence for publication bias and to check how close is the central estimate from all these measurements to the IAU recommended value of km/sec Kerr and Lynden-Bell (1986). Although, no evidence for such a bias was seen, G17 found evidence for systematic biases in the measurements of between the different tracer populations. The estimated value for Galactic rotation speed obtained in G17 using all the post-1985 measurements is given by km/sec, after positing a galactocentric distance of 8.3 kpc.
In the last decade, Ratra and collaborators have used a variety of astrophysical datasets to test the non-Gaussianity of the error distributions from these measurements. The datasets they explored for this purpose include measurements of Chen et al. (2003), Lithium-7 measurements Crandall et al. (2015) (see also Zhang (2017)), distance to LMC Crandall and Ratra (2015), distance to galactic center Camarillo et al. (2017). Evidence for non-Gaussian errors has also been found in HST Key project data Singh et al. (2016). For each of these datasets, they have fitted the data to a variety of probability distributions. For all of these studies, they have found the error distributions to be non-Gaussian. As a consequence they have argued that median statistics should be used for central estimates of these parameters instead of the weighted mean. Median statistics has therefore been used to obtain central estimates of Gott et al. (2001); Chen and Ratra (2011); Bethapudi and Desai (2017), Bethapudi and Desai (2017), mean matter density Chen and Ratra (2003) and other cosmological parameters Crandall and Ratra (2014).
Inspired by these works, we revisit the issue of getting the best estimate of from the catalog compiled in G17. The first step in this analysis is to check for non-Gaussianity of the residuals. The importance of checking for non-Gaussianity of the measurement errors for a large suite of astrophysical measurements has been stressed in a number of works in astrophysics (Gott et al., 2001; Chen et al., 2003; Crandall et al., 2015; Camarillo et al., 2017; Crandall and Ratra, 2015; Singh et al., 2016; Zhang, 2017). Most recently, its importance in other fields such as nuclear and particle physics, medicine and toxicology has also been elucidated by Bailey Bailey (2017).
It is common practice to assume that datasets are Gaussian. However, this is not always the case. By carrying out Gaussianity tests on error distributions of measurements, several insights can be obtained. One application is the possibility of reduced significance of discrepancies between observed and expected values. Usually, when a central estimate for a physical quantity is needed, one typically calculates a weighted average of all the measurements. One assumption implicitly made herein is that the weighted mean error distributions have a Gaussian distribution. If this is not the case, then one cannot directly use weighted mean estimates or analysis for parameter estimation. One then needs to resort to median statistics (Gott et al., 2001; Bethapudi and Desai, 2017), which does not invoke the measurement errors and is not affected by the non-Gaussianity Camarillo et al. (2017). If the residuals are non-Gaussian, one possibility is that the errors are underestimated and there are additional unaccounted systematic errors , which could be “known unknowns” or “unknown unknowns”. Another possible reason could be due to outliers, which may arise due to egregious measurements. These outliers could potentially bias any estimates. Conversely, if the tails in a distribution are narrower than a Gaussian, it implies that the different measurements are correlated. For this reason a large number of studies in astrophysics and other fields have investigated and found evidence for non-Gaussianity for a diverse suite of measurements.
The galactocentric velocity is of tremendous importance in both galactic astrophysics as well as cosmology, and hence in order to obtain a robust estimate of its central value, one needs to check for non-Gaussianity of errors.
II Dataset Used
We briefly review the data on the galactic rotation speed measurements compiled by G15. More details can be found in their paper de Grijs and Bono (2017). The main goal of their paper (intended as a follow-up to a series of papers de Grijs et al. (2014); de Grijs and Bono (2014, 2015, 2016) looking for similar effects in other observables) was to undertake a meta-analysis of all the measurements of from published literature in order to look for intrinsic differences between the different categories of measurements of . They also wanted to see if there is evidence for publication bias or “bandwagon” effect.
The previous comprehensive review of literature on galactic rotation velocities was carried out by Kerr and Lynden-Bell Kerr and Lynden-Bell (1986), which explained the reasoning behind the IAU recommended value of 220 km/sec at the solar circle. G17 searched the NASA/Astrophysics Data System (ADS) by looking for articles referring to the Milky Way and using one of the following keywords in the abstract search: ‘rotation curve’, ‘kinematics’ (including its variants), ‘dynamics’, and ’Oort’. They found a total of 9,690 articles starting from Oort’s original papers in 1927 Oort (1927a, b) until the end of June 2017. They data mined all these papers looking for new values of Galactic rotation constants. These papers either provided a direct measurements of the galactic rotation speed or the Oort constants and Oort (1927a, b), from which is given by , where is the Galactocentric distance. Since majority of the measurements hinge on the determination of , G17 homogenized all measurements of to a common value of kpc, based on recommendations from their previous set of studies de Grijs and Bono (2016).
In all, they found a total of 162 measurements. These consist of seven different types of stellar population tracers. All these measurements along with their statistical uncertainties have been uploaded on the internet. 111See http://astro-expat.info/Data/pubbias.html for a compilation of all these measurements. We note that no systematic errors have been included in the analysis. In addition to these measurements compiled by G17, we used two additional measurements compiled by Salucci et al Salucci et al. (2010); Nesti and Salucci (2013), which are not listed in G17. In one of them Salucci et al. (2010), has been estimated to be km/sec/kpc. In Ref. Salucci et al. (2010), has been estimated to be km/sec. We also found that one measurement by Glushkova et al Glushkova et al. (1999) was incorrectly tabulated on the website. At the time of writing, the website reported a measurement of 277 3 km/sec at a distance of 7.4 kpc. However, this is a typographical error on the website and the correct measurement reported in the paper is 204 15 km/s. For our analysis, we used the correct measurement reported in the paper.
Out of these 164 measurements, we omitted 26 for which no errors were provided. We also left out the measurement in Ref. Williams and Evans (2015), corresponding to a value of 198 km/sec at 10 kpc. This value corresponds to a 23.5 discrepancy compared to the weighted mean value. One possible reason for this low value of the rotation speed Williams and Evans (2015) is because of the simplified ansatz they used for the Galactic gravitational potential, viz. a spherical power law. We also normalized all the remaining 137 measurements of and their associated errors, which are degenerate with galactocentric distance to a value of 8.3 kpc. Only five measurements (four of them discussed in G17 and one from Salucci Nesti and Salucci (2013)) were not scaled, as they were independent of . We note that for their analysis estimates oc entral values, G17 used only the post-1985 measurements.
III Analysis
III.1 Error Distribution and distribution functions
Similar to Ratra et al ( Crandall et al. (2015)), we calculated the estimates using two methods: median statistics and weighted mean estimates. The weighted mean () is given by Bevington and Robinson (1992):
| (1) |
where indicates each measurement of the rotation and indicates the total error in each measurement. The total weighted mean error is given by . The goodness of fit is parameterized by , which is given by
| (2) |
The defined in Eq. 2 is also referred to as reduced . For a reasonably good fit, this has to be close to 1.
An alternate method to determining the central estimate is using median statistics. The main advantage of median statistics-based estimate is that it is robust against outliers and does not make use of individual error bars. The median estimate is also expected to be more robust if the error bars are not Gaussian (Gott et al., 2001; Chen and Ratra, 2011; Bethapudi and Desai, 2017). More details on median statistics-based estimates and its applications to a various astrophysical datasets are reviewed in Refs Gott et al. (2001); Chen and Ratra (2003); Bethapudi and Desai (2017); Chen and Ratra (2011); Crandall and Ratra (2014) and references therein. Using the dataset constructed by G17, we calculate the median central estimate of and its 68% confidence intervals, using the same prescription as in Ref. Chen and Ratra (2011). The weighted mean estimate is found to be km/sec and the median estimate is calculated to be km/sec. We note that one difference between these estimates and those in G17, is that G17 did the calculations for only the post-1985 measurements, whereas we have included all the measurements tabulated in G17.
For both the estimates of , we calculate , where
| (3) |
In the above equation, is the error in the central estimate (which could be the median or weighted-mean based estimate). We now fit the histogram of to various probability distributions as described in the next section.
III.2 Fits to probability distributions
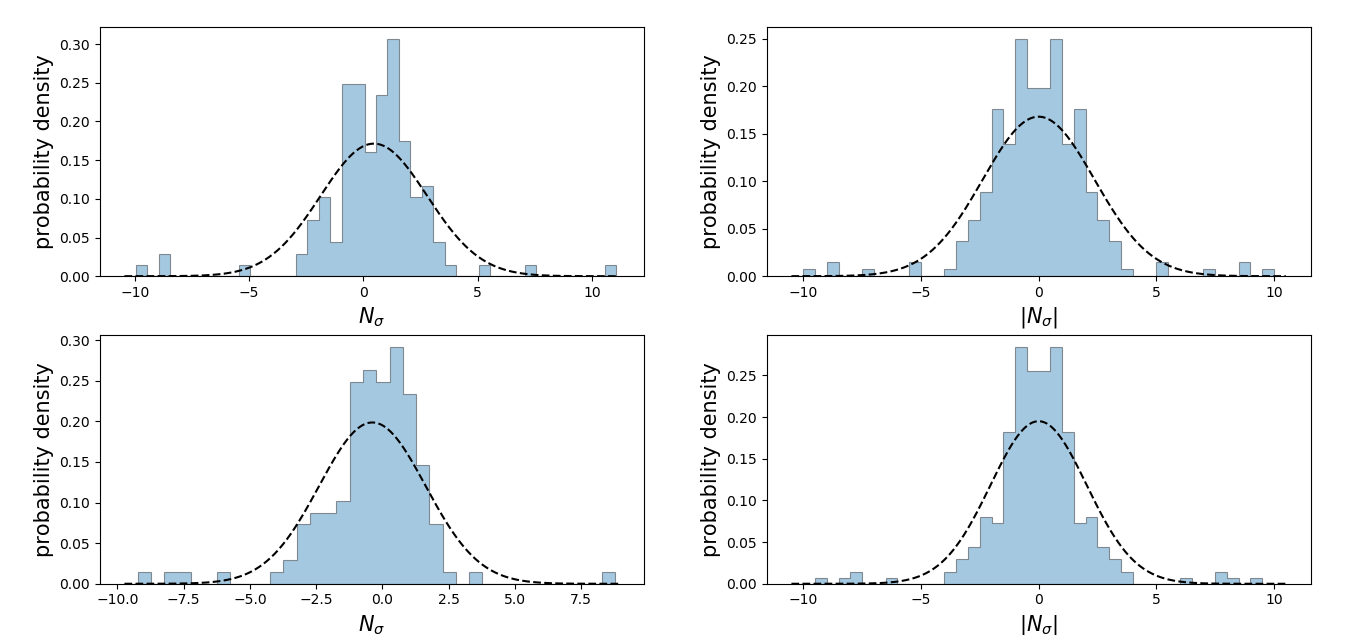
We have used (defined in Eq. 3) for each data point, to construct a histogram for the error distributions using both the weighted mean and median central estimates. We also construct a corresponding histogram for , where the distributions were symmetrized around the central value, in the same way as in Ref. Crandall and Ratra (2014). These histograms of and are shown in Fig 1.
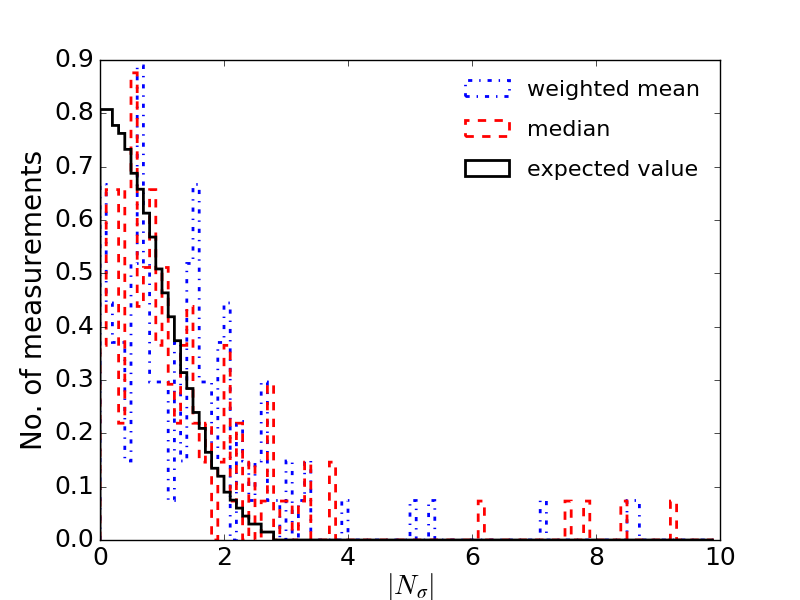
In terms of , with mean as the central estimate, only 44.53% of total distribution lies in the range , and 75.91% of the error distribution lies in the range . When we use the median as the central estimate for the error distribution, 54.02% of the distribution lies in range and 79.56% of the total error distribution lies in the range . However, according to the Gaussian probability distribution, 68.3% of the total measurements should lie within and 95.4% should lie within . Hence, we can conclude that the error distribution in this case deviates from a Gaussian probability distribution to a good extent. To further elucidate the discrepancy from normal distribution, we plot in Figure 2 the distribution of with a bin size of = 0.1 for both the mean and the median as central estimates compared to the normal distribution. The solid black line shows the expected Gaussian probabilities given by . The discrepancy from a normal distribution is conspicuous in both the weighted mean and median. We also find a total of five outliers with .
So, as our next step, we have taken a few well-known non-Gaussian probability distribution functions into consideration, such as Cauchy, Double exponential, and Student-t distributions, in order to ascertain the probability distribution function which fits well to our error distribution.
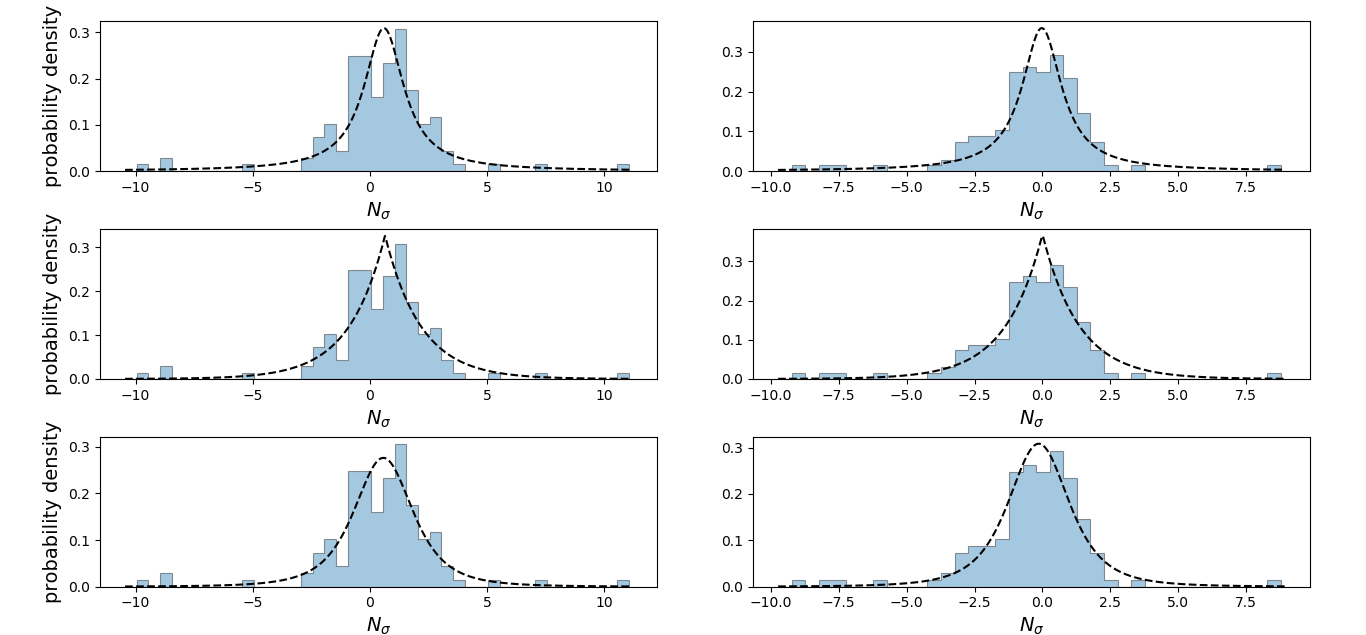
We therefore fit the histograms of and to four different distributions: Gaussian, Cauchy, double-exponential, and Students-t distribution. We performed the fit using the stats.fit functionality in Scipy for each of these probability distribution functions. Figure 3 shows the Cauchy, Double exponential and Students-t probability distribution functions, fitted to the histograms using both the mean and median as the central estimates. To evaluate the best fit, we use the distribution-free Kolmogorov-Smirnoff (K-S) test Press et al. (1992). We note that the Students-t distribution has an additional free parameter . We varied the values of for this distribution until the -value was maximized. The K-S probabilities for these distributions both with and without binning, and also with weighted mean/median as central estimates are shown in Table 1.
From the corresponding -values for each of the distribution functions, it can be concluded that the Student’s t distribution function (with ) fits comparatively better to our error distribution, when median is taken as the central estimate. All the remaining distribution functions give very poor fits.
| Function | Un-binned probability | Binned probability | ||
|---|---|---|---|---|
| mean | median | mean | median | |
| Gaussian | 0 .0084 | 0.0001 | ||
| Cauchy | 0.05 | 0.022 | ||
| Double exponential | 0.016 | 0.0005 | ||
| Students-t | (n=1) | (n=2) 0.1 | (n=1) | (n=1) 0.022 |
| Tracers | No. of Observations* | Median (km/s) | 68 % c.l. (km/s) | p-value (median) | p-value (mean) |
|---|---|---|---|---|---|
| Field stars | 30 | 223.99 | 3.53 | 0.23 | 0.15 |
| Young tracers | 64 | 245.48 | 2.49 | 0.62 | 0.13 |
| Galactic Mass Modeling | 14 | 214.82 | 5.74 | 0.57 | 0.44 |
| Intermediate/old age tracers | 6 | 202.89 | 49.08 | 0.58 | 0.95 |
| SgrA | 10 | 244.46 | 4.72 | 0.11 | 0.21 |
| Others | 12 | 215.31 | 1.95 | 0.17 | 0.28 |
III.3 Examination of outliers
We now briefly discuss some of the measurements, which are the cause of outliers in the distribution in Fig. 2, to see if a simple explanation can be found for these. When considering the weighted mean, we have five such measurements with , corresponding to values of 10.7 Branham (2014), -9.7 (Clemens, 1985), -8.6 (Robinson et al., 1988), -8.4 Alvarez et al. (1990), 7.3 Sharma et al. (2014).
The largest outlier comes from Branham (Branham, 2014), corresponding to km/sec at =8.15 kpc. This measurement has been made using the kinematics of OB stars using data from the Hipparcos satellite and by solving for 14 unknowns (Branham, 2014). Their value of 298 km/sec was obtained after positing a linear model to simplify the equations. When a non-linear model is used, then a value close to our central estimate is obtained. For the outlier at 9.7 Clemens (1985), the website in G17 reports a measurement of 252 2 km/s for kpc. This paper reports a measurement of galactic rotation curve as a function of galacto-centric distance from the UMASS StonyBrook CO survey. However, on closer examination of this paper, we find that the galactic rotation curve was plotted for two different values of and , of which one is the value documented by G17. We note however, that no independent estimate of has been made from the observations. Two ad-hoc values for of 252 and 220 km/sec have been assumed for obtaining the galactic rotation curves. Therefore, this measurement should have been omitted from the database compiled by G17. The next outlier is at km/sec (Robinson et al., 1988), corresponding to . This measurement comes from the southern galactic plane CO survey carried out using the 4-m Epping telescope. Their value of 180 km/sec is obtained from the slope of terminal velocity curve as a function of galactic longitude (Fig. 5(a) of Ref. Robinson et al. (1988)). However, this plot contains many outliers and no detailed statistical analysis of the goodness of fit has been made. So there is no guarantee the estimated provided a good fit to the data. The next outlier (at -8.4) is also from CO observations, as part of the Deep CO survey of the southern Milky Way galaxy survey Alvarez et al. (1990), which estimated a value of km/sec. One assumption made for this work was that the galactic rotation curve is completely flat and there is no variation with galactic longitude. The last outlier corresponds to km/sec () Sharma et al. (2014). This value was obtained from the Radial Velocity Experiment (RAVE) stellar survey using the Shu distribution function. Although it is hard to discern a specific reason for this high value, one possibility could be that there is a degeneracy between the value of and another parameter defined as , which denotes the vertical dependence of the circular speed. The value they obtained for disagrees with the value of 0.0347 predicted by analytical models of Milky way potential. For smaller values of , the estimated values of would also decrease.
Therefore to summarize, we find that one outlier measurement is a consequence of an incorrect tabulation. Two others come from CO measurements. The possible reason for the outliers in the other two measurements is a consequence of a simplified model been used in the fitting procedure or due to degeneracy between the rotation speed and another astrophysical parameter.
IV Analysis of subsamples
In order to understand the underlying cause of non-Gaussianity when analyzing the full dataset, we undertake a similar analysis on each subsample of data after grouping the measurements according to the method used. This will help us determine if there are unknown systematic errors within each group. The classification of measurements has already been done in G17, who divided the measurements according to the stellar population tracer used. The entries were grouped into field stars; young tracer populations; old and intermediate age tracers; kinematics of Sgr A* near the galactic center; and galactic mass modeling using H1 as well as CO radio observations. In G17, central estimates using the weighted mean values of each group has already been calculated, including a discussion of which of these deviate from the IAU recommended values. G17 have found differences among the and values between the different tracer populations. They have found that young tracers and kinematic measurements of Sgr A* near the galactic center imply a significantly larger rotation speed at the solar circle compared to the field stars and HI/CO measurements. Here, we examine the non-gaussianity of errors in each subset to see if there is any underlying unaccounted systematics in each subset of measurements.
For each subset, we carry out the same analysis as in Sect. III. We obtain the central estimate using both the weighted mean and median and then construct histograms using each of these and fit these to a Gaussian distribution. We check for Gaussianity using the p-values resulting from K-S test. The results can be found in Table LABEL:tab:table2. To complement the analysis in G17, we show the group-wise medians along with 60% c.l. ranges obtained using the method by Chen and Ratra Chen and Ratra (2011). We can see that our median-based estimates for each tracer population agree with the weighted means by G17, except for the intermediate and old age tracer population, for which we get a value 10 km/sec more than the one by G17.
From Table LABEL:tab:table2, we find that the p-value for a Gaussian distribution fitting the data is greater than 0.1 for all the subsets, using both the mean as well as the central estimates. Therefore, there is no unknown systematic error or egregious measurement within each group of measurements. The underlying cause of non-gaussianity for the full dataset is probably caused by combining the data across the tracers, in addition to outliers.
Finally, similar to previous works on median statistics estimates of astrophysical and cosmological parameters, we obtain a central estimate by calculating median of this group-wise median estimates. This central estimate from the median of all these medians is given by =219.65 km/sec. The total number of measurement categories is too small to get a robust 68% confidence level error bar on this value.
Given the non-Gaussianity of the residuals from the full dataset, this median value of 219.65 km/sec should be used as the central estimate of . We note that this value is closer to the IAU recommended value of 220 km/sec and differs from the recommendation in G17 of 225 km/sec inspite of using the same galactocentric distance of 8.3 kpc.
V Conclusions
We have used a compilation of 137 measurements of Galactic rotation speed and their corresponding errors from G17 (de Grijs and Bono, 2017) and two additional measurements (not included in G17), in order to gain a better insight of the non-Gaussianity of the residuals and to obtain a central estimate. We first scaled all the measurements, which were degenerate with galactocentric distance to a common value of 8.3 kpc. The error distributions were analyzed (following the same prescription as in the previous works by Ratra et al Chen et al. (2003); Crandall et al. (2015); Crandall and Ratra (2015); Camarillo et al. (2017)) and plotted using both the weighted mean as well as the median value as the central estimate. We note that the central estimates for the weighted mean and median used all the measurements unlike those in G17, which used only the post-1985 measurements.
We conclude from our observations that the error distribution for the galactic rotation speed measurements using both these estimates is inherently non-Gaussian. The deviation from Gaussian distribution motivated us to check the fit for other prominent non-Gaussian probability distribution functions. We have taken into consideration the Cauchy, Double exponential and Students-t probability distribution functions. The results show that with median as the central estimate, the error distribution have comparatively better fits with Student’s t probability distribution functions for , corresponding to a -value of 0.1. All other distributions display poor fits with both mean and median values as central estimates.
We then redid the same analysis after grouping the measurements according to the tracers used. We find that the residuals within each subsample follow the Gaussian distribution. This implies that the non-Gaussianity of the error bars is caused by combining the measurements from different categories, in addition to outliers.
Finally, since the residuals are not Gaussian, instead of the weighted mean, the median value when grouped according to the measurement type should be used as the central estimate for . This group-wise median value is equal to 219.65 km/sec and is close to the IAU recommended value of 220 km/sec. This is inspite of using a galactocentric distance of 8.3 kpc.
Acknowledgements.
We thank the anonymous referee for invaluable constructive feedback on the manuscript draft. We are also grateful to Richard De Grijs and Paolo Salucci for useful correspondence.References
- de Grijs and Bono (2017) R. de Grijs and G. Bono, Astrophys. J. Suppl. Ser. 232, 22 (2017), eprint 1709.02501.
- Kerr and Lynden-Bell (1986) F. J. Kerr and D. Lynden-Bell, Mon. Not. R. Astron. Soc. 221, 1023 (1986).
- Chen et al. (2003) G. Chen, J. R. Gott, III, and B. Ratra, Pub. Astro. Soc. Pac. 115, 1269 (2003), eprint astro-ph/0308099.
- Crandall et al. (2015) S. Crandall, S. Houston, and B. Ratra, Modern Physics Letters A 30, 1550123 (2015), eprint 1409.7332.
- Zhang (2017) J. Zhang, Mon. Not. R. Astron. Soc. 468, 5014 (2017).
- Crandall and Ratra (2015) S. Crandall and B. Ratra, Astrophys. J. 815, 87 (2015), eprint 1507.07940.
- Camarillo et al. (2017) T. Camarillo, V. Mathur, T. Mitchell, and B. Ratra, ArXiv e-prints (2017), eprint 1708.01310.
- Singh et al. (2016) M. Singh, S. Gupta, A. Pandey, and S. Sharma, JCAP 8, 026 (2016), eprint 1506.06212.
- Gott et al. (2001) J. R. Gott, III, M. S. Vogeley, S. Podariu, and B. Ratra, Astrophys. J. 549, 1 (2001), eprint astro-ph/0006103.
- Chen and Ratra (2011) G. Chen and B. Ratra, Pub. Astro. Soc. Pac. 123, 1127 (2011), eprint 1105.5206.
- Bethapudi and Desai (2017) S. Bethapudi and S. Desai, European Physical Journal Plus 132, 78 (2017), eprint 1701.01789.
- Chen and Ratra (2003) G. Chen and B. Ratra, Pub. Astro. Soc. Pac. 115, 1143 (2003), eprint astro-ph/0302002.
- Crandall and Ratra (2014) S. Crandall and B. Ratra, Physics Letters B 732, 330 (2014), eprint 1311.0840.
- Bailey (2017) D. C. Bailey, Royal Society Open Science 4, 160600 (2017), eprint 1612.00778.
- de Grijs et al. (2014) R. de Grijs, J. E. Wicker, and G. Bono, Astron. J. 147, 122 (2014), eprint 1403.3141.
- de Grijs and Bono (2014) R. de Grijs and G. Bono, Astron. J. 148, 17 (2014), eprint 1405.2124.
- de Grijs and Bono (2015) R. de Grijs and G. Bono, Astron. J. 149, 179 (2015), eprint 1504.00417.
- de Grijs and Bono (2016) R. de Grijs and G. Bono, Astrophys. J. Suppl. Ser. 227, 5 (2016), eprint 1610.02457.
- Oort (1927a) J. H. Oort, Bulletin of the Astronomical Institutes of the Netherlands 3, 275 (1927a).
- Oort (1927b) J. H. Oort, Bulletin of the Astronomical Institutes of the Netherlands 4, 79 (1927b).
- Salucci et al. (2010) P. Salucci, F. Nesti, G. Gentile, and C. Frigerio Martins, Astron. & Astrophys. 523, A83 (2010), eprint 1003.3101.
- Nesti and Salucci (2013) F. Nesti and P. Salucci, JCAP 7, 016 (2013), eprint 1304.5127.
- Glushkova et al. (1999) E. V. Glushkova, A. K. Dambis, and A. S. Rastorguev, Astronomical and Astrophysical Transactions 18, 349 (1999).
- Williams and Evans (2015) A. A. Williams and N. W. Evans, Mon. Not. R. Astron. Soc. 454, 698 (2015), eprint 1508.02584.
- Bevington and Robinson (1992) P. R. Bevington and D. K. Robinson, Data reduction and error analysis for the physical sciences (1992).
- Press et al. (1992) W. H. Press, S. A. Teukolsky, W. T. Vetterling, and B. P. Flannery, Numerical recipes in C. The art of scientific computing (1992).
- Branham (2014) R. L. Branham, Astrophysics and Space Science 353, 179 (2014).
- Clemens (1985) D. P. Clemens, Astrophys. J. 295, 422 (1985).
- Robinson et al. (1988) B. J. Robinson, R. N. Manchester, J. B. Whiteoak, R. E. Otrupcek, and W. H. McCutcheon, Astron. & Astrophys. 193, 60 (1988).
- Alvarez et al. (1990) H. Alvarez, J. May, and L. Bronfman, Astrophys. J. 348, 495 (1990).
- Sharma et al. (2014) S. Sharma, J. Bland-Hawthorn, J. Binney, K. C. Freeman, M. Steinmetz, C. Boeche, O. Bienaymé, B. K. Gibson, G. F. Gilmore, E. K. Grebel, et al., Astrophys. J. 793, 51 (2014), eprint 1405.7435.