UV photoprocessing of NH3 ice: photon-induced desorption mechanisms
Abstract
Ice mantles detected on the surface of dust grains toward the coldest regions of the interstellar medium can be photoprocessed by the secondary ultraviolet (UV) field present in dense cloud interiors. In this work, we present UV-irradiation experiments under astrophysically relevant conditions of pure NH3 ice samples in an ultra-high vacuum chamber where solid samples were deposited onto a substrate at 8 K. The ice analogs were subsequently photoprocessed with a microwave-discharged hydrogen-flow lamp. The induced radiation and photochemistry led to the production of H2, N2 and N2H4. In addition, photodesorption to the gas phase of the original ice component, NH3, and two of the three detected photoproducts, H2 and N2, was observed thanks to a quadrupole mass spectrometer (QMS). Calibration of the QMS allowed quantification of the photodesorption yields, leading to (NH3) = 2.1 x 10⁻³ , which remained constant during the whole experiments, while photodesorption of H2 and N2 increased with fluence, pointing toward an indirect photodesorption mechanism involving energy transfer for these species. Photodesorption yield of N2 molecules after a fluence equivalent to that experienced by ice mantles in space was similar to that of the NH3 molecules ( (N2) = 1.7 x 10⁻³ ).
keywords:
methods:laboratory:molecular - ISM:clouds - ISM: molecules1 Introduction
Infrared observations, mainly performed by space telescopes like the Infrared Space Observatory (ISO), Spitzer, and AKARI, have revealed the presence of ice mantles on the surface of interstellar dust grains in dense interstellar clouds (see, e.g., Gibb et al. (2004); Öberg et al. (2011), and references therein). Water is the major component of the ice mantles, but five more species are confirmed to be present with varying abundances relative to H2O: CO, CO2, CH3OH, NH3, and CH4; and several more have been tentatively detected (Boogert et al. (2015) and references therein).
Ice molecules are processed by cosmic rays and the secondary ultraviolet (UV) field produced in the interior of dense clouds when the cosmic rays interact with the gas-phase H2 molecules (Cecchi-Pestellini & Aiello (1992); Shen et al. (2004)). In particular, UV photons induce photochemical reactions by photolysis of absorbing molecules and recombination of the produced radicals (see Öberg et al. (2016) and references therein), and also photodesorption processes, which represent one of the proposed non-thermal desorption mechanisms necessary to explain the presence of gas-phase molecules in the coldest regions of the interstellar medium (ISM), where they should be completely depleted forming these ice mantles (e.g., Wilacy & Langer (2000); Bergin et al. (2001)).
Depending on whether the photodesorbing molecule is the same ice molecule that absorbs the UV photon (or at least a fragment of the molecule), or a different molecule, one can distinguish between direct photodesorption mechanisms, and photodesorption mechanisms involving energy transfer, respectively.
In the case that the photon is absorbed by a surface ice molecule that does not subsequently photodissociate, the absorbing molecule can directly photodesorb to the gas phase. This mechanism has been proposed by van Hemert et al. (2015) for the photodesorption of CO molecules from a pure CO ice based on molecular dynamics simulations. However, in previous works this process had been proven to be inefficient during experimental simulations with CO and N2 ices when compared to indirect photodesorption mechanisms (see, e.g., Muñoz Caro et al. (2010); Bertin et al. (2012, 2013)), although it may have a contribution in other cases (Dupuy et al. (2017)). Alternatively, if the absorbing surface molecule photodissociates, the resulting photofragment can desorb provided that it is formed with enough kinetic energy, or it may recombine with another fragment, leading to the formation of a photoproduct that could also photodesorb thanks to the excess energy of the parent photofragments and/or the exothermicity released during the recombination reaction (see, e.g., Andersson & van Dishoeck (2008); Fayolle et al. (2013); Fillion et al. (2014); Bertin et al. (2016)). Since the direct photodesorption of photoproducts through this mechanism (which is referred to as photochemical desorption or photochemidesorption in previous works; Martín-Doménech et al. (2016); Cruz-Díaz et al. (2016)) takes place immediately after their formation, photoproducts cannot be accumulated on the ice surface prior to their photodesorption, and the measured photodesorption yield during experimental simulations remains constant with fluence.
On the other hand, if the photon is absorbed by a molecule below the ice surface leading to its electronic excitation, the energy can be redistributed or transferred to a surface molecule 111The transfer of energy could also take place between molecules on the surface of the ice. that could break the intermolecular bonds and photodesorb. This process is usually known as desorption induced by electronic transitions (DIET) followed by subsequent energetic transfer 222The term DIET could, in principle, encompass all photodesorption processes, and does not necessarily imply energetic transfer. However these two concepts tend to be related in the literature (see Fayolle et al. (2011); Bertin et al. (2012)). In addition, when the absorbing and the photodesorbing molecules belong to different species during energy-transfer mediated processes, this mechanism is sometimes referred to as indirect DIET or photon-induced co-desorption, although no distinctions are made, in general. (Fayolle et al. (2011, 2013); Bertin et al. (2012, 2013); Fillion et al. (2014)), and it is referred to as kick-out photodesorption in van Hemert et al. (2015). In the case that the absorbing molecule dissociates, the excess energy can be transferred by the resulting photofragment to a surface molecule, leading to its photodesorption. When the photofragment is an H atom, it can diffuse through the ice and transfer its momentum to a surface molecule. This is known as kick-out photodesorption333Not to be confused with the kick-out photodesorption in van Hemert et al. (2015). (Andersson & van Dishoeck (2008)). Alternatively, the excess energy from the recombination of the photofragments can also be transferred to a surface molecule leading to its photodesorption (Andersson & van Dishoeck (2008); Fillion et al. (2014)). When a previously formed photoproduct photodesorbs through any of these indirect mechanisms, accumulation in the ice prior to their photodesorption leads to an increasing photodesorption yield with fluence, as measured during experimental simulations (Martín-Doménech et al. (2015, 2016); Cruz-Díaz et al. (2016)).
Experimental simulations aiming to study the photodesorption of molecules taking place during photoprocessing of pure ices made by the six species confirmed to be present in interstellar ice mantles are a necessary first step prior to the study of the photodesorption in more realistic multicomponent ice analogs. These studies have been reported for pure H2O (Cruz-Díaz et al. (2017), and references therein), CO (Öberg et al. (2007, 2009b); Muñoz Caro et al. (2010); Fayolle et al. (2011); Bertin et al. (2012, 2013); Chen et al. (2014); Muñoz Caro et al. (2016)), CO2 (Öberg et al. (2009b); Bahr & Baragiola (2012); Yuan & Yates (2013); Fillion et al. (2014); Martín-Doménech et al. (2015)), CH3OH (Öberg et al. (2009a); Bertin et al. (2016); Cruz-Díaz et al. (2016)), CH4 (Dupuy et al. (2017)), and NH3 (Nishi et al. (1984); Loeffler & Baragiola (2010)) ices. In this work, we present a series of experiments simulating the UV photoprocessing of pure NH3 ices focused on the subsequent photodesorption of ice molecules. Irradiation was carried out with a multiwavelength UV lamp, instead of a laser at a given wavelength used in Nishi et al. (1984); Loeffler & Baragiola (2010). In addition, we include the quantification of the different photodesorbing molecules measured directly from the gas phase, which was not reported in the previous works mentioned above, thanks to the calibration of the quadrupole mass spectrometer (QMS) used in our experimental setup (presented in Section 2) to detect the photodesorbing molecules. These results are presented in Section 3, and their astrophysical implications are discussed in Section 4. Finally, the conclusions are summarized in Section 5.
| Experiment | Ninitial(NH3) | Fluenceincident | Fluence | Dose | Dose | Heating rate |
| (1015 molecules cm-2) | (1018 photons cm-2) | (photons molecule-1) | (K/min) | |||
| 1 | 237 | 2.16 | 1.32 | 9.11 | 5.58 | 2 |
| 2 | 835 | 2.88 | 2.78 | 3.45 | 3.33 | 2 |
| 3 | 912 | 2.88 | 2.80 | 3.16 | 3.07 | 2 |
| 4 | 913 | 0.72 | 0.70 | 0.79 | 0.77 | - |
| 5 | 1882 | 1.24 | 1.24 | 0.66 | 0.66 | - |
| 6 | 2264 | 13.27 | 13.27 | 5.86 | 5.86 | 2 |
-
a The number of absorbed photons has been calculated taking into account the initial composition of the ice, i.e., the average UV absorption cross section for a pure NH3 ice, provided by Cruz-Díaz et al. (2014a).
-
b Relative to the initial number of NH3 molecules.
2 Experimental setup
The photodesorption of molecules from a pure NH3 ice has been studied through a series of experimental simulations carried out with the InterStellar Astrochemistry Chamber (ISAC), an ultra-high-vacuum (UHV) setup located at the Centro de Astrobiología, with a working pressure of 4 x 10-11 mbar, similar to that found in the interiors of dense interstellar clouds. A brief description of the experimental setup and the protocol followed during the experimental simulations is provided below (see Muñoz Caro et al. (2010); Martín-Doménech et al. (2015); Cruz-Díaz et al. (2016); Martín-Doménech et al. (2016) for more details). Pure amorphous ammonia ice samples were deposited from the gas phase onto a KBr window at 8 K used as the substrate, upon introduction of NH3 (gas, Praxair 99.999%) into the chamber. The deposited ices were subsequently irradiated using an F-type microwave-discharged hydrogen flow lamp (MDHL) with a vaccum-ultraviolet (VUV) flux of 2 1014 photons cm-2 s-1 at the sample position (Muñoz Caro et al. (2010)). The total irradiation time varied between 60 and 1100 min, leading to the incident fluences indicated in Table 1. For a given fluence, the ice thickness determined the percentage of absorbed photons according to the VUV-absorption cross section reported in Cruz-Díaz et al. (2014a)444The average absorption cross section of pure NH3 ice is 6.1 10-18 cm2 (Cruz-Díaz et al. (2014a)), which led to an absorption close to 100% of incident photons in most of the experiments (see Table 1)., as well as the incident and absorbed dose of photons per molecule. The results in Section 3 were not found to strongly depend on these parameters. The emission spectrum of the MDHL has been characterized in situ using a VUV spectrophotometer, and is reported in Chen et al. (2010, 2014); Cruz-Díaz et al. (2014a). It is similar to the secondary UV field of dense cloud interiors calculated by Gredel et al. (1989). Finally, the ice samples in experiments 1-3 and 6 were warmed-up following irradiation to room temperature at a rate of 2 K/min.
During the experimental simulations, in situ Fourier-transform infrared (FTIR) transmittance spectroscopy was used to monitor the solid sample. IR spectra of the ices were collected after deposition, after every irradiation period, and every five minutes during warm-up, with a spectral resolution of 2 cm-1. The initial column density in molecules cm-2 of the NH3 ices was calculated from the the optical depth () of the N-H stretching absorption IR band at 3300 cm-1, using the formula:
| (1) |
where is the band strength in cm molecule-1 (2.2 10-17 cm molecules-1; Schutte et al. (1996)). The ice thickness of the samples is usually expressed in monolayers (ML). One ML is assumed to be 1015 molecules cm-2.
At the same time, all the desorbing species, including ammonia and the resulting products of the induced photochemical reactions, were detected in the gas phase by a Pfeiffer Prisma quadrupole mass spectrometer (QMS). The molecules reaching the QMS were ionized by 70 eV electron bombardment, which led to fragmentation following a given pattern. The main mass fragments coincided in this case with the molecular ions, and were used to monitor the presence of NH3 (m/z = 17), and the photoproducts N2 (m/z = 28), H2 (m/z = 2), and N2H4 (m/z = 32) in the gas phase. The conversion from the integrated ion currents measured by the QMS for every irradiation period () into photodesorbing column densities () was carried out using the equation:
| (2) |
The meaning of the different parameters in Eq. 2 is described in Martín-Doménech et al. (2015); Cruz-Díaz et al. (2016); Martín-Doménech et al. (2016); Cruz-Díaz et al. (2017). The values used in this work are summarized in Table 2, and in the text. The constant and the sensitivity of the QMS are regularly calibrated (see Martín-Doménech et al. (2015) for more information on the calibration process).
Since the pumping speeds in the ISAC setup are not the same for all molecules, from Eq.2 must be corrected to take into account the different pumping speed of the species of interest with respect to the CO molecules used as reference to extract :
| (3) |
where the relative pumping speed () can be calculated as
| (4) |
(see Kaiser et al. (1995); Martín-Doménech et al. (2016) for more information). Photodesorption yields are finally calculated dividing by the fluence.
| Factor | NH3 | N2 | CO |
|---|---|---|---|
| (angstroms2)a | 3.036 | 2.508 | 2.516 |
| fragment | NH | N | CO+ |
| 17 | 28 | 28 | |
| 1b | 1b | 1b | |
| 0.460c | |||
| 0.514d | 0.933a | 0.949a | |
| 0.498e | |||
| 555the ratio / is the same as the ratio /. (A mbar-1 ) | 1.78 x 10¹⁵ | 1.03 x 10¹⁵ | 1.03 x 10¹⁵ |
| 1.1 | 1.0 | 1.0 |
-
a Extracted from the online database of the National Institute of Standard and Technologies (NIST).
-
b We assumed that no double ionization of the molecules took place in the QMS.
-
c Calculated during the deposition in experiment 1
-
d Calculated during the deposition in experiments 2,3,4, and 6
-
e Calculated during the deposition in experiment 5
-
f Calculated with equation 3.
3 Experimental results and discussion
3.1 Photon-induced chemistry of pure NH3 ice
3.1.1 IR spectra of NH3 ice during irradiation
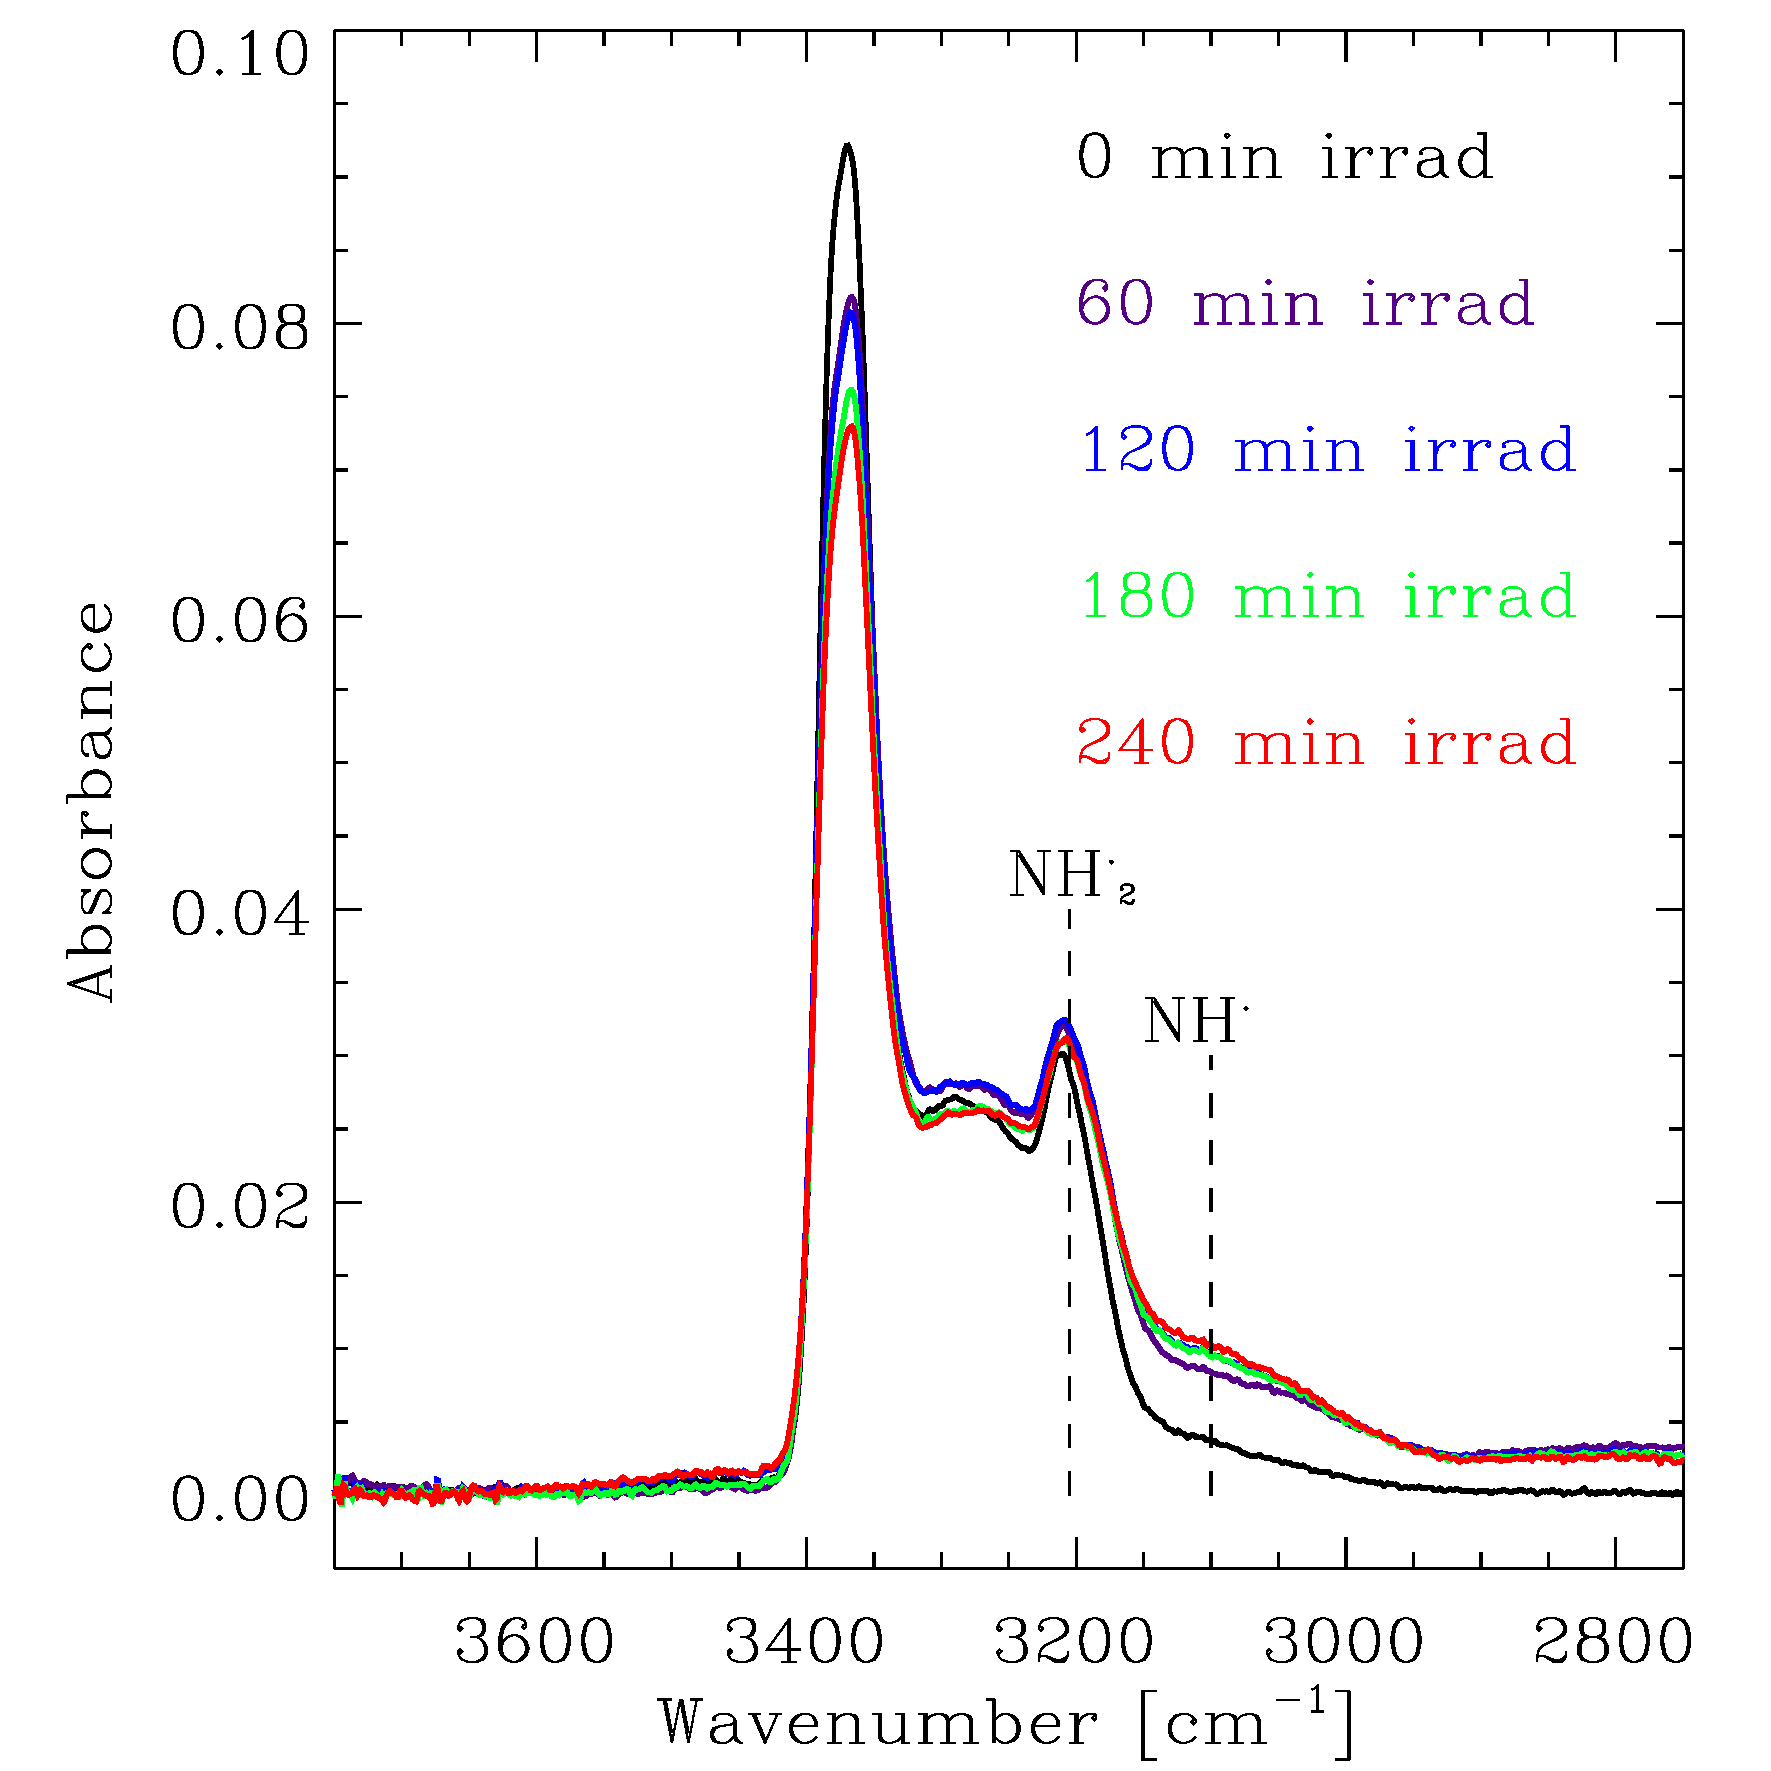
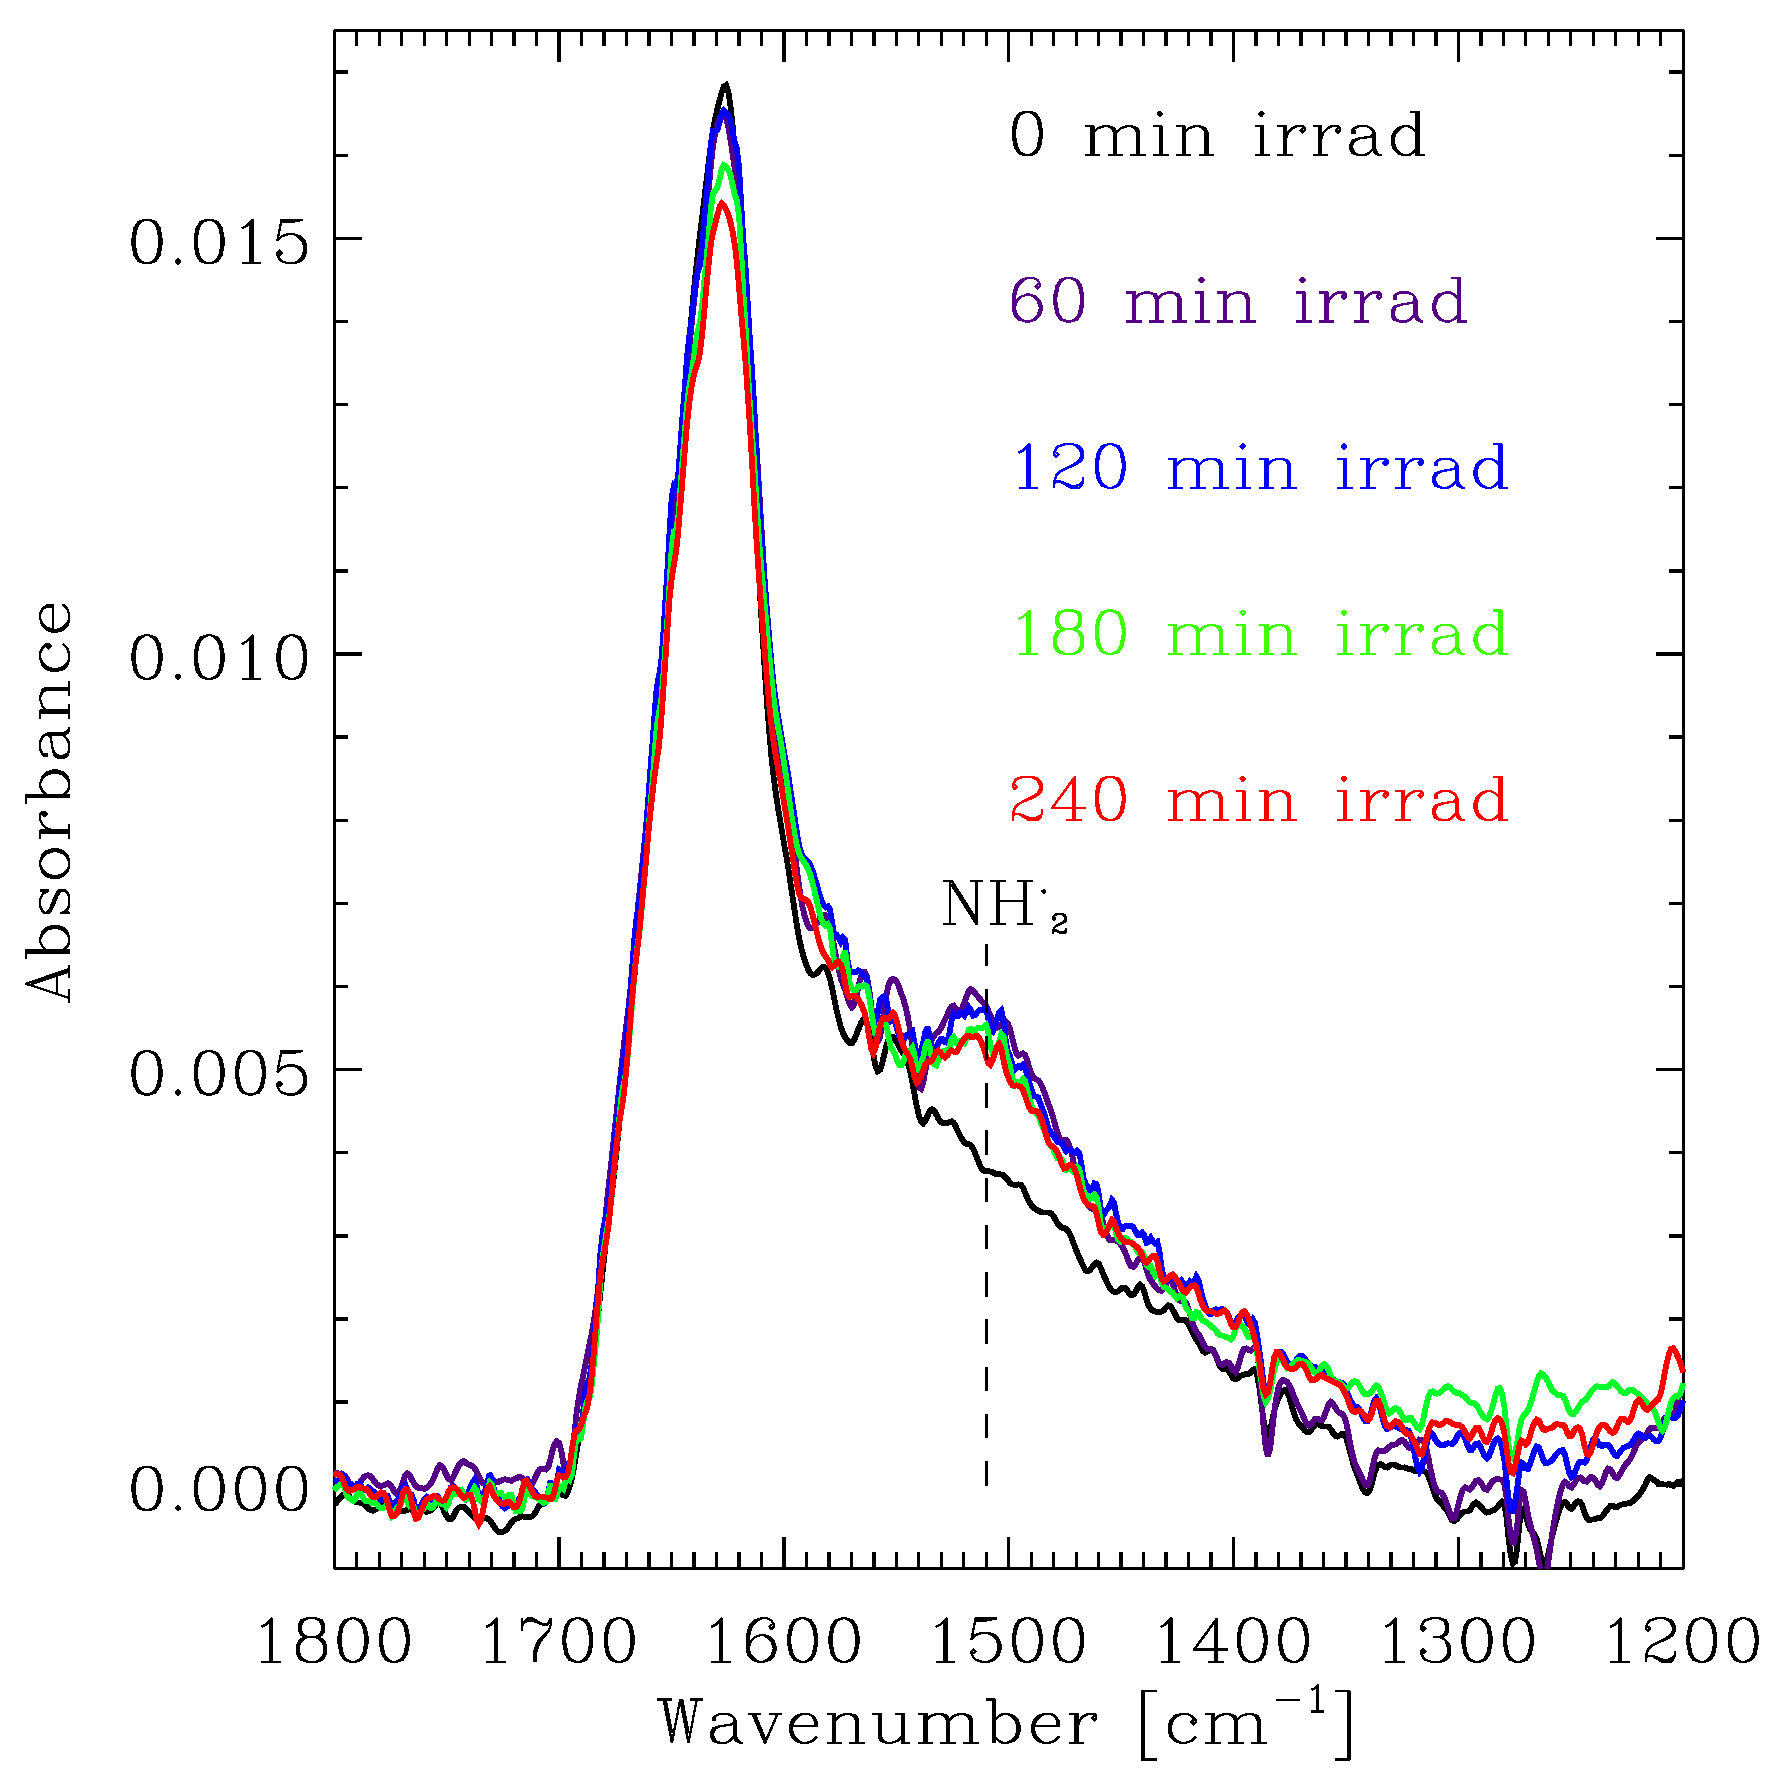
The IR spectrum of a pure and amorphous NH3 ice presents three different features: a wide band centered at 3300 cm-1 (see black curve in left panel of Fig. 1) corresponding to the N-H stretching modes (the symmetric mode peaks at 3375 cm-1, and the antisymmetric mode at 3200 cm-1); a weaker band at 1625 cm-1 (see black curve in right panel of Fig. 1) corresponding to the N-H bending mode; and a third band at 1070 cm-1 (not shown) corresponding to the so-called umbrella mode. During photoprocessing of pure NH3 ices, photodissociation and photodesorption of the NH3 molecules decrease the absorbance of these bands, as shown in Fig. 1 for the former two features.
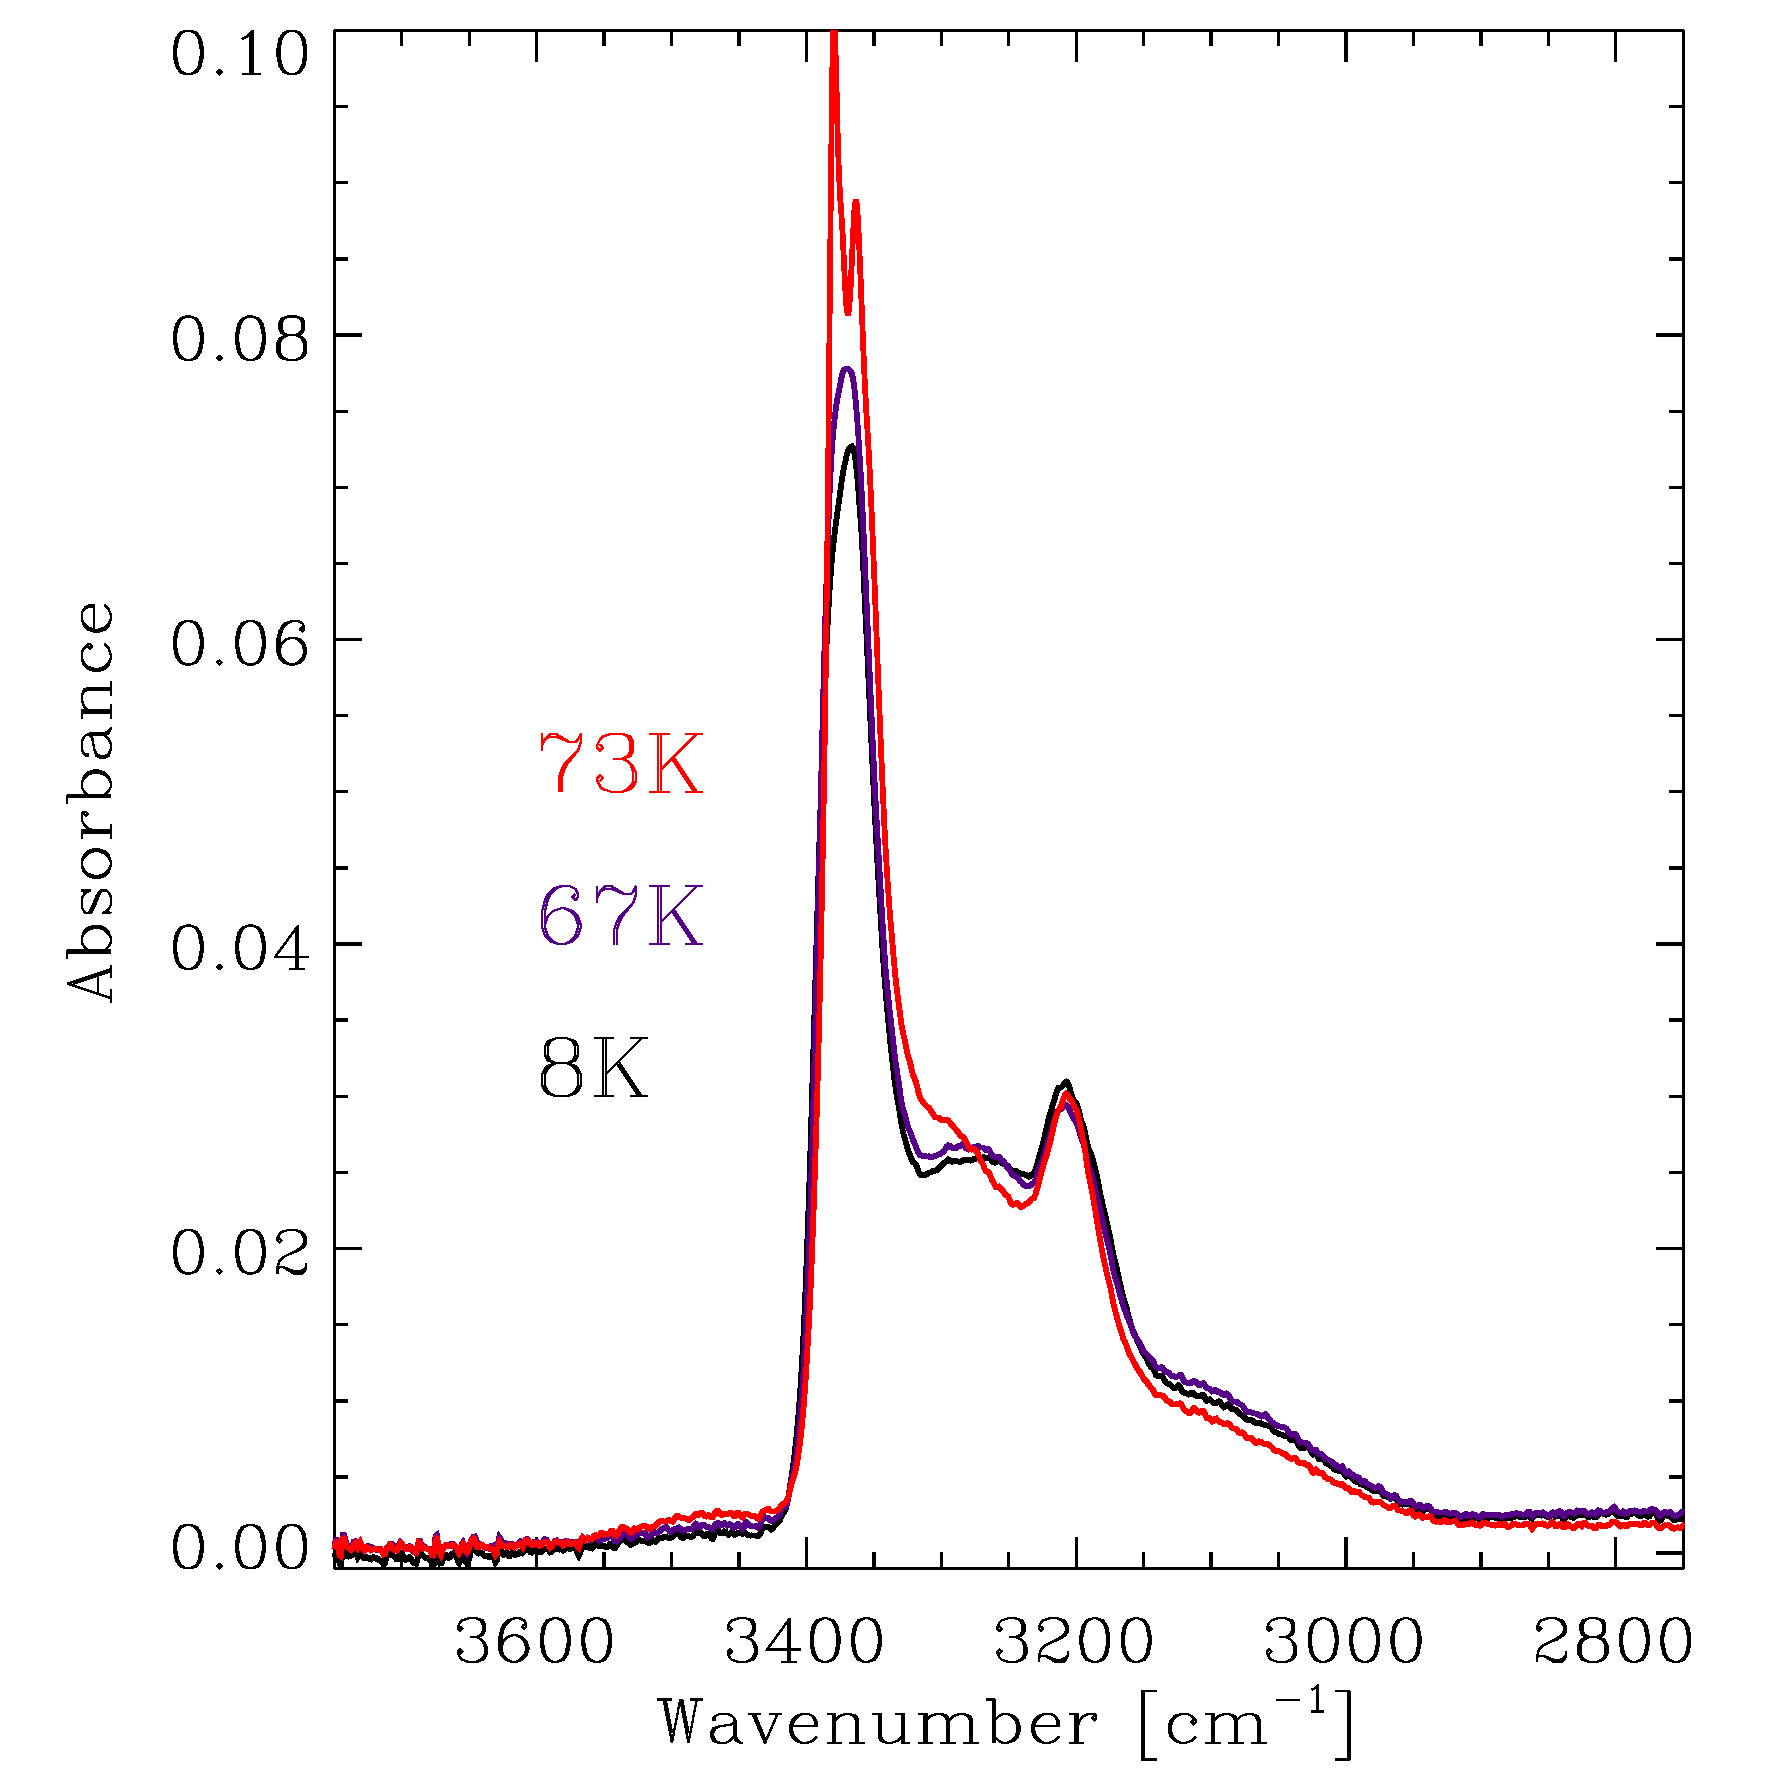
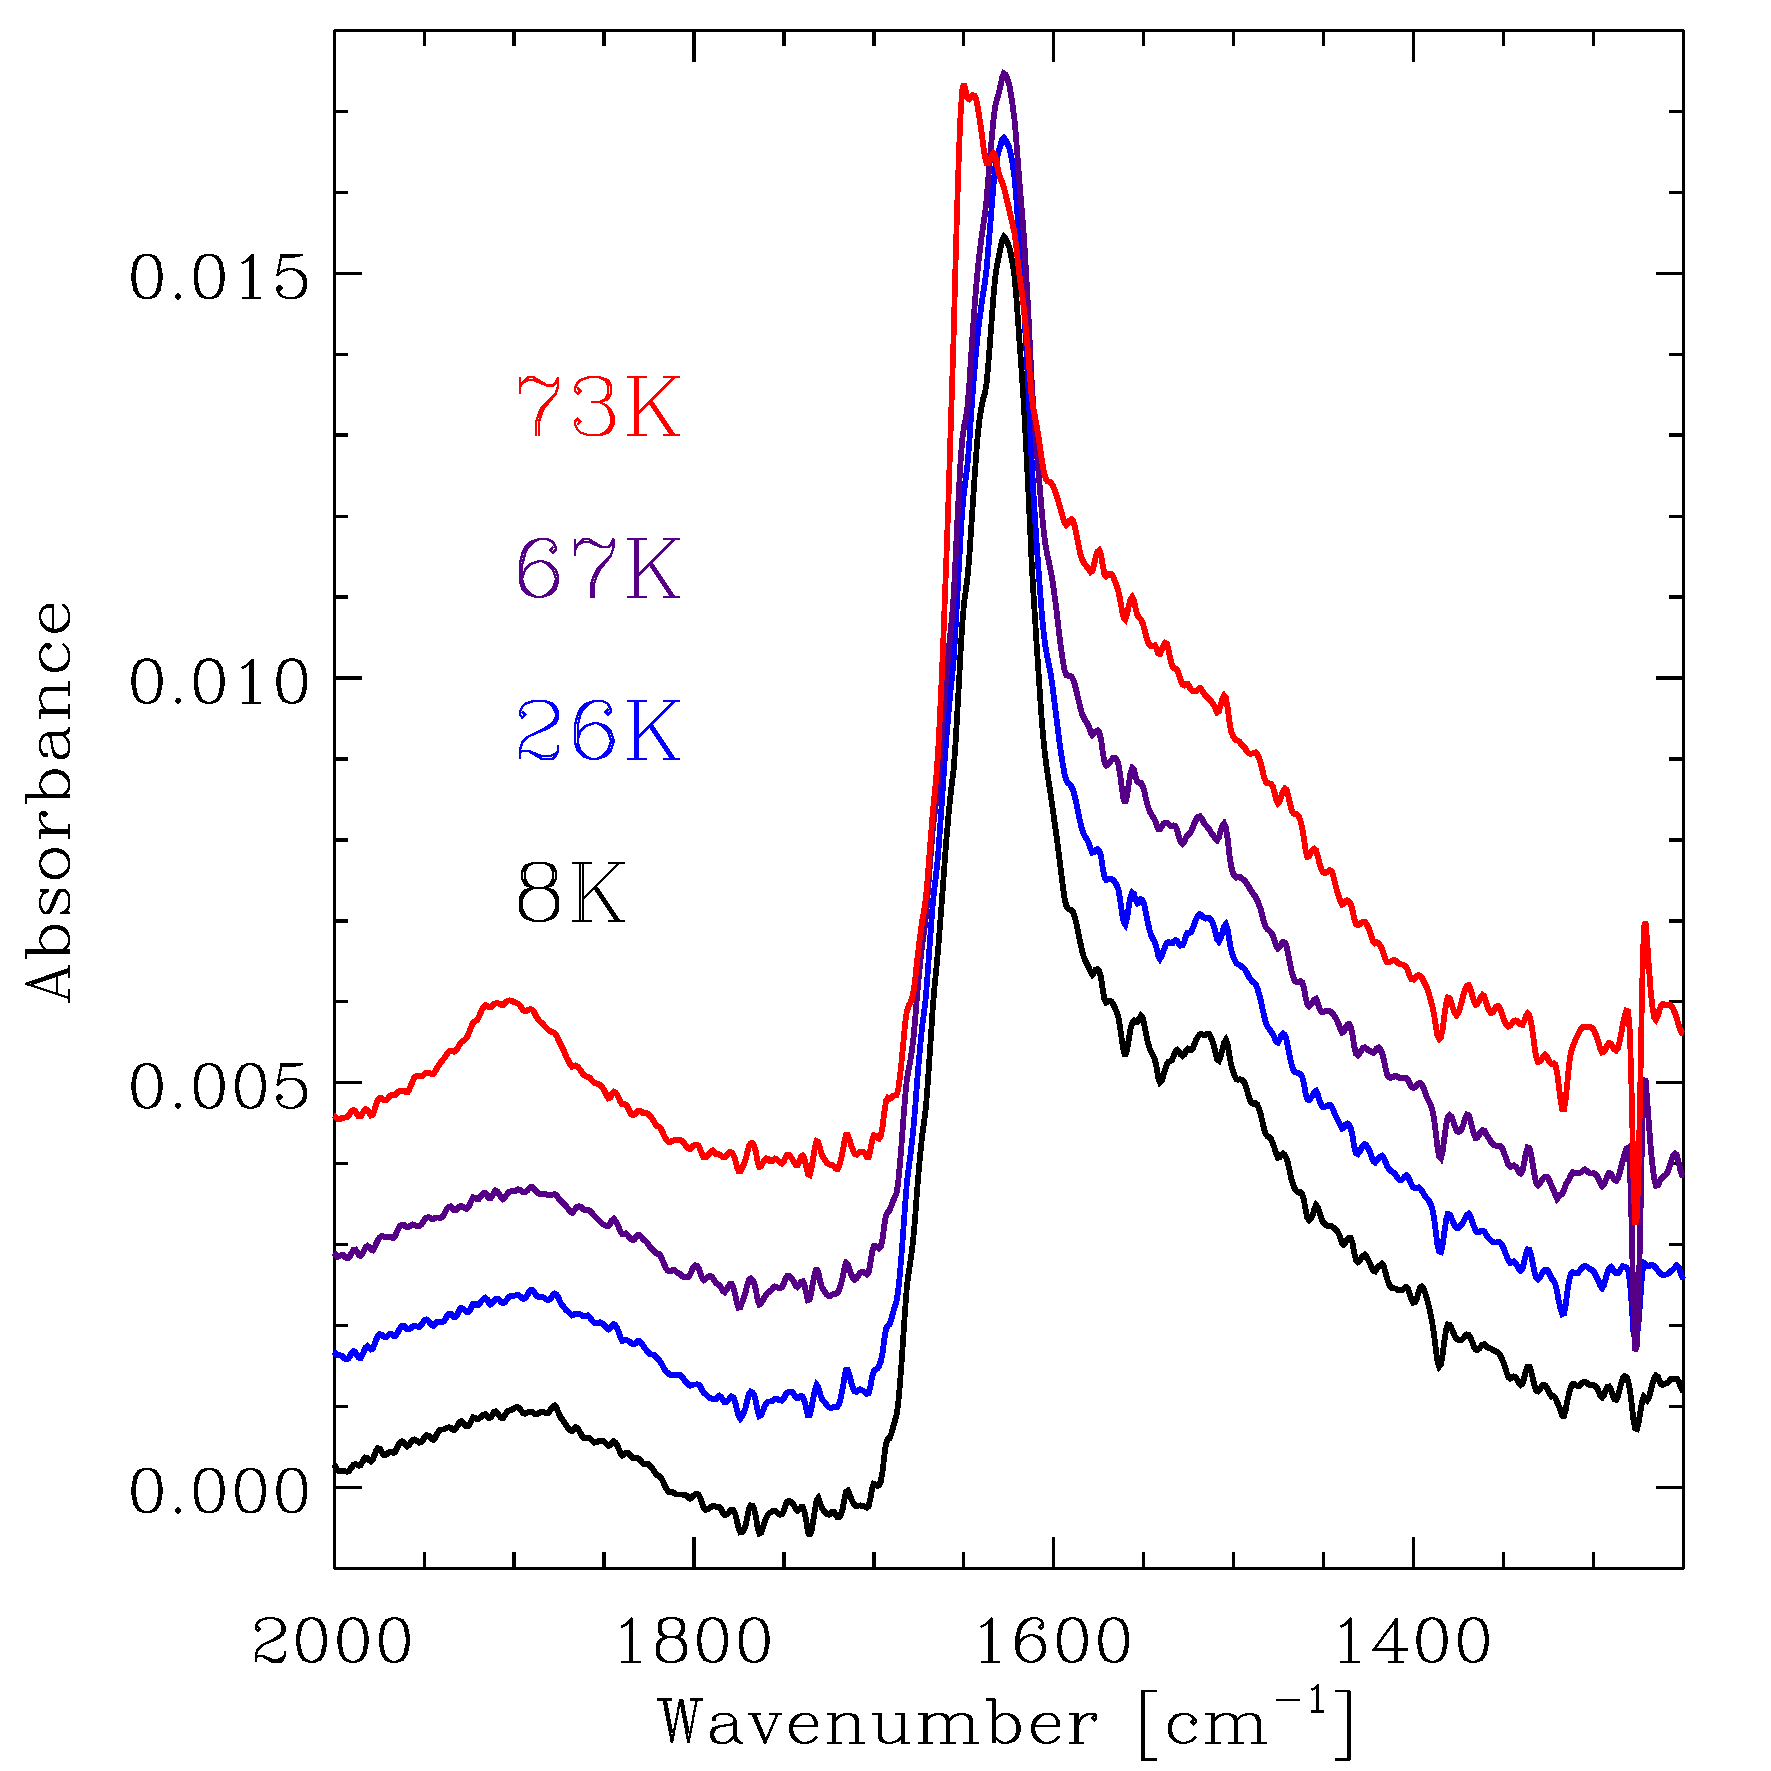
Photodissociation in the gas phase of NH3 molecules readily leads to the formation of NH and NH⋅⋅ radicals due to the loss of one or two hydrogen atoms, respectively, although the formation of ground-state NH radicals is spin-forbidden (Okabe (1978)). Formation of NH during irradiation of pure NH3 ice was reported in Gerakines et al. (1996) and Loeffler & Baragiola (2010) thanks to an IR peak detected above 1500 cm-1 on the red wing of the NH3 bending band. This peak is observed in the right panel of Fig. 1. In addition, a decrease in the intensity ratio between the symmetric and antisymmetric N-H stretching modes in the left panel of Fig. 1 is probably due to the contribution of the absorption corresponding to the antisymmetric N-H stretching mode of NH (Milligan & Jacox (1965)). At the same time, a wide shoulder at 3100 cm-1 on the red wing of the N-H stretching band shown in the left panel of Fig. 1 could be attributed to the imidogen radical (NH⋅⋅; Rosengren & Pimentel (1965)). During the warm-up phase of the experiment, after photoprocessing of the ice sample is complete, the mobility of these radicals is increased. Diffusion and subsequent reaction of the radicals led to a decrease of their IR features. The IR peak at 1500 cm-1 corresponding to the bending mode of the NH radical, disappears between 26 K and 73 K, as shown in the right panel of Fig. 2. At 67 K, the intensity of this feature is roughly half of that at 8 K, and has completely disappeared at 73 K. In addition, a slight decrease in the shoulder at 3100 cm-1 corresponding to the imidogen radical is observed at temperatures above 67 K (left panel of Fig. 2).
During irradiation, NH⋅⋅ and NH radicals can be dissociated by subsequent photons leading to the production of H and N atoms, that recombine to form H2 and N2 molecules (see Loeffler & Baragiola (2010), where additional pathways to the formation of these photoproducts are reported), which are IR inactive due to the lack of an electric dipole moment. Formation of these molecules is confirmed thanks to the temperature-programmed desorption (TPD) of the irradiated ices during the warm-up phase of the experiments (see Sect. 3.1.2). In addition, formation of hydrazine (N2H4) by recombination of two NH radicals, or reaction of a NH⋅⋅ radical with a NH3 molecule (Loeffler & Baragiola (2010)), is also reported at a temperature of 10 K in Gerakines et al. (1996). Although no IR absorption corresponding to this molecule was detected during our experimental simulations, formation of this molecule was also confirmed during the TPD of the irradiated ices (Sect. 3.1.2).
3.1.2 Temperature-programmed desorption of the irradiated NH3 ice
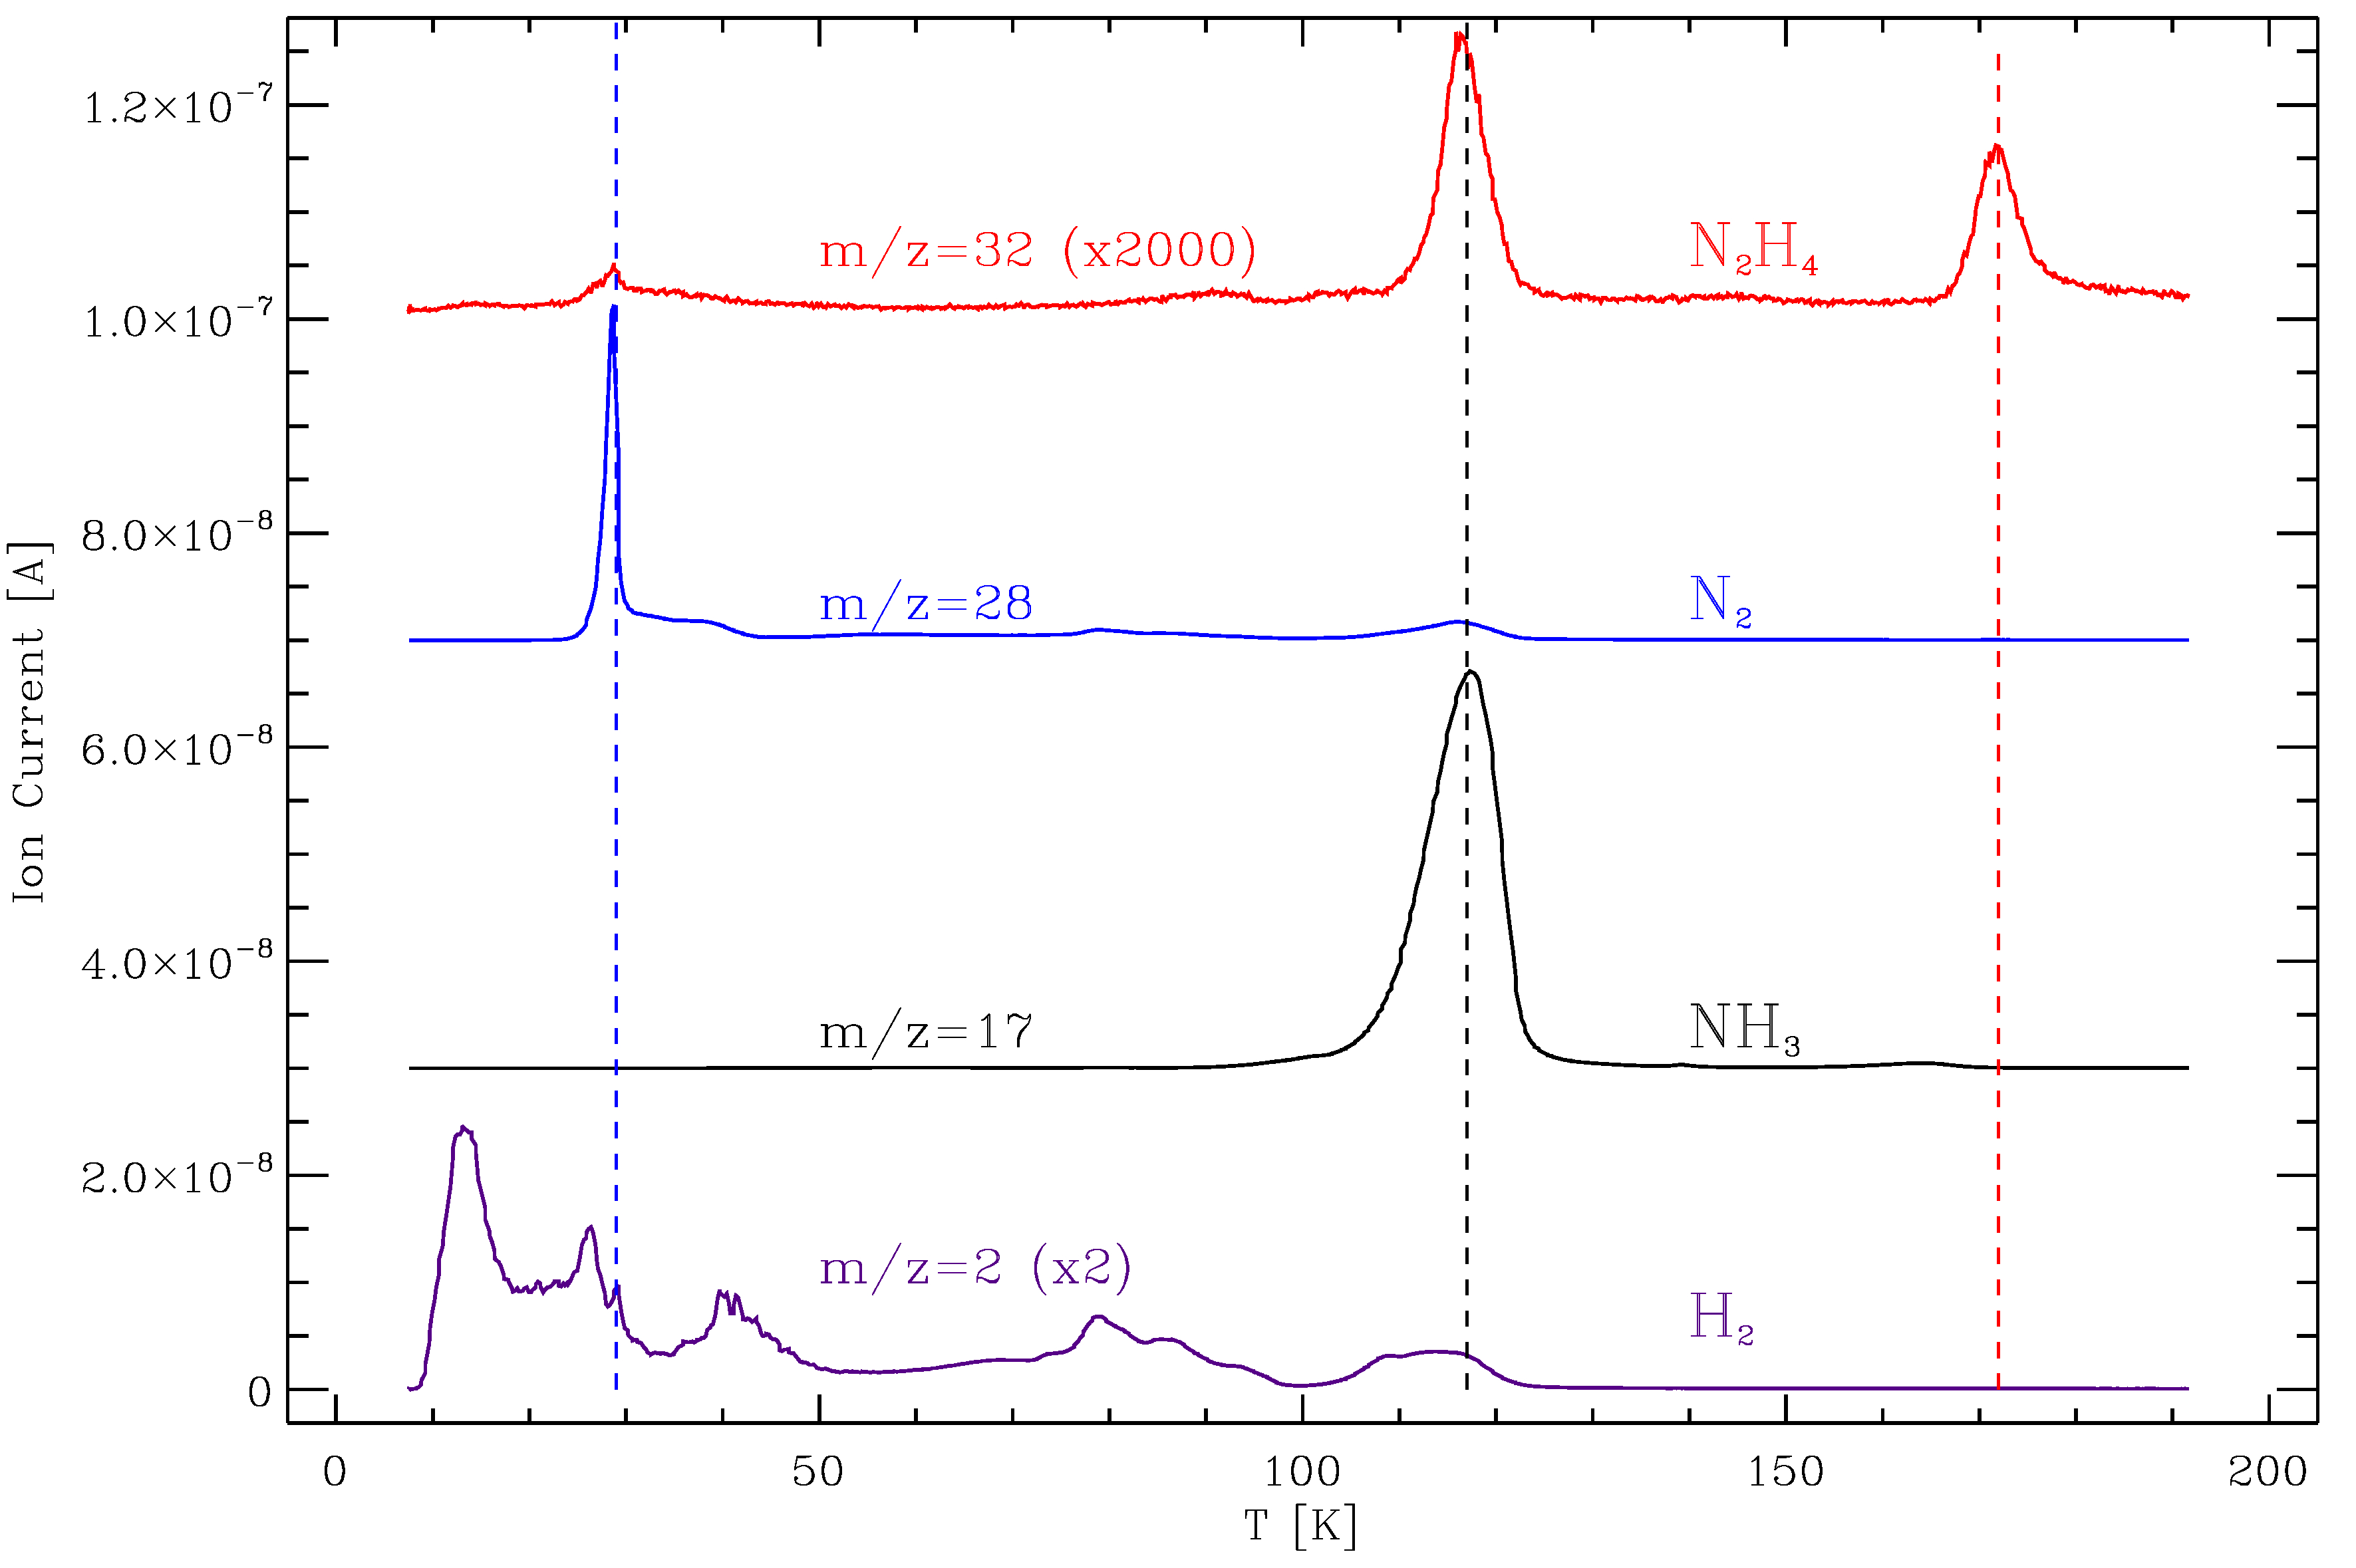
After photoprocessing of the ice samples, a constant heating rate was applied to perform the TPD of the irradiated ices. Thermal desorption of ammonia and the photoproducts H2, N2, and N2H4 was detected by the QMS at a given temperature according to their volatility, as shown in Fig. 3. In particular, desorption of H2 molecules was observed at a wide range of temperatures, since the very beginning of the warm-up phase of the experiment, due to the high volatility of this species. A desorption peak corresponding to most of the photoproduced N2 molecules was observed at 29 K (slightly higher than the desorption temperature reported in Fayolle et al. (2016) for pure N2 ices, probably due to the effect of the NH3 matrix). On the other hand, the hydrazine molecules finally desorbed at 172 K, a desorption temperature 10-20 K lower than that reported in Roux & Wood (1983) for experiments performed in a high-vacuum chamber with a base pressure five orders of magnitude higher compared to the one in the ISAC setup.
| Irradiation period | Fluencea | (NH3)b | (N2)b |
| (min) | 1017 (photons cm-2) | 10-3 () | |
| 0 - 10 | 1.2 | 2.05 | 1.51 |
| 10 - 20 | 2.4 | 2.12 | 1.36 |
| 20 - 30 | 3.6 | 1.89 | 2.18 |
| 30 - 40 | 4.8 | 2.28 | 2.41 |
| 40 - 50 | 6.0 | 1.92 | 2.64 |
| 50 - 60 | 7.2 | 2.01 | 3.05 |
| 60 - 180 | 21.6 | 1.74 | 5.86 |
3.2 Photodesorption from pure NH3 ice
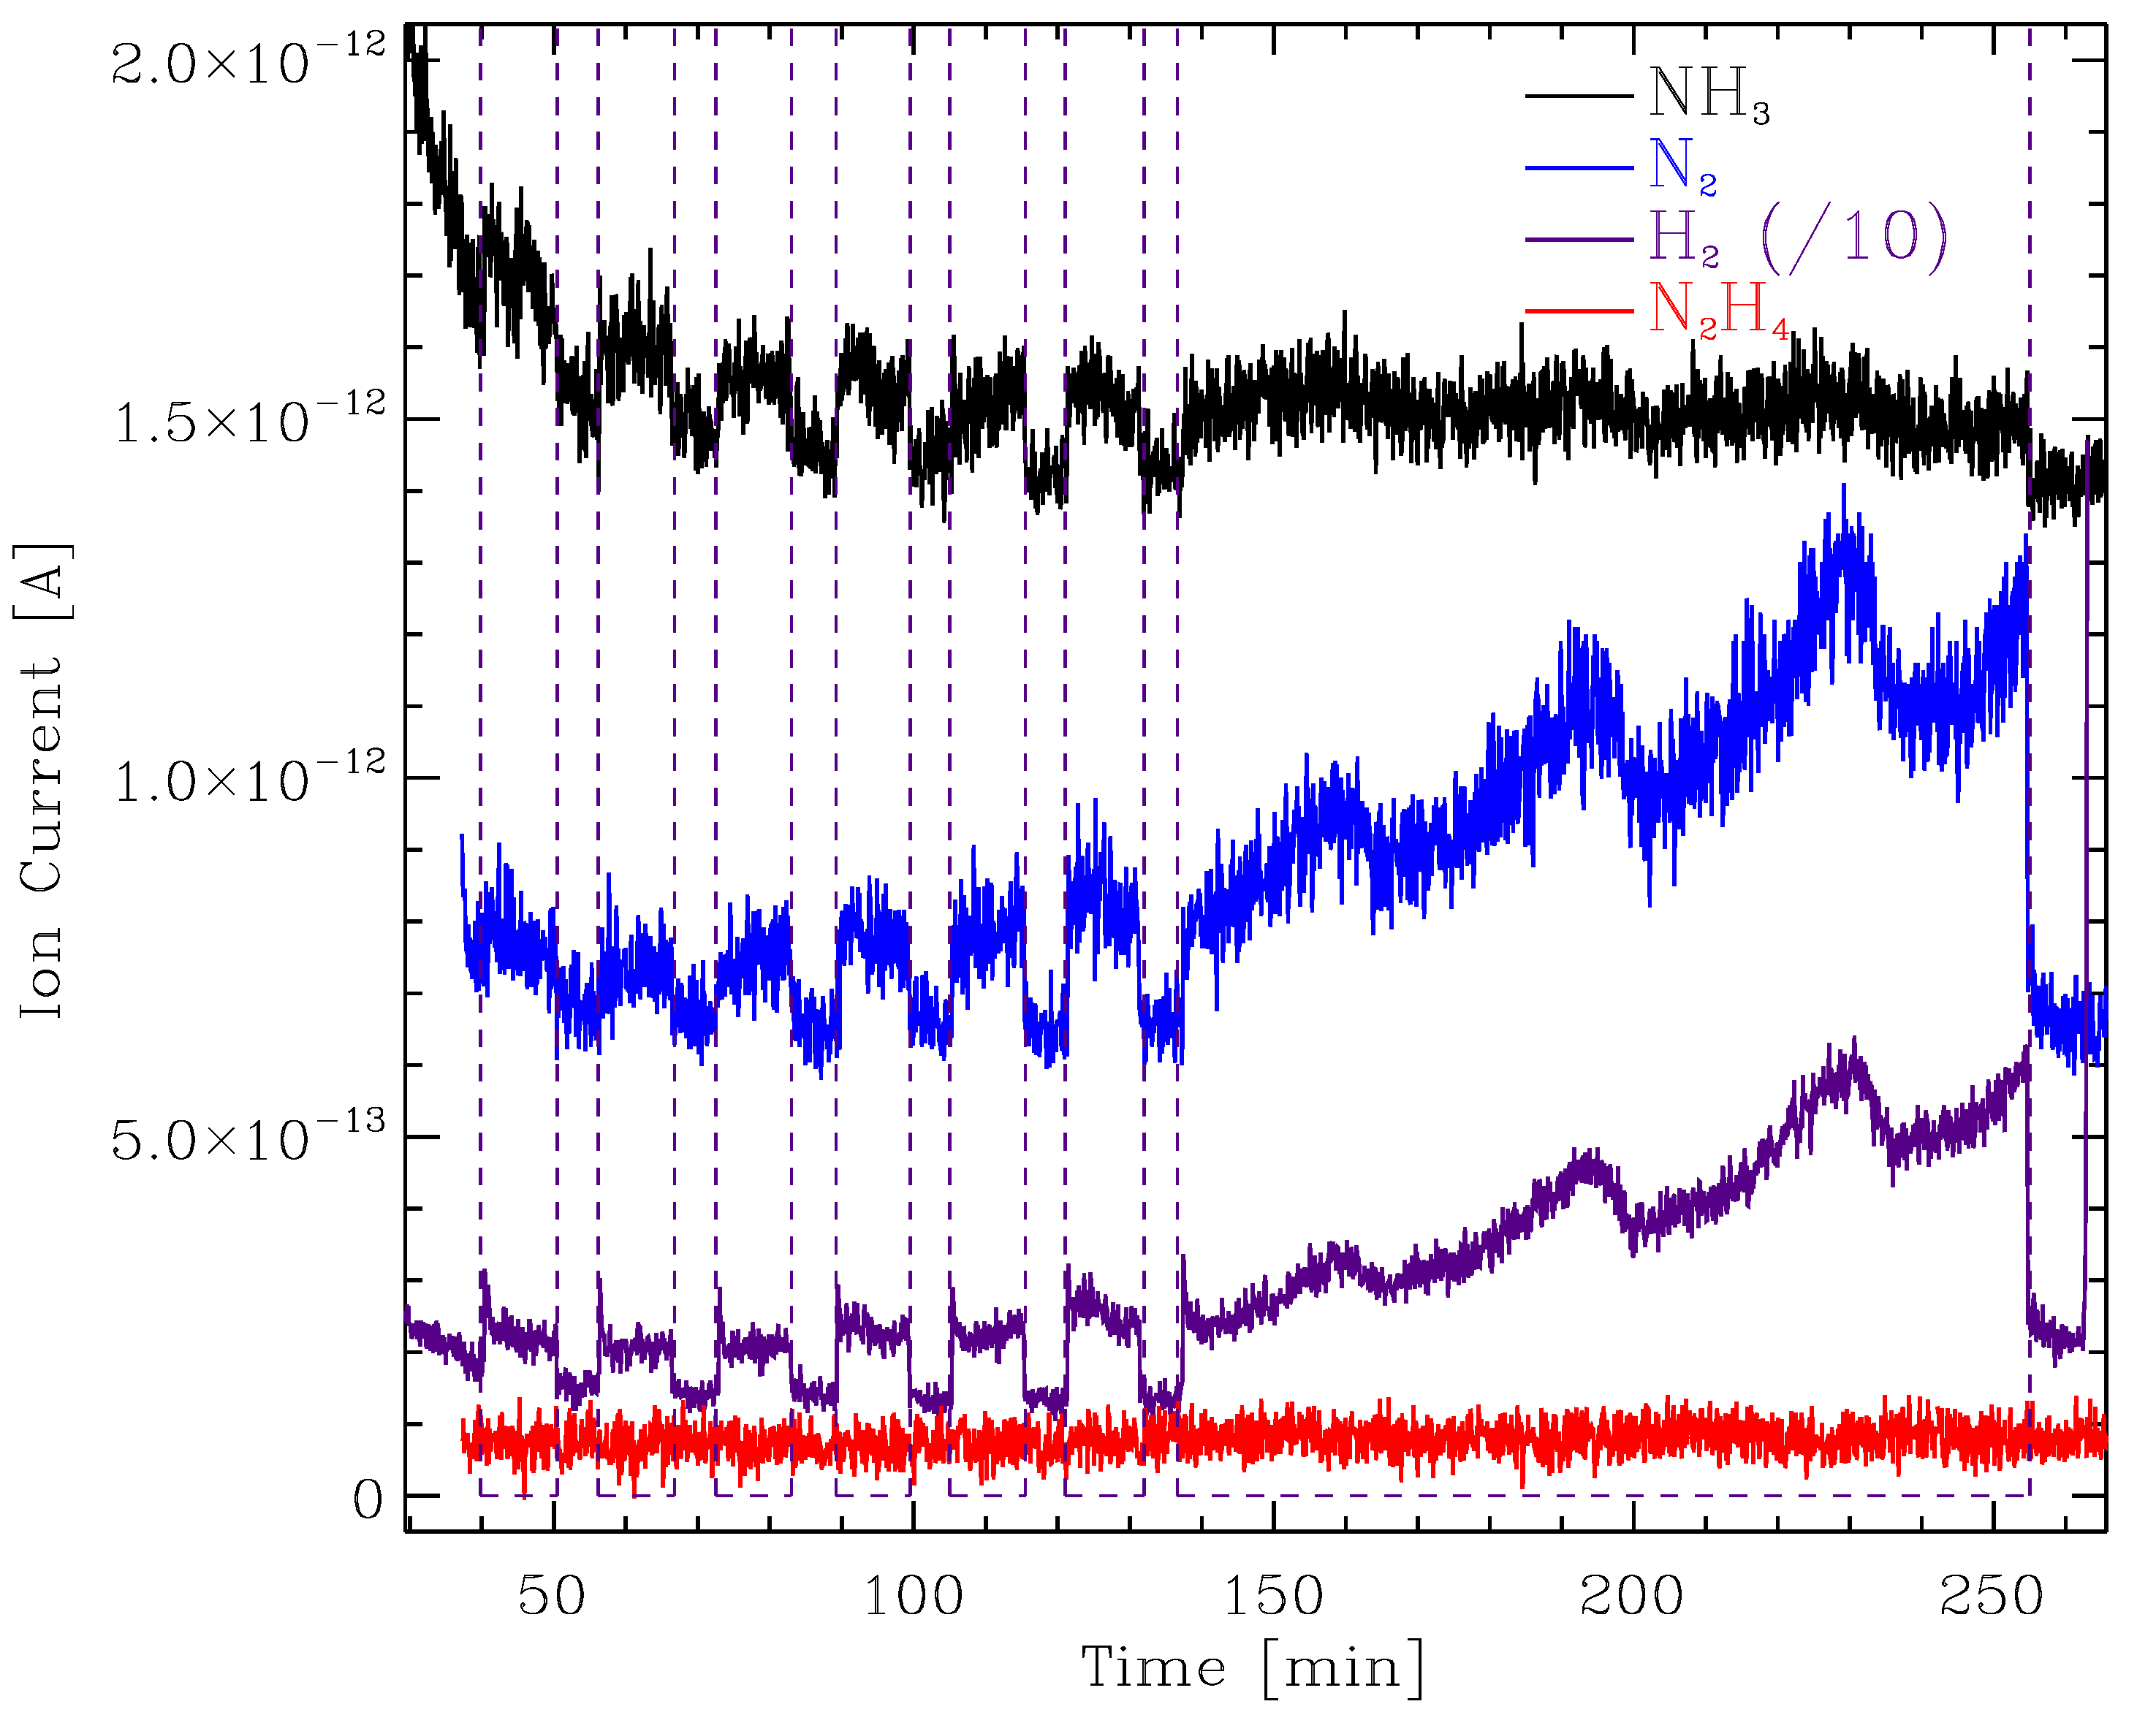
During irradiation of the ice samples, the photodesorbing molecules were detected in the gas phase by the QMS. In particular, photodesorption led to an increase on the signal of the m/z fragments of the photodesorbing molecules during every irradiation interval. The measured ion current of the main mass fragments corresponding to NH3 (m/z = 17), and the three photoproducts: H2 (m/z = 2), N2 (m/z = 28), and N2H4 (m/z = 32), are shown in Fig. 4. Photodesorption of the former three species was detected, as in Nishi et al. (1984) and Loeffler & Baragiola (2010), while N2H4 was not found to photodesorb. The integrated QMS ion currents were converted into photodesorbing column densities using Equations 2 and 3, the parameter values shown in Table 2, and a = 5.55 10-12 A min ML-1. The ratio of the photodesorbing column densities in every irradiation period and the incident fluence during the same period led to the average photodesorption yield for every irradiation interval shown in Table 3. Quantification of the photodesorbing H2 molecules was not included since the measured values suffered from background H2 contamination, which is the most usual contaminant in UHV chambers.
Photodesorption of NH3 molecules took place with an average photodesorption yield of 2.1 x 10⁻³ , that remained constant during the whole experiment (see Table 3). This is similar, within errors, to the photodesorption yield indirectly measured in the solid phase by Loeffler & Baragiola (2010) with a quartz-crystal microbalance (QCM)666The QCM measured the total ice mass loss, which was assigned mostly to ejected NH3 molecules, although it included any other photodesorbing product. during photoprocessing of a pure NH3 ice grown at 40 K using a 193 nm ArF laser.
During irradiation of pure ice samples, it is not possible to elucidate whether photodesorption of the original ice component takes place through a direct mechanism or through a mechanism involving energy transfer attending only to the evolution of the photodesorption yield with fluence. This can only be done for the photodesorption of photoproducts, as explained in Sect. 1. Nishi et al. (1984) measured the energy distribution of the photodesorbing NH3 molecules from a pure NH3 ice grown at 90 K and irradiated with a 193 nm ArF laser, using a time-of-flight (TOF) mass spectrometer. Two energy components with mean translational energies of 0.17 eV and 0.65 eV, respectively, were found. The low energy component was associated to NH3 molecules photodesorbing through a mechanism involving energy transfer from the absorbing molecule in the bulk of the ice to a surface molecule. This is similar to the DIET mechanism involving energy transfer described in Sect. 1. In this case, absorption of a photon led to a transition to a Wannier exciton state that subsequently propagated through the crystal approaching a weakly bound edge molecule that acquired linear momentum due to the electronic repulsive force. On the other hand, the high energy component, that accounted for half of the photodesorbing molecules, was associated to excited surface molecules, probably desorbing after recombination of a previously photodissociated NH3 molecule.
Photodesorption of H2 and N2 molecules took place with an increasing photodesorption yield with fluence, as reported in Loeffler & Baragiola (2010). The photodesorption yield of N2 was found to be 1.4 x 10⁻³ (i.e., on the order of that of NH3) for a fluence of up to 2.4 1017 photons cm-2, and then gradually raised, being 4 times higher when the total fluence was 2.2 1018 (see Table 3). In this case, the increasing photodesorption yield is related to the accumulation of photoproduced H2 and N2 molecules in the ice sample prior to their desorption into the gas phase. Therefore, there is a significant contribution of indirect photodesorption mechanisms involving energy transfer. These mechanisms require the absorption of a new photon after the formation of the photoproducts, as explained in Sect. 1, in contrast to the direct photodesorption mechanisms where desorption occurs immediately after the formation of the molecules, without the need of absorbing a new photon. In that case, the photoproduct molecules could not accumulate on the surface of the ice before their desorption, leading to a constant photodesorption yield with fluence (see Martín-Doménech et al. (2015, 2016); Cruz-Díaz et al. (2016, 2017)).
4 Astrophysical implications
Ammonia ice is thought to form early at the onset of the diffuse cloud collapse that leads to the formation of dense clouds where ice mantles are usually detected, by hydrogenation reactions of N atoms on the surface of dust grains. The abundance of NH3 with respect to H2O in the ice mantles is around 5% in dense clouds and also in the cold circumstellar envelopes around protostars (see Boogert et al. (2015), and references therein). Its importance, though, is beyond all doubts since it is the only confirmed source of N atoms in interstellar ices. The detection of ammonia in the gas-phase of the cold ISM was already reported in Cheung et al. (1968).
NH3 ice molecules are photoprocessed along with all the ice components in the interior of dense clouds thanks to the secondary UV field mentioned in Sect. 1, leading to photochemical reactions that produce new ice molecules and photodesorption processes that allow the presence of molecules in the gas phase of cold interstellar regions where thermal desorption is negligible. These processes can be simulated in the laboratory under astrophysically relevant conditions. For the VUV flux of the lamp used (see Sect. 2), the ice samples experience a fluence of 3 1017 photons cm-2 after 30 minutes of irradiation in our experiments, which is similar to the fluence experienced by the ice mantles during the expected lifetime of a molecular cloud, assuming a secondary UV flux of 104 photons cm-2 s-1(Shen et al. (2004)). The six components confirmed to be present in the interstellar ices are distributed over two distinct ice layers as the result of the formation process (see Boogert et al. (2015), and references therein). A polar ice layer is formed first on the surface of dust grains, dominated by H2O and including NH3, CH4, and a fraction of the CO2 ice molecules. On top of this polar ice layer, an apolar layer is subsequently formed, mainly composed by CO along with the rest of the CO2 molecules and probably CH3OH. In any case, irradiation experiments of pure ices are used as benchmarks in the study of the photoprocessing of more realistic multicomponent ices.
In our experimental simulations using a MDHL, whose emission spectrum is similar to that expected in the interior of dense clouds, photodesorption of NH3 molecules is observed to proceed with a constant yield with fluence during irradiation of a pure NH3 ice ( (NH3) = 2.1 x 10⁻³ ). This value is on the order of the observed H2O photodesorption during photoprocessing of pure H2O ices using the same UV lamp, (Cruz-Díaz et al. (2017)), while it is one order of magnitude lower than the photodesorption yield of CO molecules during photoprocessing of a pure CO ice (Muñoz Caro et al. (2010)), and one order of magnitude higher than that measured for CO2 (see Table 4) under similar conditions (Martín-Doménech et al. (2015)). Photodesorption of NH3 molecules from an ice mixture dominated by water will be addressed in a forthcoming paper, and is expected to be lower than the value presented in this paper for segregated (pure) NH3 ice (Loeffler & Baragiola (2010)).
On the other hand, we also observed photodesorption of the produced N2 molecules, with a yield that increased for fluences higher than 2.4 1017 photons cm-2. For a fluence similar to that experienced by the ice mantles in the expected lifetime of a dense cloud (3 1017 photons cm-2), the average photodesorption yield of N2 molecules was similar to that observed for the NH3 molecules ( (N2) = 1.7 x 10⁻³ ). Photodesorption of N2 molecules from a pure N2 ice is expected to be negligible, due to the low VUV-absorption cross section of this ice (the average absorption cross section is 7.0 10-21 cm2, while for NH3 ices it is 6.1 10-18 cm2; Cruz-Díaz et al. (2014a, b)). Detection of gas-phase N2 was reported in Knauth et al. (2004) from far-UV observations toward the star HD 124314, with an abundance that could not be explained with gas-phase chemical models for either diffuse or dense clouds.
5 Conclusions
We have performed experimental simulations of the UV photoprocessing of NH3 ice using a MDHL with an emission spectrum similar to that expected to be present in the interior of dense clouds. IR spectroscopy in transmittance was used to monitor the solid sample during irradiation. Formation of NH and NH⋅⋅ radicals due to the photodissociation of NH3 molecules was observed thanks to the appareance of IR features at 1500 cm-1 and 3100 cm-1, respectively. The photoproducts H2 and N2 are not IR active, and the N2H4 IR features did not reach the sensitivity limit in the spectra of the irradiated ices, but they were detected in the gas phase after thermal desorption during the TPD of the photoprocessed ice thanks to a QMS.
In addition, photodesorption of NH3 and the photoproducts H2 and N2 were detected by the QMS during photoprocessing of the ice samples. Photodesorption of NH3 took place with a constant yield with fluence, as it is the case for other species during irradiation of their pure ices. On the other hand, the photodesorption yield of H2 and N2 were observed to increase with fluence, pointing toward a significant contribution of indirect photodesorption mechanism involving energy transfer from the absorbing molecule to a previously formed H2 or N2 molecule, that subsequently desorbed. This kind of mechanism allows accumulation of the photoproducts prior to their desorption, leading to an increase of the number of molecules available for the photodesorption and, therefore, an increase of the photodesorption yield with fluence.
The calibration of the QMS allowed us to quantify the photodesorption yields for the desorbing molecules. NH3 molecules were found to photodesorb with an average yield of 2.1 x 10⁻³ , which is of the same order than the photodesorption measured for H2O molecules during irradiation of a pure water ice (Cruz-Díaz et al. (2017)). N2 molecules are not expected to efficiently photodesorb from pure N2 ices ( (N2) 2 10-4 ; Öberg et al. (2009b)), probably due to their low VUV-absorption cross section (Cruz-Díaz et al. (2014b)). During irradiation of a pure NH3 ice, a photodesorption yield similar to that of NH3 molecules was measured for N2 molecules, for a fluence equivalent to that experienced by ice mantles during the expected lifetime of dense clouds ( (N2) = 1.7 x 10⁻³ ), although photodesorption yields up to four times higher were measured for higher fluences.
Acknowledgments
This research was financed by the Spanish MINECO under projects AYA2011-29375 and AYA2014-60585.
References
- Andersson & van Dishoeck (2008) Andersson. S., & van Dishoeck, E.F. 2008, A&A, 491, 907
- Bahr & Baragiola (2012) Bahr, D.A., Baragiola, R.A. 2012, ApJ, 761, 1, id.36
- Bergin et al. (2001) Bergin, E.A., Ciardi, D.R., Lada, C.J., Alves, J., & Lada, E.A. 2001, ApJ, 557, 209
- Bertin et al. (2012) Bertin, M., Fayolle, E. C., Romanzin, C., Öberg, K.I., Michaut, X., et al. 2012, PCCP, 14, 9929
- Bertin et al. (2013) Bertin, M., Fayolle, E. C., Romanzin, C., Ponderoso, H.A.M., Michaut, X., et al. 2013, ApJ, 779, 120
- Bertin et al. (2016) Bertin, M., Romanzin, C., Doronin, M., Philippe, L. Jeseck, P., et al. 2016, ApJL, 817, 2, L12
- Boogert et al. (2015) Boogert, A.C.A., Gerakines, P.A., & Whittet, D.C.B. 2015, ARA&A, 53, 541
- Cecchi-Pestellini & Aiello (1992) Cecchi-Pestellini, C., & Aiello, S. 1992, MNRAS, 258, 125
- Chen et al. (2010) Chen, Y.-J., Chu, C.-C, Lin, Y.-C. et al. 2010, Advances in Geosciences, 25, 259
- Chen et al. (2014) Chen, Y.-J., Chuang, K.-J, Muñoz Caro, G. M., Nuevo, M., Chu, C.-C., et al. 2014, ApJ, 781, 15
- Cheung et al. (1968) Cheung, A.C., Rank, D.M., Townes, C.H., Thornton, D.D., & Welch, W.J. 1968, Phys. Rev. Lett. 21, 1701
- Cruz-Díaz et al. (2016) Cruz-Díaz, G.A., Martín-Doménech, R., Muñoz Caro, G.M., & Chen, Y.-J. 2016, A&A, 592, A68
- Cruz-Díaz et al. (2017) Cruz-Díaz, G.A., Martín-Doménech, R., Moreno, E. Muñoz Caro, G.M., & Chen, Y.-J. 2017, submitted
- Cruz-Díaz et al. (2014a) Cruz-Díaz, G.A., Muñoz Caro, G.M., Chen, Y.-J., & Yih, T.-S. 2014a, A&A, 562, A119
- Cruz-Díaz et al. (2014b) Cruz-Díaz, G.A., Muñoz Caro, G.M., Chen, Y.-J., & Yih, T.-S. 2014b, A&A, 562, A120
- Dupuy et al. (2017) Dupuy, R., Bertin, M., Féraud, G., Michaut, X., Jeseck, P., et al. 2017, A&A, 603, A61
- Fayolle et al. (2016) Fayolle, E., Balfe, J. Loomis, R., Bergner, J., Graninger, D., et al. 2016, ApJL, 816, 2, L28
- Fayolle et al. (2011) Fayolle, E., Bertin, M., Romanzin, C., Michaut, X., Öberg, K., et al. 2011, ApJL, 739, L36
- Fayolle et al. (2013) Fayolle, E., Bertin, M., Romanzin, C., Poderoso, H.A.M., Philippe, L., et al. 2013, A&A, 556, A122
- Fillion et al. (2014) Fillion, J.-H., Fayolle, E., Michaut, X., Doronin, M., Philippe, L., et al. 2014, Faraday Discuss., 168, 533
- Gerakines et al. (1996) Gerakines, P.A., Schutte, W.A., & Ehrenfreund, P. 1996, A&A, 312, 289
- Gibb et al. (2004) Gibb, E.L., Whittet, D.C.B., Boogert, A.C.A, & Tielens, A.G.G.M. 2004, ApJSS, 151, 35
- Giuliano et al. (2014) Giuliano, B.M., Escribano, R.M., Martín-Doménech, R. Dartois, E., & Muñoz Caro, G.M., 2014, A&A, 565, A108
- Gredel et al. (1989) Gredel, R., Lepp, S., Dalgarno, A., & Herbst, E. 1989, ApJ, 347, 289
- Kaiser et al. (1995) Kaiser, R. I., Jansen, P., Petersen, K., & Roessler, K. 1995, Rev. Sci. Instrum. 66, 5226
- Knauth et al. (2004) Knauth, D.C., Anderson, B.-G., McCandliss, S.R., & Moss, H.W. 2004, Nature, 429, 636
- Loeffler & Baragiola (2010) Loeffler, M.J., & Baragiola, R.A. 2010, J. Chem. Phys., 133, 214506
- Martín-Doménech et al. (2015) Martín-Doménech, R., Manzano-Santamaría, J., Muñoz Caro, G.M., Cruz-Díaz, G.A., Chen, Y.-J., et al. 2015, A&A, 584, A14
- Martín-Doménech et al. (2016) Martín-Doménech, R., Muñoz Caro, G.M., & Cruz-Díaz, G.A. 2016, 589, A107
- Milligan & Jacox (1965) Milligan, D.E., & Jacox, M.E. 1965, J. Chem. Phys., 43, 12, 4487
- Muñoz Caro et al. (2016) Muñoz Caro, G. M., Chen, Y.-J., Aparicio, S., Jiménez-Escobar, A., Rosu-Finsen, A., et al. 2016, A&A, 589, A19
- Muñoz Caro et al. (2010) Muñoz Caro, G. M., Jiménez-Escobar, A., Martín-Gago, J.Á. et al. 2010, A&A, 522, A108
- Nishi et al. (1984) Nishi, N., Shinohara, H., & Okuyama, T. 1984, J. Chem. Phys., 80, 3898
- Öberg et al. (2016) Öberg, K.I. 2016, Chem. Rev., 116 (17), 9631
- Öberg et al. (2011) Öberg, K.I., Boogert, A.C.A., Pontoppidan, K.M., van den Broek, S., van Dishoeck, E.F., et al. 2011, ApJ, 740, 109
- Öberg et al. (2007) Öberg, K.I., Fuchs, G.W., Awad, Z., Fraser, H., Schlemmer, S., et al. 2007, ApJL, 662, L23
- Öberg et al. (2009a) Öberg, K.I., Garrod, R.T., van Dishoeck, E.F., & Linnartz, H. 2009, A&A, 504, 3, 891
- Öberg et al. (2009b) Öberg, K.I., van Dishoeck, E.F., & Linnartz, H. 2009, A&A 496, 281
- Okabe (1978) Okabe, H. 1978, Photochemistry of small molecules, ed. John Wiley & Sons, New York
- Rosengren & Pimentel (1965) Rosengren, K., & Pimentel, G.C. 1965, J. Chem. Phys., 43, 2, 507
- Roux & Wood (1983) Roux, J.A., & Wood, B.E. 1983, J. Opt. Soc. Am., 73, 9, 1181
- Satorre et al. (2013) Satorre, M.Á., Leliwa-Kopystynski, J., Satonja, C., & Luna, R. 2013, Icarus, 225, 1, 703
- Schutte et al. (1996) Schutte, W. A., Gerakines, P. A., Geballe, T. R., van Dishoeck, E. F., & Greenberg, J. M. 1996, A&A, 309, 633
- Shen et al. (2004) Shen, C.J., Greenberg, J.M., Schutte, W.A., & van Dishoeck, E.F. 2004, A&A, 415, 203
- van Hemert et al. (2015) van Hemert, M.C., Takahashi, J., & van Dishoeck, E.F. 2015, J. Chem. Phys. A, 119, 24, 6354
- Wilacy & Langer (2000) Wilacy, K., & Langer, W.D. 2000, ApJ, 544, 903
- Yuan & Yates (2013) Yuan, C., & Yates, J.T. 2013, J. Chem. Phys., 138, 15, 154303