On the signatures of flare-induced global waves in the Sun: GOLF and VIRGO observations
Abstract
Recently, several efforts have been made to identify the seismic signatures of flares and magnetic activity in the Sun and Sun-like stars. In this work, we have analyzed the disk-integrated velocity and intensity observations of the Sun obtained from the GOLF and VIRGO/SPM instruments, respectively, on board the SOHO space mission covering several successive flare events, for the period from 11 February 2011 to 17 February 2011, of which 11 February 2011 remained a relatively quiet day and served as a “null test” for the investigation. Application of the spectral analysis to these disk-integrated Sun-as-a-star velocity and intensity signals indicates that there is enhanced power of the global modes of oscillations in the Sun during the flares, as compared to the quiet day. The GOLF instrument obtains velocity observations using the Na I D lines which are formed in the upper solar photosphere, while the intensity data used in our analysis are obtained by VIRGO/SPM instrument at 862 nm, which is formed within the solar photosphere. Despite the fact that the two instruments sample different layers of the solar atmosphere using two different parameters (velocity v/s intensity), we have found that both these observations show the signatures of flare-induced global waves in the Sun. These results could suffice in identifying the asteroseismic signatures of stellar flares and magnetic activity in the Sun-like stars.
keywords:
Sun: activity – Sun: flares – Sun: oscillations – Sun: photosphere – Sun: chromosphere1 Introduction
In solar flares, large amount of energy is suddenly released in the solar atmosphere within the time-scales of a few tens of minutes. Apart from these high budget thermal radiations ( erg), flares also produce large amount of energetic particles that move at very high speeds (e.g., Miller et al., 1997; Aschwanden, 2002; Emslie et al., 2005; Saint-Hilaire & Benz, 2005; Benz, 2008; Holman et al., 2011; Aschwanden et al., 2016). With the advent of new and improved measurement techniques, several efforts have been made to understand the mechanisms involved in these explosive events occurring in the solar environment (e.g., Hudson & Ryan, 1995; Aschwanden, 2002; Lin, 2006; Benz, 2008; Holman et al., 2011; Caspi et al., 2015; Benz, 2017). It is generally believed that the magnetic energy stored in the solar active regions gets released during the flares and that is demonstrated in the form of emission of high budget thermal energies, variety of high energy electromagnetic radiations and energetic particles, and coronal mass ejections (CMEs) (Hundhausen et al., 1984; Walker, 1988; Webb & Cliver, 1995; Srivastava et al., 2000; Aschwanden, 2002; Holman et al., 2011; Aschwanden et al., 2017, and references therein). Large flares also produce energetic waves in the solar atmosphere and beneath the visible surface, such as Moreton waves (Moreton, 1960), and sunquakes (Kosovichev & Zharkova, 1998), respectively. The changes in the solar magnetic fields accompanying the flares show their signatures in the form of the evolution of photospheric and chromospheric magnetic fields (e.g., Wang et al., 1994; Hagyard et al., 1999; Lara, Gopalswamy, & DeForest, 2000; Sudol & Harvey, 2005; Metcalf, Leka, & Mickey, 2005; Petrie & Sudol, 2010; Wang & Liu, 2010, 2015; Kleint, 2017; Wang et al., 2017).
Soon after the discovery of global oscillation modes in the Sun (Leighton, Noyes, & Simon, 1962; Ulrich, 1970; Leibacher & Stein, 1971; Deubner, 1974), it was speculated by Wolff (1972) that solar flares could excite the free modes of oscillations of the entire Sun. The assumption behind this opinion of Wolff (1972) was that the flares would cause a thermal expansion that would drive a mechanical impulse due to a compression front moving sub-sonically into the solar interior. Since then, several efforts have been made to study the correlation between the solar transient events, such as solar flares and the coronal mass ejections, and the strength of global modes of oscillations in the Sun using data from various sources (Chaplin et al., 1995; Foglizzo, 1998; Foglizzo et al., 1998; Gavryusev & Gavryuseva, 1999; Ambastha & Antia, 2006; Richardson, Hill, & Stassun, 2012). All these studies could not uniquely asses the relation between the strength of global oscillation modes in the Sun and the transient events.
However, Karoff & Kjeldsen (2008) found a high correlation between the energy in the high-frequency part of the acoustic spectrum of the Sun above the acoustic cut-off frequency (the pseudo-mode region, García et al., 1998, 1999) and the solar soft X-ray flux during the flares. They used the Sun-as-a-star disk-integrated intensity observations of the Sun obtained by Variability of Solar IRradiance and Gravity (VIRGO; Fröhlich et al., 1995; Frohlich et al., 1997) instrument onboard Solar and Heliospheric Observatory (SOHO; Domingo, Fleck, & Poland, 1995) space mission and the disk-integrated soft X-ray emission (1–8 Å energy band) from the Sun observed by the Geostationary Operational Environmental Satellite (GOES; Garcia, 1994) satellites. Kumar et al. (2010) presented the analysis of the full-disk velocity observations of the Sun obtained from the Michelson and Doppler Imager (MDI; Scherrer et al., 1995) and the Sun-as-a-star disk-integrated velocity observations of the Sun obtained by the Global Oscillations at Low Frequencies (GOLF; Gabriel et al., 1995, 1997) instruments onboard SOHO for a few flare events. Their results indicated an enhancement of high-frequency global waves in the Sun during the flares. Kumar et al. (2011) further showed post-flare enhancements in the global modes of oscillations in the Sun for a different flare event.
Recently, using the observations from Kepler spacecraft (Borucki et al., 2010) of 73 flares on 39 solar-like stars, Karoff (2014) concluded that the photometric variability of solar-like stars showed significant changes at the time of the flares. Thus, if the flares in solar-like stars have indeed caused seismic signatures, it provides a genuine case to further investigate a causal relation between the strength of flares and the changes in the global oscillation modes in the Sun.
In this work, we investigate the influence of flares on the global modes of oscillations in the Sun using the Sun-as-a-star disk-integrated velocity and intensity observations obtained by the GOLF and VIRGO/SPM instruments, respectively, onboard the SOHO space mission for the period from 11 February 2011 to 17 February 2011, which covered several successive flare events.
In the following Sections, we first describe the observational data and the methods of our analysis, which is then followed by the results, and the conclusions with a discussion.
2 The Observational Data
The Sun remained highly active during the period from 12 February 2011 to 17 February 2011, since these days were populated with several sequential flare events. 11 February 2011 was relatively a quiet day with only a few short duration minor flares. This provided us the opportunity to use the observations obtained on 11 February 2011 to serve as a “null test” for our investigation related to flare-induced global waves in the Sun for the period from 12 February 2011 to 17 February 2011. We have chosen a time window of 8 hours on each day from 12 February 2011 to 17 February 2011 for our analysis in such a way that it covers the maximum number of flares on the given day. On contrary to this, the time window of 8 hours chosen on 11 February 2011 does not cover any flare events and also this is well separated from any minor flares that took place on this day. Fortunately, the time window of 8 hours considered in our analysis is a reasonable time to detect any flare-induced standing waves in the Sun, considering the sound crossing time inside the Sun to be around 2 hours (; where , average sound speed inside the Sun). In Table 1, we summarize the details of the period of observations considered in our analysis and the class of soft X-ray flares with their peak time which were observed with the GOES-15 satellite in the 1.0–8.0 Å band. We present below the details of velocity and intensity observations from GOLF and VIRGO/SPM, respectively, that have been used in our analysis.
| Date | Period of observation (UT) | Class of soft X-ray flares with peak time (UT) |
|---|---|---|
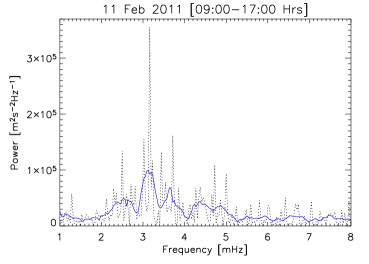
| 11 | 09:00-17:00 | No flares |
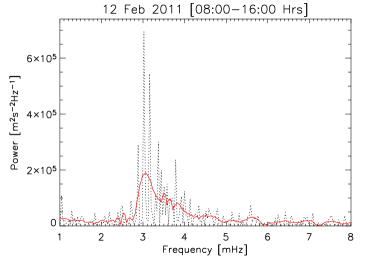
| 12 | 08:00-16:00 | B2.3(10:51), B1.0(11:54), B2.1(12:22), C2.6(15:06) |
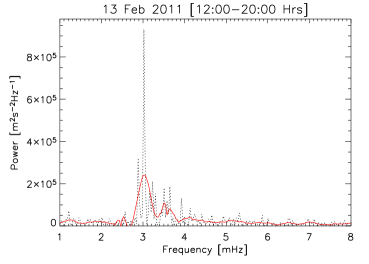
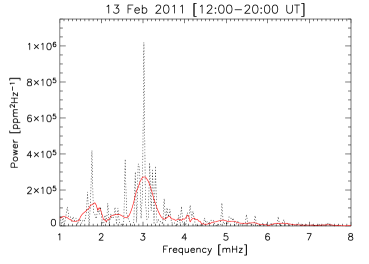
| 13 | 12:00-20:00 | C1.1(12:36), C4.7(13:56), M6.6(17:38) |
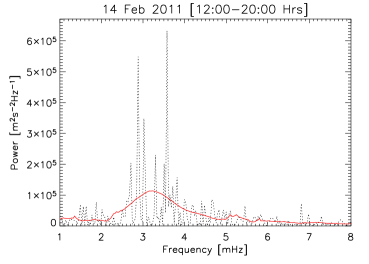
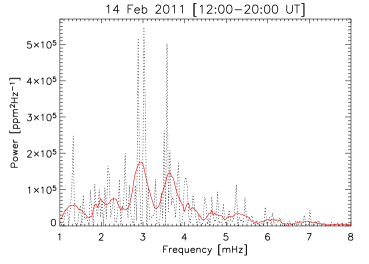
| 14 | 12:00-20:00 | C1.7(12:00), C9.4(12:53), C7.0(14:27), B7.9(16:53), M2.2(17:26), C6.6(19:30) |
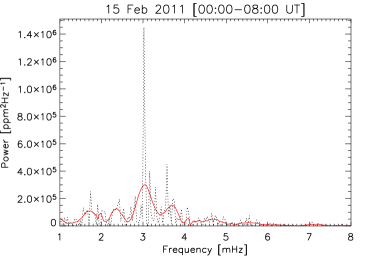
| 15 | 00:00-08:00 | C2.7(00:38), X2.2(01:56), C4.8(04:32) |
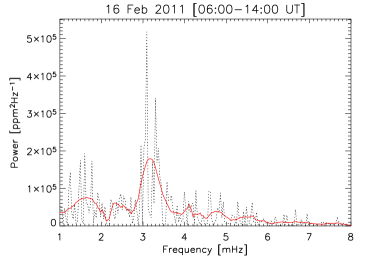
| 16 | 06:00-14:00 | C2.2(06:22), M1.1(07:44), C9.9(09:11), C3.2(10:32), C1.0(12:02) |
| 17 | 08:00-16:00 | C1.2(08:13), C1.9(09:30), C2.6(10:28), C2.2(10:44), C2.4(12:36), C1.3(15:54) |
2.1 GOLF Velocity Observations
The GOLF instrument obtains Sun-as-a-star disk-integrated line-of-sight velocity observations using the Na I D lines with a 10 s cadence. However, we have used the calibrated velocity data from GOLF (García et al., 2005) rebinned for every 60 s to match with the VIRGO/SPM observations. A high-pass filter has been applied to these data to reduce the signals from rotation and other slowly varying solar features with a cut-off established at three days. It is to be noted that we observe normal evolution of velocity oscillations in the Sun in these GOLF observations for the entire period - 11 February 2011 to 17 February 2011.
2.2 VIRGO/SPM Intensity Observations
The VIRGO/SPM instrument has basically three Sun photometers which obtain Sun-as-a-star disk-integrated intensity observations, separately, in the 5 nm spectral irradiance bands centered at 402 nm (blue), 500 nm (green), and 862 nm (red) with a 60 s cadence. We have used in our analysis the calibrated intensity data from VIRGO/SPM obtained at 862 nm because of its proximity with the GOLF observations in the Na I D lines as regards to their formation height in the solar atmosphere (Jiménez, Jiménez-Reyes, & García, 2005). These calibrated time series are first subjected to orbital corrections due to the satellite motion and then a 1-day moving mean filter with double smoothing (i.e., a triangular filter) is applied to reduce the signals from solar rotation and slow background variations. It is to be noted that time series used in this work belong to a longer time series from which the interested days have been extracted to avoid the border effects of the aforementioned filter. Finally, a two-point backward difference filter is applied to the time series to reduce the low-frequency residuals. This improves the visibility of the high-frequency peaks in the spectrum. Similar to the GOLF observations, we observe normal evolution of intensity oscillations in the Sun in these VIRGO/SPM observations for the entire period - 11 February 2011 to 17 February 2011.
3 Analysis and Results
In the following, we describe the analysis of GOLF and VIRGO/SPM observations for our investigation.
3.1 Analysis of Velocity Observations from GOLF
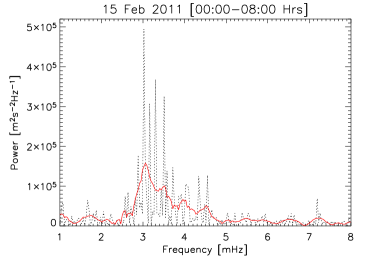
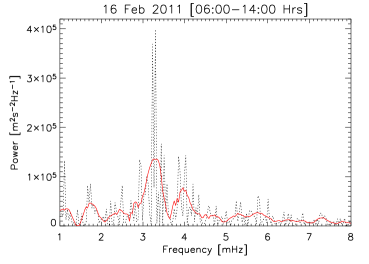
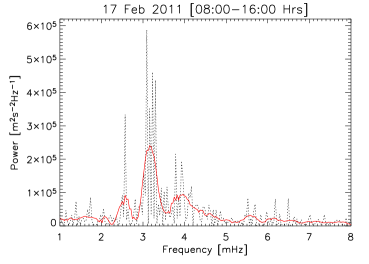
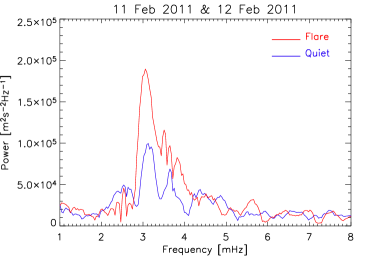
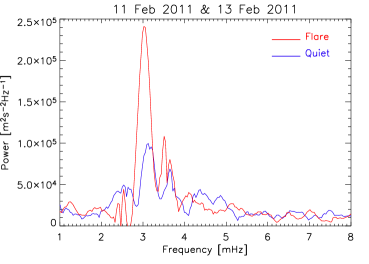
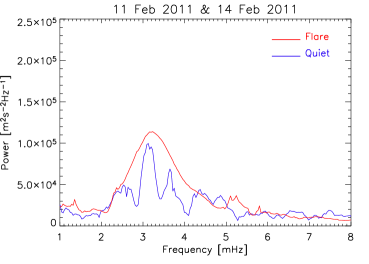
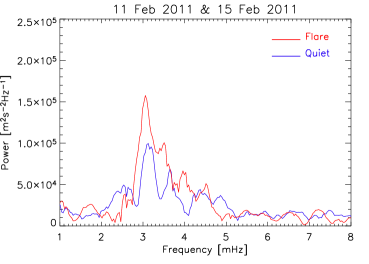
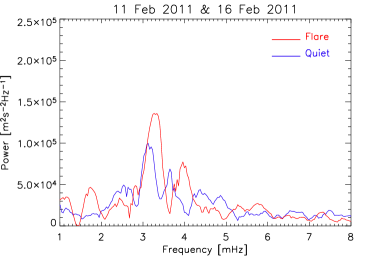
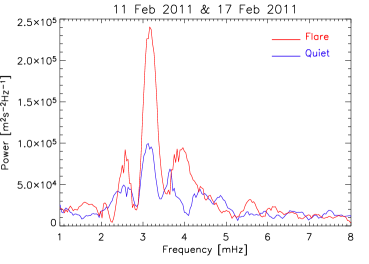
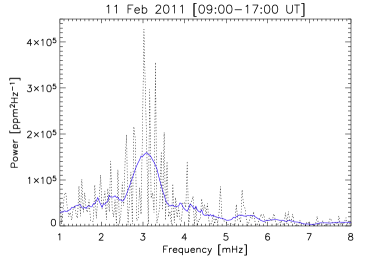
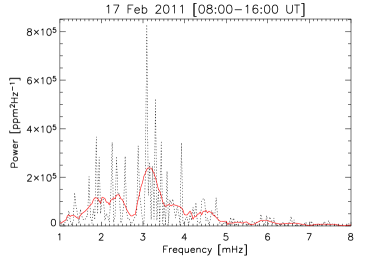
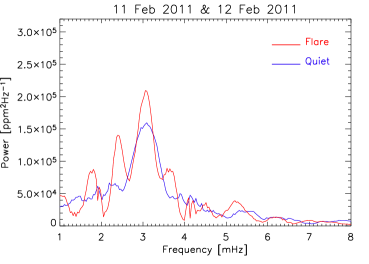
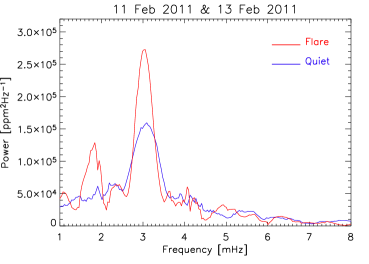
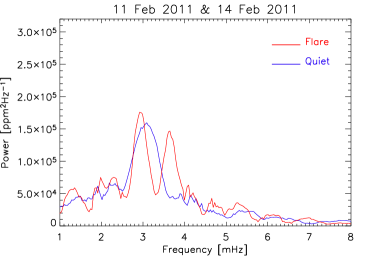
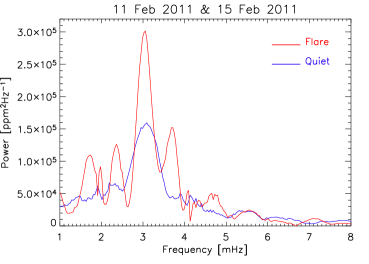
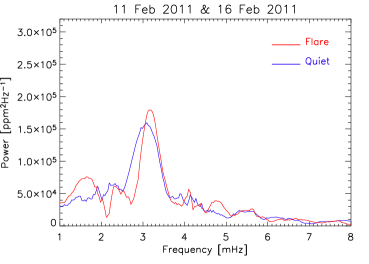
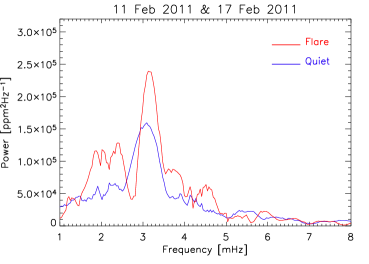
The 7-day long time series of velocity observations as obtained by the GOLF instrument is subjected to Fourier Transform to estimate the velocity power spectra for a time window of 8 hours for the different days as summarized in Table 1. In Figure 1, we show in the dashed black lines the Fourier Power Spectra obtained from these velocity oscillations. A comparison of these power spectra shows that various modes of oscillations in different frequency regimes are either getting enhanced or excited on the flare days with respect to the quiet day. We also apply a smoothing fit (Savitzky-Golay Fit; Press et al., 1992) as shown in the solid blue/red lines to these power spectra for estimating the power envelopes for the different days, which would be useful in proper comparison of the power spectra obtained for the flare days with that for the quiet day. It is to be noted that the Savitzky-Golay Fit (hereafter, S-G Fit) is a polynomial least-squares fit with weighted moving average, where weighting is given as a polynomial of an optimum degree depending on the characteristics of the data (Press et al., 1992). In Figure 2, we show the comparison of the Fourier Power Spectra for the flare days (shown in the solid red lines) with that obtained on the quiet day (shown in the solid blue lines). The comparative study of the power spectra as shown in the different panels of Figure 2 indicates that there is enhancement of the power of velocity oscillations on the flare days as compared to the quiet day.
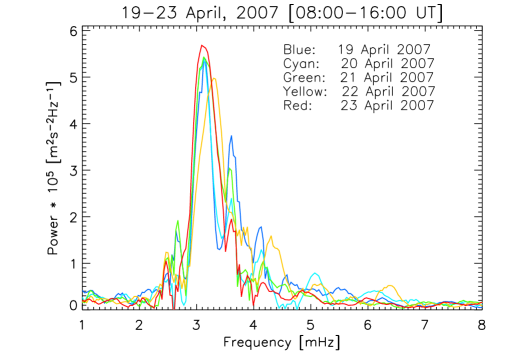
On the other hand, it is well known that stochastic processes in the solar convection zone that excite the global modes of oscillations in the Sun (Goldreich, Murray, & Kumar, 1994) could also experience changes on short time-scales thereby affecting the amplitudes of the oscillatory modes. Therefore, there could be a possibility that stochastic excitation of the global modes would have undergone a change over the period of our observations, viz., 11 February 2011 to 17 February 2011, thereby showing significant changes in the power of the oscillatory modes on the flare days as compared to the quiet day. In order to test this hypothesis, we have analyzed the disk-integrated velocity observations obtained by the GOLF instrument for 8 hours of observations (08:00-16:00 UT) everyday during the period from 19 April 2007 to 23 April 2007 during the extended solar magnetic-activity minimum (Salabert et al., 2009). This period during solar-activity minimum has no reported flares and thus can be used as another null-test period for our analysis. In Figure 3, we show the comparison of the smoothed (S-G Fit) Fourier Power Spectra obtained from the GOLF velocity observations for the aforementioned period. These power spectra do not show the extent of variations as seen in the case of flare days with respect to the quiet day (c.f., Figure 2). We further quantify the degree of relative variation in the power of global velocity oscillations over the aforementioned days during the solar minimum. It is found that the maximum relative variation in the integrated power as estimated from the non-smoothed power spectra of velocity oscillations over the days during the quiet period is about 9.85% in the 2–5 mHz band ( modes) and about 6.40% in the 5–8 mHz band (high-frequency waves), which could be related to the stochastic variations in the power spectra due to the convective processes.
A similar analysis for the relative variation of power over the flare days with respect to the quiet days is also being presented at a later stage (Section 3.3) in this paper. There, we also compare the results obtained for the flare days with these results for the solar minimum phase.
3.2 Analysis of Intensity Observations from VIRGO/SPM
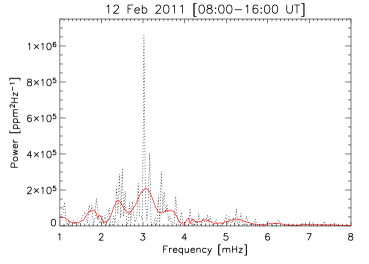
We apply the same methodology used in GOLF to the VIRGO/SPM time series for the same time period. In Figure 4, we show the Fourier Power Spectra obtained from these intensity observations. These power spectra illustrate that various modes of oscillations at different frequencies are enhanced (or, excited) on the days with flares as compared to the “null test” (quiet day). In Figure 5, we show the comparison of the Fourier Power Spectra obtained for the flare days with that obtained on the quiet day. We observe from the comparison of power spectra shown in Figure 5 that there is enhancement of the power of intensity oscillations on the flare days as compared to the quiet day.
3.3 Analysis of Variations in the Integrated Power on the Flare Days Relative to the Quiet Day
| Date | Flares | GOLF Integrated Power | Rel. Variation in Power | VIRGO Integrated Power | Rel. Variation in Power | ||||
|---|---|---|---|---|---|---|---|---|---|
| (arbitrary units ) | (%) | (arbitrary units ) | (%) | ||||||
| (2–5 mHz) | (5–8 mHz) | (2–5 mHz) | (5–8 mHz) | (2–5 mHz) | (5–8 mHz) | (2–5 mHz) | (5–8 mHz) | ||
| 11 | 0 | 3.60 | 1.06 | - | - | 51.7 | 8.31 | - | - |
| 12 | 3B, 1C | 5.26 | 1.26 | 46.11 | 18.87 | 63.70 | 9.78 | 23.21 | 17.69 |
| 13 | 2C, 1M | 4.54 | 1.21 | 26.11 | 14.15 | 63.40 | 9.57 | 22.63 | 15.16 |
| 14 | 1B, 4C, 1M | 5.25 | 1.24 | 45.83 | 16.98 | 62.43 | 9.52 | 20.75 | 14.56 |
| 15 | 2C, 1X | 4.50 | 1.20 | 25.00 | 13.20 | 81.20 | 10.07 | 57.05 | 28.76 |
| 16 | 4C, 1M | 4.30 | 1.18 | 19.44 | 11.32 | 59.22 | 9.30 | 14.50 | 11.91 |
| 17 | 6C | 5.81 | 1.30 | 61.38 | 22.64 | 78.53 | 9.96 | 52.28 | 19.86 |
Estimated stochastic variation in power: 9.85% in the 2–5 mHz band, and 6.40% in the 5–8 mHz band
It is important to analyze and quantify the degree of variations in the power of the power spectra on the flare days relative to the quiet day in the frequency regimes of modes (2–5 mHz band) and high-frequency waves (5–8 mHz band) and to study the causal relation between the strength of the flares (GOES soft X-ray peak flux) during the analyzing periods and the flare-induced enhancements seen in the power of global oscillation modes in the Sun. In Table 2, we present the analysis of integrated power obtained from the non-smoothed GOLF and VIRGO/SPM Fourier Power Spectra (c.f., Figures 1 and 3), respectively, for the period 11 February 2011 to 17 February 2011. Our analysis shows the following results:
a. In the case of GOLF observations, we find that there is a variation in the integrated power of the global oscillation modes in the range of about 19% to 61% for the -mode band and about 11% to 22% for the high-frequency band.
b. In the case of VIRGO/SPM observations, the variation in the integrated power of the global modes is in the range of about 14% to 57% for the -mode band and about 11% to 28% for the high-frequency band.
We also present a summary of GOES soft X-ray (1–8 Å band) flares during the same period for ready reference in Table 2.
The analysis of Table 2 illustrates that GOLF and VIRGO/SPM observations show minimum relative enhancement of integrated power in the -mode band ( 19% for GOLF and 14% for VIRGO) and in the high-frequency band ( 11% for both, GOLF and VIRGO) on 16 February 2011, although 4 C-class and 1 M-class flares took place on this day during the observing period. On the other hand, the day 12 February 2011 with much lower strength of flares (3 B-class and 1 C-class flares) with respect to 16 February 2011, shows about 46% and 18% relative enhancements of integrated powers in -mode band and high-frequency band, respectively, for GOLF observations and about 23% and 17% in the aforementioned two bands, respectively, for VIRGO observations. This is also illustrated in the comparison of the power envelopes of GOLF observations (c.f., Figure 2) and VIRGO observations (c.f., Figure 5). Similarly, a clear relation between the flare associated relative enhancements in the integrated power of the power spectra in the two frequency regimes (2–5 mHz band, and 5–8 mHz band) and the strength of the flares during the analyzing periods is also not seen for the other days considered in our analysis.
As it was shown in Section 3.1, the analysis of GOLF velocity observations for the period 19 April 2007 to 23 April 2007 (solar minimum with no reported flares) reveals that normal stochastic excitation variations in the power of the power spectra over the aforementioned days is about 9.85% in the -mode band and 6.4% in the high-frequency band. However, the flare associated minimum enhancements (19% in the -mode band and 11% in the high-frequency band) observed in the analysis of GOLF data on 16 February 2011 are also reasonably higher relative to the maximum variation in power seen during the solar minimum. All other flare-days during 12 February 2011 to 17 February 2011 are always showing much higher relative variation in power (for both, GOLF and VIRGO) with respect to the stochastic variations in the power spectra associated with convection.
4 Discussion and Conclusions
We have analyzed the influence of flares on the global oscillation modes in the Sun using the Sun-as-a-star velocity and intensity observations obtained by the GOLF and VIRGO/SPM instruments, respectively. The chief findings of our investigation and the interpretations of results are as follows:
i. The Fourier Power Spectrum analysis of the GOLF and VIRGO observations indicates that there is enhancement in the power of predominant modes as well as high-frequency waves in the Sun during the flares, as compared to the quiet day. In this context, it is worthy mentioning that the GOLF instrument obtains velocity observations using the Na I D lines which are formed in the upper solar photosphere, while the intensity data used in our analysis are obtained by VIRGO/SPM instrument at 862 nm, which is formed within the solar photosphere. Despite the fact that the two instruments sample different layers of the solar atmosphere using two different parameters (velocity v/s intensity), we have found that both these observations show the signatures of flare-induced global waves in the Sun. The GOLF and VIRGO/SPM observations have been used since the launch of SOHO to characterize the -mode properties. The amplitudes of solar oscillations as detected by both instruments are more than two order of magnitudes above the photon noise level even at the Nyquist frequency (in the case of GOLF, refer to Figures 13 and 14 of García et al., 2005). However, the limiting factor to measure modes is not the instrumental noise (e.g. photon noise), but solar noise composed of the sum of the convective background (mostly granulation at the -mode frequencies) and the accumulated power of the unresolved high-degree modes (see for e.g., Figures 2 and 3 of García et al., 2013). In the case of VIRGO/SPM, the Figure 3 of García et al. (2013) illustrates that the amplitudes at are about two order of magnitudes above the noise level (assuming the instrumental noise level at the Nyquist frequency). However, considering only the amplitudes from the maximum of the modes against the region between the modes is 1 order of magnitude “above the noise”. The GOLF observations have a higher signal-to-noise ratio as the solar convective background is lower in velocity than intensity.
ii. It is observed that with flares the nature and degree of enhancements in the different oscillatory modes as seen in GOLF observations (c.f., Figure 2, and Table 2) and the VIRGO/SPM observations (c.f., Figure 5, and Table 2) are different, which could be assigned to the different responses to the flares by the two different observing layers in the solar atmosphere as sampled by these two instruments. The difference in the spectra of flares could also be the contributions from the different integration times being used in GOLF and VIRGO observations and the different observing parameters (velocity v/s intensity). Toutain et al. (1997) performed a correlation analysis between the VIRGO and GOLF observations for frequencies above 1 mHz ( modes) for a 31-day long time series and found that the correlation of frequencies between the VIRGO/SPM (red channel at 862 nm) and GOLF observations is 0.344 with a shift of maximum correlation by 273.69 s, which is not connected with the mean phase shift between intensity and velocity. This low correlation is apparently a combined effect of the different observing parameters at different wavelengths with different integration times of these two instruments. Accordingly, the power spectra with flares would show different behaviour.
iii. We observe dominant peaks in the spectra of flares around 4 mHz, which are seen on all the flare days for GOLF while on most of the flare days for VIRGO observations. This flare-induced enhanced power around 4 mHz has also been seen in local helioseismic wave power with a flare as analyzed by Alvarado-Gómez et al. (2012). In general, it is also seen that there is enhanced power of oscillatory modes around 2 mHz in VIRGO observations on the flare days, which is not a commonly observed phenomenon. Hence, this indicates that flares have induced these oscillations.
iv. Our analysis shows that the flare associated changes seen in the power of the global modes of oscillations in the Sun in the -mode band and the high-frequency band on the flare days as compared to the quiet day are always higher than the stochastic variations in the power spectra due to the convective processes. Hence, this relative enhancement in the power of global waves on the flare days with respect to the quiet day is the effect of flares or the different processes accompanying the flares taking place in the solar atmosphere.
v. It is noteworthy mentioning that various modes of oscillations in different frequency regimes are either getting enhanced or excited on the flare days with respect to the quiet day and there is a general increase in the power of global modes of oscillations in the Sun during the flares. However, we do not observe an explicit relation between the strength of the flares in the soft X-ray observations taking place during the analyzing periods for the flare days and the degree of enhancements in the power of oscillatory modes in the Sun as seen in the GOLF velocity and VIRGO/SPM intensity observations, respectively (c.f., Table 2). However, there is a possibility of any flares happening on the far-side of the Sun during our analyzing periods and thereby contributing to the excitation of global waves in the Sun. Thus, our attempt to analyze the relation between the degree of enhancements seen in the power of global oscillation modes and the strength of flares as observed with GOES satellite suffers from the non-availability of flare observations on the far-side of the Sun.
vi. The aforementioned results also indicate that it is not only the flare energy that induces the global waves in the Sun, however, there are other factors influencing the power of these oscillatory modes during the flares. One of the probable scenario is that the fast global re-organization of the solar magnetic fields associated with the flares could lead to the impulsive changes in the Lorentz force vectors acting in the solar atmosphere. These impulsive changes in the Lorentz force are known to produce seismicity in the Sun (Kumar et al., 2011, 2016, and references therein) thereby contributing to the enhancement of global modes of oscillations during the flares.
vii. The studies related to flare-induced local helioseismic wave power have provided some important clues, such as, (i) Not all the flares (or major flares) are associated with local seismic emissions in the Sun, (ii) In the case of flares which have been observed to induce local helioseismic emissions, only a fraction of the total flare energy is found to be converted into the acoustic emissions, and (iii) relatively smaller flares have sometimes shown larger effects of local helioseismic emissions (for a detailed discussion on these aspects, refer to the review paper by Donea (2011)). Recently, Judge et al. (2014) showed that the energy of acoustic emissions in a sunquake was much more than the energy available from Lorentz force changes and radiative sources in an X1 flare in NOAA active region 12017 on 29 March 2014. Thus, there is also a lack of correlation between the flare-induced local helioseismic wave power and flare energies.
Altogether, these results could suffice our knowledge about the seismic responses to transient events, such as flares and the various impulsive processes accompanying the flares, taking place in the environment of the Sun. Also, it would be helpful in identifying the asteroseismic signatures of stellar flares using the knowledge gleaned from these solar results.
Acknowledgements
We acknowledge the use of data from GOLF and VIRGO/SPM instruments on board SOHO space mission. The SOHO is a joint mission of NASA and ESA under co-operative agreement. We also acknowledge the use of data from GOES-15 space mission of NASA. We are very much thankful to the referee for constructive comments and suggestions, which improved the presentation of our work in this paper. Thanks to Siddharath Sharma and Hemant Saini for doing initial projects on these observations. We are also thankful to P. Venkatakrishnan for useful discussions. BK acknowledges the support being provided by Udaipur Solar Observatory/Physical Research Laboratory and RAG acknowledges the support of CNES. SM would like to acknowledge support from NASA grants NNX15AF13G and NSF grant AST-1411685.
References
- Aschwanden (2002) Aschwanden M. J., 2002, SSRv, 101, 1
- Aschwanden et al. (2016) Aschwanden M. J., Holman G., O’Flannagain A., Caspi A., McTiernan J. M., Kontar E. P., 2016, ApJ, 832, 27
- Aschwanden et al. (2017) Aschwanden M. J., et al., 2017, ApJ, 836, 17
- Ambastha & Antia (2006) Ambastha A., Antia H. M., 2006, SoPh, 238, 219
- Alvarado-Gómez et al. (2012) Alvarado-Gómez J. D., Buitrago-Casas J. C., Martínez-Oliveros J. C., Lindsey C., Hudson H., Calvo-Mozo B., 2012, SoPh, 280, 335
- Benz (2008) Benz A. O., 2008, LRSP, 5, 1
- Benz (2017) Benz A. O., 2017, LRSP, 14, 2
- Borucki et al. (2010) Borucki W. J., et al., 2010, Sci, 327, 977
- Caspi et al. (2015) Caspi A., Shih A. Y., McTiernan J. M., Krucker S., 2015, ApJ, 811, L1
- Chaplin et al. (1995) Chaplin W. J., Elsworth Y., Howe R., Isaak G. R., McLeod C. P., Miller B. A., New R., 1995, ESASP, 376, 335
- Deubner (1974) Deubner F.-L., 1974, SoPh, 39, 31
- Domingo, Fleck, & Poland (1995) Domingo V., Fleck B., Poland A. I., 1995, SoPh, 162, 1
- Donea (2011) Donea A., 2011, SSRv, 158, 451
- Emslie et al. (2005) Emslie A. G., Dennis B. R., Holman G. D., Hudson H. S., 2005, JGRA, 110, A11103
- Foglizzo (1998) Foglizzo T., 1998, A&A, 339, 261
- Foglizzo et al. (1998) Foglizzo T., et al., 1998, A&A, 330, 341
- Frohlich et al. (1997) Frohlich C., et al., 1997, SoPh, 170, 1
- Fröhlich et al. (1995) Fröhlich C., et al., 1995, SoPh, 162, 101
- Gabriel et al. (1995) Gabriel A. H., et al., 1995, SoPh, 162, 61
- Gabriel et al. (1997) Gabriel A. H., et al., 1997, SoPh, 175, 207
- Garcia (1994) Garcia H. A., 1994, SoPh, 154, 275
- García et al. (1998) García R. A., et al., 1998, ApJ, 504, L51
- García et al. (1999) García R. A., Jefferies S. M., Toner C. G., Pallé P. L., 1999, A&A, 346, L61
- García et al. (2005) García R. A., et al., 2005, A&A, 442, 385
- García et al. (2013) García R. A., et al., 2013, JPhCS, 440, 012040
- Gavryusev & Gavryuseva (1999) Gavryusev V. G., Gavryuseva E. A., 1999, MNRAS, 303, L63
- Goldreich, Murray, & Kumar (1994) Goldreich P., Murray N., Kumar P., 1994, ApJ, 424, 466
- Hagyard et al. (1999) Hagyard M. J., Stark B. A., Venkatakrishnan P., 1999, SoPh, 184, 133
- Hudson & Ryan (1995) Hudson H., Ryan J., 1995, ARA&A, 33, 239
- Hundhausen et al. (1984) Hundhausen A. J., Sawyer C. B., House L., Illing R. M. E., Wagner W. J., 1984, JGR, 89, 2639
- Holman et al. (2011) Holman G. D., et al., 2011, SSRv, 159, 107
- Jiménez, Jiménez-Reyes, & García (2005) Jiménez A., Jiménez-Reyes S. J., García R. A., 2005, ApJ, 623, 1215
- Judge et al. (2014) Judge P. G., Kleint L., Donea A., Sainz Dalda A., Fletcher L., 2014, ApJ, 796, 85
- Karoff & Kjeldsen (2008) Karoff C., Kjeldsen H., 2008, ApJ, 678, L73
- Karoff (2014) Karoff C., 2014, ApJ, 781, L22
- Kleint (2017) Kleint L., 2017, ApJ, 834, 26
- Kosovichev & Zharkova (1998) Kosovichev A. G., Zharkova V. V., 1998, Natur, 393, 317
- Kumar et al. (2010) Kumar B., Mathur S., García R. A., Venkatakrishnan P., 2010, ApJ, 711, L12
- Kumar et al. (2011) Kumar B., Venkatakrishnan P., Mathur S., Tiwari S. K., García R. A., 2011, ApJ, 743, 29
- Kumar et al. (2016) Kumar B., Raja Bayanna A., Venkatakrishnan P., Kuchandy Mathew S., 2016, RAA, 16, 129
- Lara, Gopalswamy, & DeForest (2000) Lara A., Gopalswamy N., DeForest C., 2000, GeoRL, 27, 1435
- Leighton, Noyes, & Simon (1962) Leighton R. B., Noyes R. W., Simon G. W., 1962, ApJ, 135, 474
- Leibacher & Stein (1971) Leibacher J. W., Stein R. F., 1971, ApL, 7, 191
- Lin (2006) Lin R. P., 2006, SSRv, 124, 233
- Metcalf, Leka, & Mickey (2005) Metcalf T. R., Leka K. D., Mickey D. L., 2005, ApJ, 623, L53
- Miller et al. (1997) Miller J. A., et al., 1997, JGR, 102, 14631
- Moreton (1960) Moreton G. E., 1960, AJ, 65, 494
- Petrie & Sudol (2010) Petrie G. J. D., Sudol J. J., 2010, ApJ, 724, 1218
- Press et al. (1992) Press W. H., Teukolsky S. A., Vetterling W. T., Flannery B. P., 1992, nrfa.book, Numerical Recipes in Fortran, Cambridge: University Press, |c1992, 2nd ed.
- Richardson, Hill, & Stassun (2012) Richardson M., Hill F., Stassun K. G., 2012, SoPh, 281, 21
- Saint-Hilaire & Benz (2005) Saint-Hilaire P., Benz A. O., 2005, A&A, 435, 743
- Salabert et al. (2009) Salabert D., García R. A., Pallé P. L., Jiménez-Reyes S. J., 2009, A&A, 504, L1
- Scherrer et al. (1995) Scherrer P. H., et al., 1995, SoPh, 162, 129
- Srivastava et al. (2000) Srivastava N., Schwenn R., Inhester B., Martin S. F., Hanaoka Y., 2000, ApJ, 534, 468
- Sudol & Harvey (2005) Sudol J. J., Harvey J. W., 2005, ApJ, 635, 647
- Toutain et al. (1997) Toutain T., et al., 1997, SoPh, 175, 311
- Ulrich (1970) Ulrich R. K., 1970, ApJ, 162, 993
- Walker (1988) Walker A. B. C., Jr., 1988, SoPh, 118, 209
- Wang et al. (1994) Wang H., Ewell M. W., Jr., Zirin H., Ai G., 1994, ApJ, 424, 436
- Wang & Liu (2010) Wang H., Liu C., 2010, ApJ, 716, L195
- Wang & Liu (2015) Wang H., Liu C., 2015, RAA, 15, 145-174
- Wang et al. (2017) Wang H., et al., 2017, NatAs, 1, 0085
- Webb & Cliver (1995) Webb D. F., Cliver E. W., 1995, JGR, 100, 5853
- Wolff (1972) Wolff C. L., 1972, ApJ, 176, 833