Spectroscopic perspective on the interplay between electronic and magnetic properties of magnetically doped topological insulators
Abstract
We combine low energy muon spin rotation (LE-SR) and soft-X-ray angle-resolved photoemission spectroscopy (SX-ARPES) to study the magnetic and electronic properties of magnetically doped topological insulators, (Bi,Sb)2Te3. We find that one achieves a full magnetic volume fraction in samples of (V/Cr)x(Bi,Sb)2-xTe3 at doping levels . The observed magnetic transition is not sharp in temperature indicating a gradual magnetic ordering. We find that the evolution of magnetic ordering is consistent with formation of ferromagnetic islands which increase in number and/or volume with decreasing temperature. Resonant ARPES at the V edge reveals a nondispersing impurity band close to the Fermi level as well as V weight integrated into the host band structure. Calculations within the coherent potential approximation of the V contribution to the spectral function confirm that this impurity band is caused by V in substitutional sites. The implications of our results on the observation of the quantum anomalous Hall effect at mK temperatures are discussed.
I Introduction
A topological insulator (TI) is a bulk insulator exhibiting an inverted band structure Qi and Zhang (2011). This, together with time reversal symmetry (TRS), leads to the presence of a spin polarized Dirac cone in the surface states which is topologically protected against small, TRS invariant perturbations. However, TRS breaking in this system, e.g. by introducing long range ferromagnetism, opens an energy gap at the Dirac point. Such a gapped TI has been proposed to exhibit various new quantum states of matter including the quantum anomalous Hall (QAH) effect Qi et al. (2006); Yu et al. (2010), charge induced magnetic mirror monopoles Qi et al. (2009) and Majorana excitations when in proximity to an s-wave superconductor Qi (2010).
Recently the QAH effect has been experimentally observed in Cr and V doped (Bi,Sb)2Te3 Chang et al. (2013a); Chang et al. (2015). This has been possible only at ultra low temperature (tens of mK), which was attributed to the presence of bulk valence bands at the binding energy of the Dirac point Li et al. (2016). In addition it has been pointed out that increasing the homogeneity of the ferromagnetic order might be crucial to elevate the temperature at which the QAH effect can be observed Feng et al. (2016). Understanding the origin of the magnetism and the resulting splitting of the topological surface states in magnetically doped TIs is a prerequisite to tuning and controlling it. Nevertheless, this issue remains under intense discussion, particularly due to the lack of suitable methods to directly probe the magnetic properties of thin films and determine the nature of magnetism in these systems Vergniory et al. (2014); Li et al. (2015); Grauer et al. (2015); Lachman et al. (2015); Ye et al. (2015).
Theoretically, it was predicted that exchange coupling between the magnetic dopants and the Dirac electrons supports a strong out-of-plane single ion anisotropy Yu et al. (2010); Henk et al. (2012a, b); Núñez and Fernández-Rossier (2012). In contrast, in Cr doped Sb2Te3 it was found that the magnetism at the surface is oriented in plane, which does not allow for the opening of a gap Yang et al. (2013). Moreover, in Mn doped Bi2Se3 the doping induced gap in the surface state was shown to be independent of the magnetism in the sample Sánchez-Barriga et al. (2016).
In order to realize the QAH effect it is essential that the Fermi level () is located within the exchange gap of the topological surface states. In principle, this excludes any type of free carrier (at ) mediated coupling between the dopants at low temperature. Instead, it has been proposed that the band inversion in a TI leads to an unusually high spin susceptibility of the parent compound which allows mediating a ferromagnetic coupling between the dopants (so called van-Vleck ferromagnetism) Yu et al. (2010). Indeed, a temperature dependent shift of the V and edges has been measured with electron energy loss spectroscopy and was attributed to a van-Vleck contribution of the V core levels to the ferromagnetism Li et al. (2015).
More recently, transport and scanning nanoSQUID measurements have shown that the magnetism in magnetically doped TIs may be attributed to superparamagnetic-like behavior Grauer et al. (2015); Lachman et al. (2015). In addition, a high V density of states near has been found using resonant (angular integrated) photoemission spectroscopy (AIPES) at the V edge and scanning tunneling spectroscopy Peixoto et al. (2016); Sessi et al. (2016). This is in agreement with theoretically predicted nonzero V partial density of states (V-DOS) at . Larson and Lambrecht (2008); Yu et al. (2010)
Several of the above effects potentially hinder the observation of the QAH effect at higher temperature Li et al. (2016); Feng et al. (2016); Sánchez-Barriga et al. (2016); Grauer et al. (2015); Lachman et al. (2015); Peixoto et al. (2016); Sessi et al. (2016) and a deeper understanding of the interplay between the electronic and magnetic degrees of freedom in these materials is necessary in order to increase this temperature.
Here we investigate the local magnetic and electronic properties of thin films of V and Cr doped (Bi,Sb)2Te3 using low energy muon spin rotation (LE-SR) and soft X-ray angle resolved photoemission spectroscopy (ARPES). We show that the ferromagnetic transition is gradual and strongly depends on the doping level. The evolution of the magnetic ordering is consistent with magnetic clusters formed at the transition temperature within a predominantly paramagnetic sample. The volume fraction of these clusters increases gradually with decreasing temperature. Our results show that samples of Vx(Bi,Sb)2-xTe3 with doping levels become fully magnetic, while at lower doping part of the sample does not exhibit magnetic ordering. By using resonant soft X-ray ARPES at the V edge we confirm the presence of a non-dispersing V impurity band at as well as spectral weight of V integrated in the host band structure at lower binding energies (). We show that the former is reproduced by density functional theory (DFT) in the coherent potential approximation (CPA) assuming substitutional V. In contrast, if the V is placed in the van-der-Waals (vdW) gap, no such impuritiy band is formed. The obtained LE-SR and ARPES results are used to understand the correlation between the electronic and magnetic properties of the magnetically doped TIs.
II Experiment
Films of magnetically doped (Bi,Sb)2Te3 were grown using molecular beam epitaxy on sapphire (0001) substrates. The magnetic dopants were introduced via coevaporation as described in Refs. [Zhang et al., 2011; Chang et al., 2013b] to produce magnetic Mx(Bi1-ySby)2-xTe3, where M is either V or Cr. Hereafter we refer to the composition of the magnetic TI layer by Mx. The samples investigated by SR or ARPES were 20 or 10 quintuple layers (QL) thick, respectively. Before taking the samples out of the growth chamber they were capped with a or thick Te protective layer Hoefer et al. (2015). A list of all the studied samples with relevant details is given in Table 1. Note that similarly prepared films exhibit the QAH effect Chang et al. (2013a); Chang et al. (2015).
| Label | Cap | Topological insulator | Technique | |
|---|---|---|---|---|
| 5nm Te | 20 QL | Sb2Te3 | LE-SR | |
| V0.13 | 5nm Te | 20 QL | V0.13Sb1.87Te3 | LE-SR |
| Cr0.2 | 5nm Te | 20 QL | Cr0.2Sb1.8Te3 | LE-SR |
| V0.08 | 3nm Te | 20 QL | V0.08(Bi0.32Sb0.68)1.92Te3 | LE-SR |
| V0.16 | 3nm Te | 20 QL | V0.16(Bi0.32Sb0.68)1.84Te3 | LE-SR |
| V0.19 | 3nm Te | 20 QL | V0.19(Bi0.33Sb0.67)1.81Te3 | LE-SR |
| V0.23 | 3nm Te | 20 QL | V0.23(Bi0.32Sb0.68)1.77Te3 | LE-SR |
| 3nm Te | 10 QL | (Bi0.31Sb0.79)2Te3 | SXARPES | |
| V0.06 | 3nm Te | 10 QL | V0.06(Bi0.33Sb0.67)1.94Te3 | SXARPES |
| V0.12 | 3nm Te | 10 QL | V0.12(Bi0.33Sb0.67)1.88Te3 | SXARPES |
LE-SR experiments were performed at the E4 beam line of the Paul Scherrer Institute Prokscha et al. (2008). The samples were glued using silver paint onto Ni-coated sample plates and mounted on the cold finger of a helium flow cryostat. In these experiments, fully spin polarized muons with initial polarization chosen to be parallel to the surface of the sample, were implanted at a tunable energy in the range of , corresponding to mean implantation depths of . This is a key feature which makes LE-SR suited for studying thin film samples. In contrast, the implantation depth of surface muons (conventional SR) or muons from decay channels (measurements under high pressure) is on the order of several hundreds m to cm, respectively Khasanov et al. (2008); Yaouanc and de Réotier (2011), and therefore cannot be used to investigate thin samples.
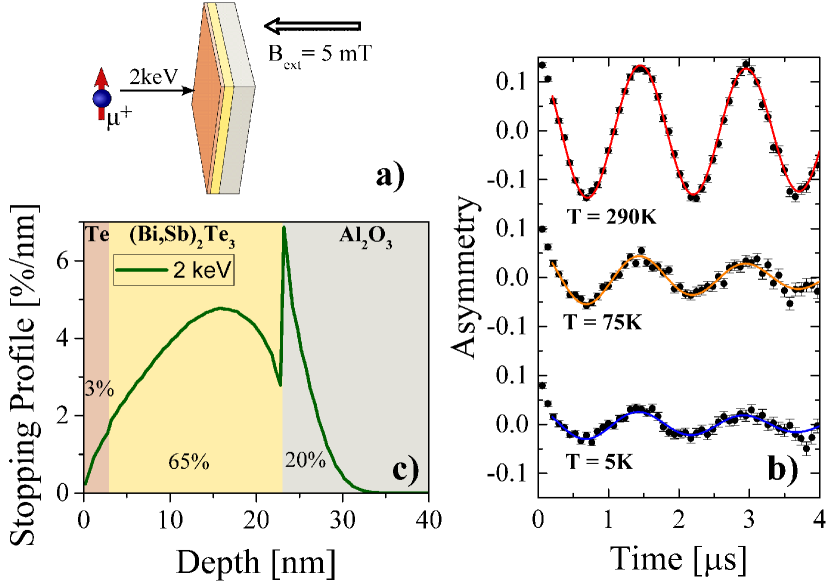
The implanted muon decays (lifetime ) by emitting a positron preferentially along the muon spin direction. Therefore, the time evolution of the ensemble average of the muon spin polarization can be reconstructed by measuring the spatial distribution of emitted positrons using four detectors around the sample Yaouanc and de Réotier (2011). The asymmetry in positron counts between opposite detectors, , is propotional to the muon spin polarization along this direction, and reflects the temporal and spatial distribution of the magnetic fields at the muon stopping site. Weak transverse field SR (wTF-SR) measurements as a function of temperature have been performed by field cooling in an applied field of perpendicular to the surface of the sample and the initial muon spin polarization. The schematic experimental setup is shown in Figure 1a.
Soft X-ray ARPES measurements were conducted at the ADRESS beam line of the Swiss Light Source at the Paul Scherrer Institute Strocov et al. (2010) using circularly polarized photons in the energy range of with a total energy resolution ranging from to . At energies corresponding to resonant photoemission at the V edge the combined beamline and analyzer resolution was . The experimental geometry provides a grazing incidence of the X-rays on the sampe as described in Ref. [Strocov et al., 2014]. The measurements were carried out at to quench the thermal effects reducing the coherent -resolved spectral component at high photoelectron energies Braun et al. (2013). During the experiment the pressure was kept below . In order to correct the angular dependence of the analyser transmission, all spectra have been normalized to the diffuse intensity measured above . X-ray absorption spectroscopy (XAS) measurements were also performed on the same beamline by measuring the total electron yield (TEY) via the sample drain current normalized by the incoming photon intensity.
For the ARPES measurements, the Te capping was first partially removed by sputtering the sample in Ar at for . The remaining cap layer was evaporated by quickly heating the sample up to where it was kept for . Then it was cooled down to where it was kept for to prevent readsorption of the evaporated Te, before cooling it to cryogenic temperatures and performing the ARPES measurements. During this process, the temperature of the samples was monitored using an optical pyrometer and the pressure in the preparation chamber was kept below .
III Results
III.1 Low energy muon spin rotation
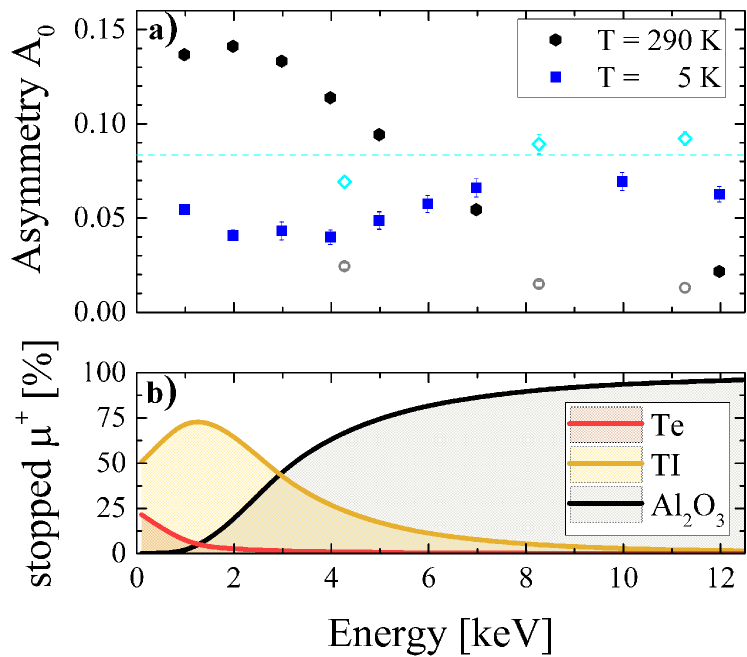
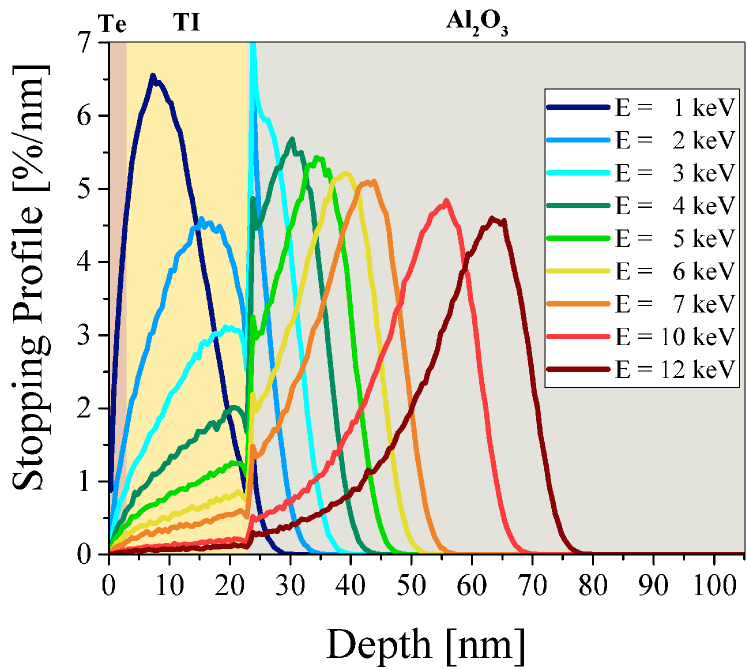
Representative wTF-SR asymmetry spectra, measured at implantation energy and different temperatures are presented in Fig. 1b. At high temperatures an almost undamped, large amplitude precession signal was observed. In contrast, a much smaller amplitude with a larger damping rate was measured at low temperatures, where a considerable part of the asymmetry decayed at very early times. At the implantation energy used in these measurements, most of the muons stop inside the TI layer, while less than stop inside the Te capping and less than in the sapphire substrate. Figure 1c shows the simulated stopping distribution profiles of the muons at the corresponding implantation energy, which was calculated using the TRIM.SP Monte-Carlo code Morenzoni et al. (2002). Measurements as a function of implantation energy confirmed the validity of this simulation, see Figure 1 in the supporting information (SI) SI .
In a transverse field measurement where the applied field is much larger than the internal static fields sensed by the muons, one expects to measure an asymmetry oscillating at the Larmor frequency, , where is the muon gyromagnetic ratio. However, when the internal static field is much larger than the applied field, as is typically the case below a magnetic transition, the oscillating asymmetry becomes heavily damped. Due to the finite temporal resolution of the SR technique this can lead to an effective loss of initial asymmetry. Therefore, muons stopping in a magnetically ordered part of the sample or in the nickel sample holder Saadaoui et al. (2012) experience a larger static magnetic field and appear as a missing fraction in the asymmetry spectra. On the other hand, muons stopping in a paramagnetic region of the sample will precess at . Hence, considering only the oscillating signal after allows to estimate the paramagnetic volume fraction of the sample, while the missing asymmetry at early times corresponds to the magnetic volume fraction.
Following this logic, we used the Musrfit software Suter and Wojek (2012) to fit the measured SR spectra between and to an exponentially damped oscillating function,
| (1) |
where is the extrapolated initial amplitude of the oscillating asymmetry at , is the mean field at the muons’ stopping sites and is the damping rate, which corresponds primarily to the width of the static local field distribution. The phase, , is determined by the initial muon spin direction and the geometry of the detectors. The temperature dependence of (normalized to its value in the paramagnetic phase at 290 K), and obtained from the fits of all studied samples are shown in Figure 2.
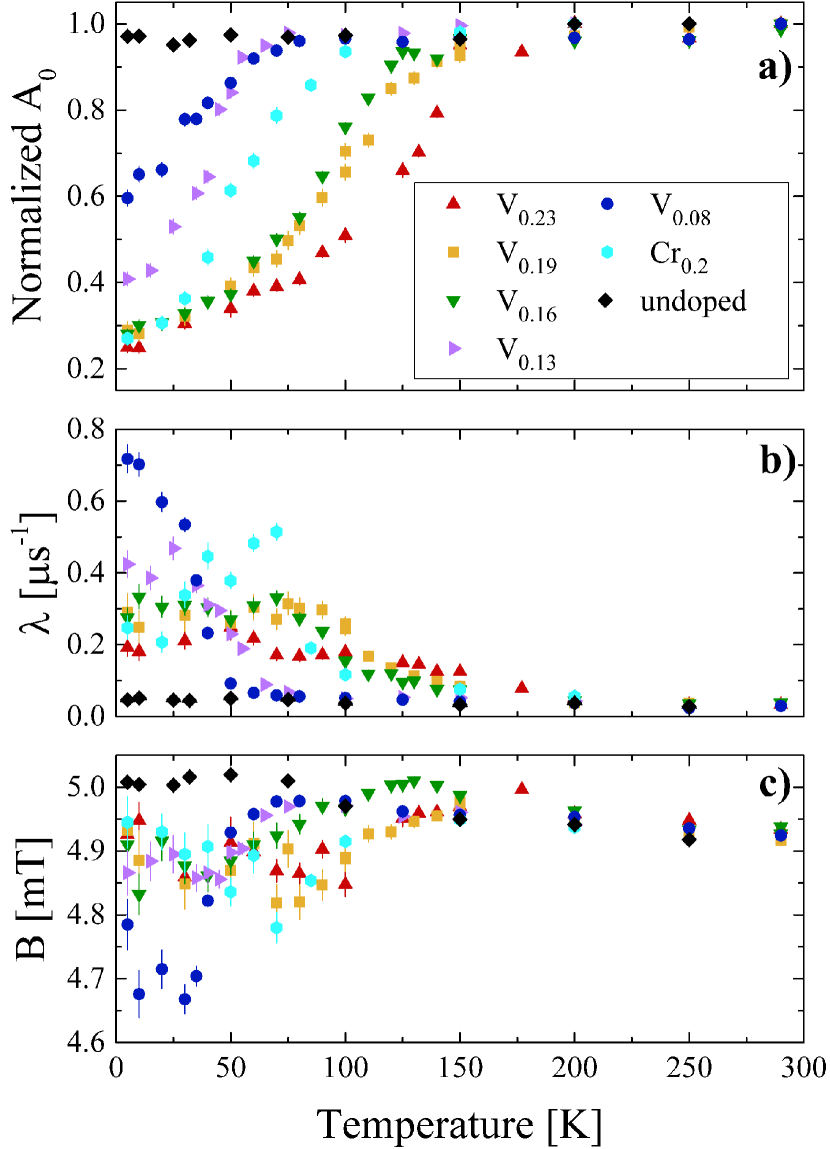
Note that the undoped sample exhibits an almost temperature independent and , as expected for a non-magnetic sample. In contrast, we observe a drop in upon cooling the doped samples, which we associate with the appearance of strong static fields in portions of the sample. This drop can be attributed to a magnetic ordering at a transition temperature . Clearly, and the relative size of drop in depends strongly on the dopant and doping level in the sample. We also note that the drop in is accompanied by an increase in and a decrease in .
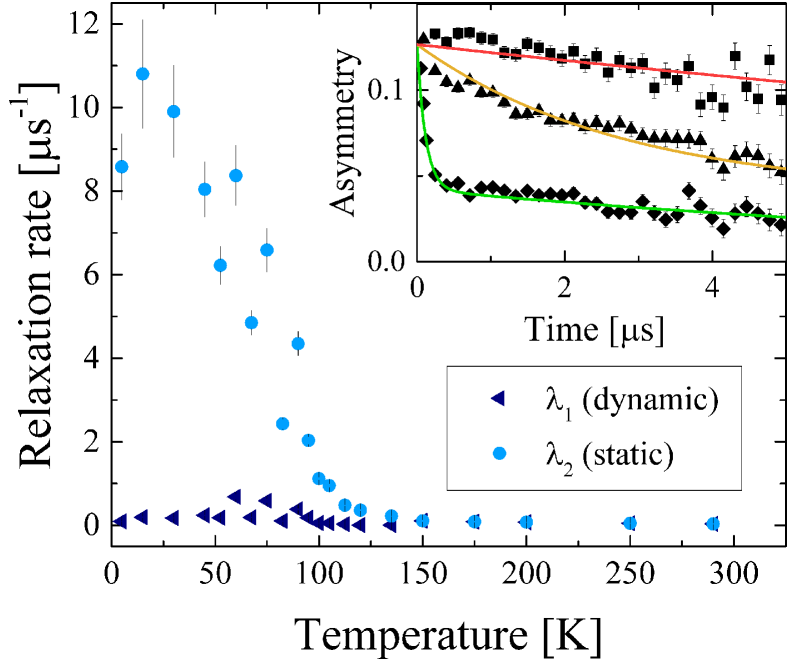
For comparison, measurements in zero field (ZF) on the V0.19 sample are shown in Figure 3. At high temperature, the asymmetry follows an exponential-like behavior with a damping rate wich increases sharply below . We also note a change of the relaxation from a single exponential-like behavior to a bi-exponential relaxation below , as is typical for systems undergoing magnetic ordering Yaouanc and de Réotier (2011). Therefore, we fit the data to the sum of a two exponentials,
| (2) |
This simplified model assumes that below the magnetic transition the implanted muons experience a Lorentzian distribution of randomly oriented static fields with an additional small and fluctuating component. In this case, an ensemble average of one third of the initial muon spin polarization is aligned parallel to the randomly oriented static local field, while two thirds are perpendicular to it. The 1/3 component can relax only due to fluctuations in the magnetic field, and hence is referred to as a dynamic component. On the other hand, the damping of the 2/3 components is due to incoherent precession and depolarization which is determined by the width of the static field distribution and is referred to as a static component Yaouanc and de Réotier (2011). Note that the direction of the local field at the muon stopping position strongly depends on the relative (random) location of the nearest dopant atom. Therefore, the random orientation of the local dipolar field does not necessarily imply randomly oriented magnetic moments.
Despite ignoring the presumably different contributions from various layers of the sample and substrate, the ZF measurements fit very well to Eq. (2), confirming the observed magnetic ordering from TF measurements and allowing a qualitative understanding of the behavior of the sample. In particular it shows that the damping rates above are equal and almost temperature independent, reflecting the dynamic nature of the muon spin relaxation. Below we observe a strong increase of the depolarization of component which is associated with the appearance of static magnetic fields in the sample due to the magnetic ordering.
III.2 Soft X-ray ARPES
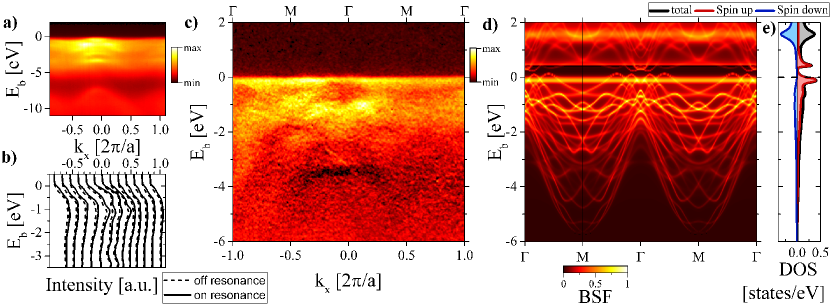
The experimental band structure of the V0.06 sample measured at photon energy is shown in Figure 4. The constant cuts as a function of the coordinates (Figure 4b) exhibit a point-like feature at , which can be associated with the topological surface state, and the hexagonally symmetric, flower-shaped bulk valence band below. This is similar to what is seen in ultra-violet ARPES, cf. [Li et al., 2016]. We note that the dispersions are less sharp than in ultra-violet ARPES measurements on similar samples Chen et al. (2009); Li et al. (2016). This worsens with increasing , cf. the measurement at in Figure 8a. We attribute this effect to the doping induced distortions of the crystal lattice, which can be considered as “frozen phonons” affecting the coherent ARPES intensity similarly to the thermal effects which occur at high photon energies Braun et al. (2013).
In Figure 4c, the measurement as a function of reveals that the surface state exhibits intensity modulations without dispersing as a function of . To compensate for the effect of the decrease in the photoemission cross section with increasing in Figure 4c, each measurement was normalized to the total AIPES intensity outside the point, within around .

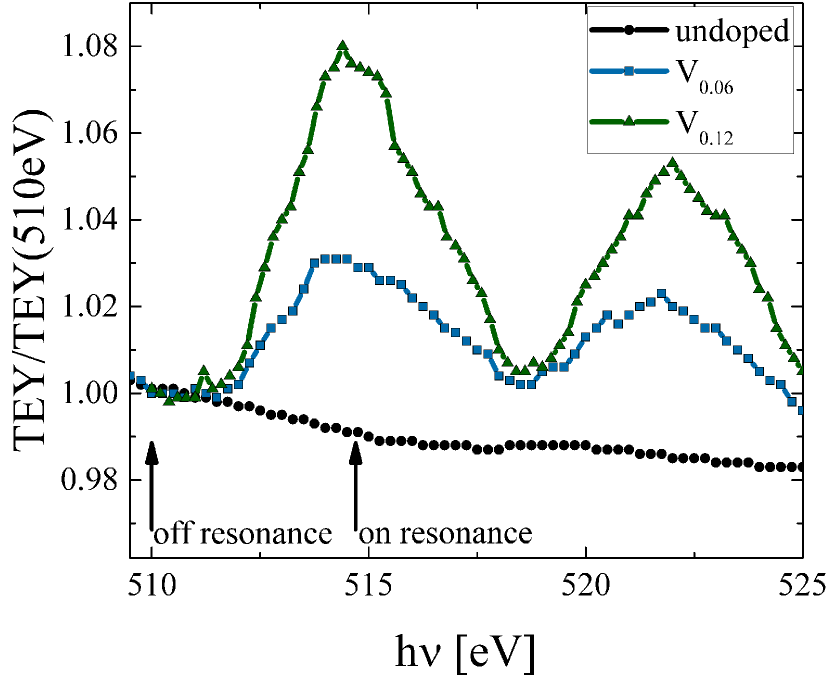
Figure 5 shows the XAS across the V and edges. The deviation from the theoretical branching ratio of 2:1 and satellites to the peaks have been reported previously in similar samples and were attributed to final state effects ([Peixoto et al., 2016] and references therein). The peak positions are consistent with the literature values, however the peak-width is larger than what is usually observed in these samples Peixoto et al. (2016); Sessi et al. (2016). As we will discuss later, this could be caused by different chemical environments of the V atoms.
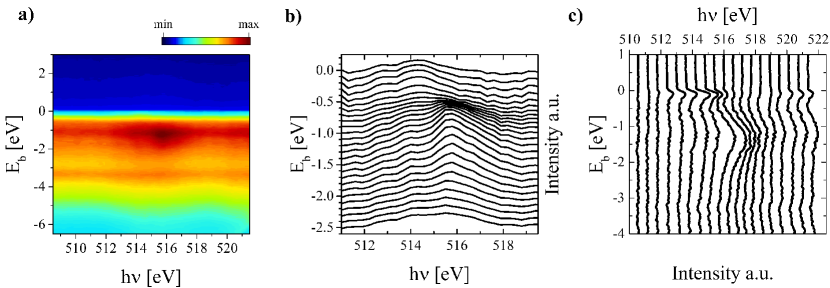
In Figure 6 we plot the raw AIPES intensity of the V0.06 sample as a function of and where the latter is scanned across the V edge. The spectra were integrated along the -M direction. There is a clear intensity increase at the V -resonance around , at . A careful analysis of constant -cuts, shown in Figure 6b, reveals that at there is another resonance close to . Note that there is no intensity drop at low like it is sometimes observed for Fano resonances. The two resonances can be distinguished more clearly by looking at the energy distribution curves (EDC) in Figure 6c from which the off-resonance contribution measured at has been subtracted.
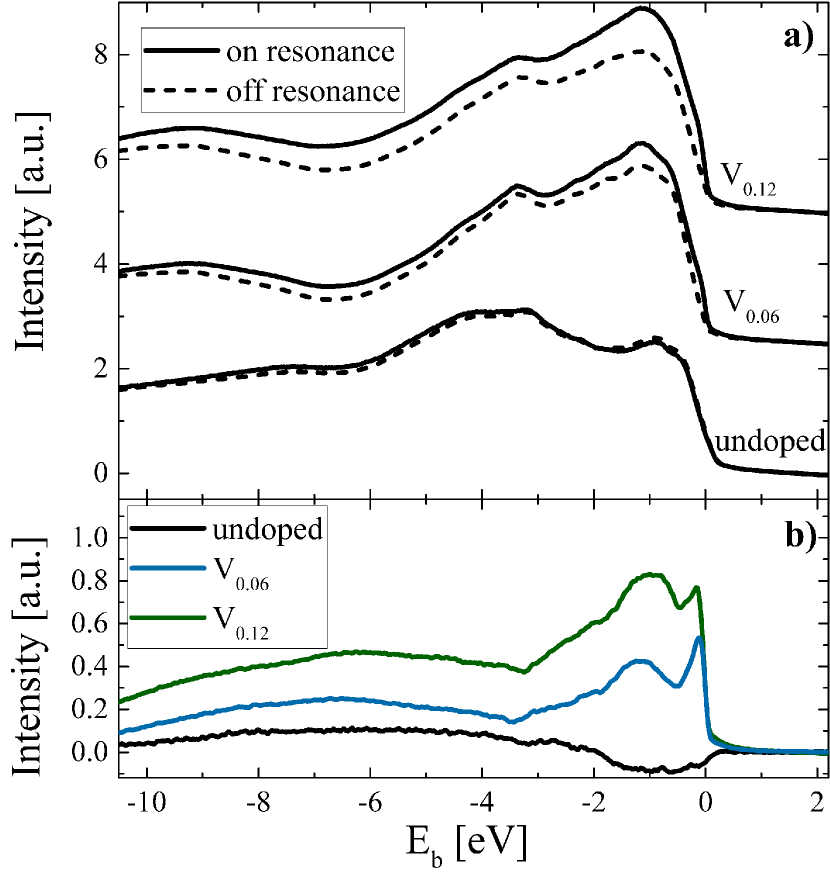
Resonant ARPES measurements have been performed by tuning the photon energy to the V peak measured in XAS () as indicated in Figure 5. Off resonance reference measurements were performed at . The corresponding AIPES at different doping levels are compared in Figure 7. Although the spectral shape of the undoped sample might have been affected by its incomplete decapping, it does not show any resonance at the V edge neither in XAS nor in resonant AIPES. The difference of the AIPES measured on and off resonance, which reflects the V-DOS Molodtsov et al. (1997); Kobayashi et al. (2014), is shown in Figure 7b. In the doped samples the two peaks are located at similar , suggesting that the behavior observed in Figure 6 is independent of the doping level. Note that we can not resolve a shift of the DOS on the order of at different doping levels due to a change in host carrier density that has been previously reported in Cr-doped (Bi,Sb)2Te3 Ye et al. (2015).
The EDCs measured on and off resonance (corresponding to the AIPES in Figure 7a) on the V0.06 sample are shown in Figure 8b. Subtracting them gives the angle resolved difference plot in Figure 8c. It is important to point out that the resonant contribution close to forms a non-dispersive impurity band, whereas the one around seems to be dispersive and hybridized with the host band structure. We also note that the behavior of the V0.12 sample is similar, but more smeared due to the larger disorder.
III.3 Theory
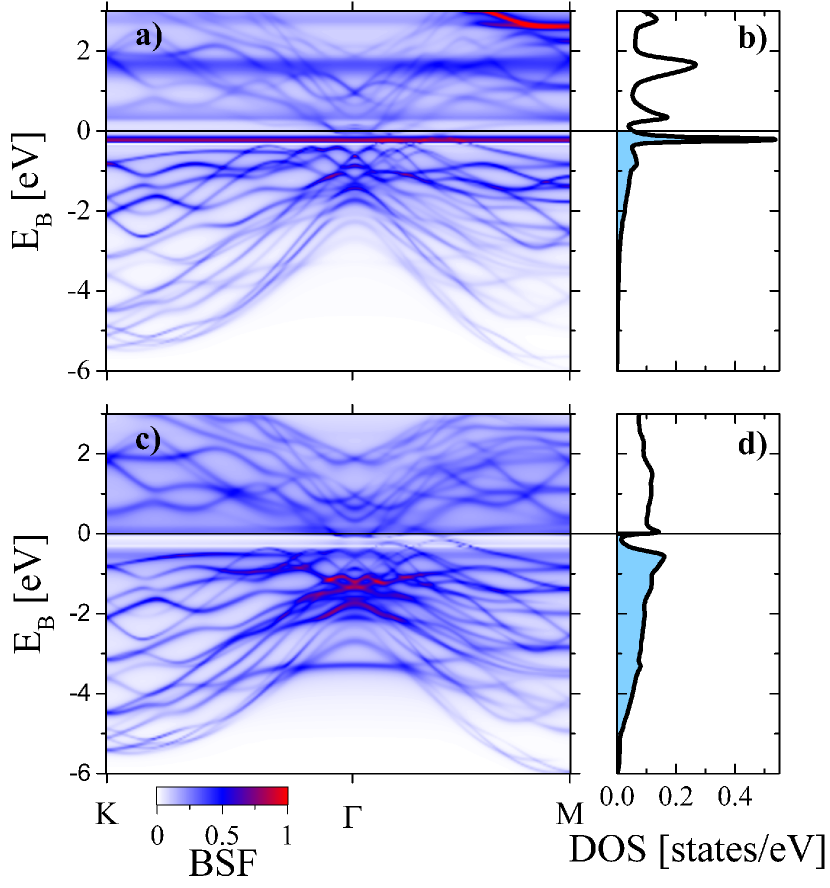
Electronic structure calculations were performed by employing density functional theory within the generalized gradient approximation.Perdew and Wang (1992) We used a full potenital relativistic spin-polarized Green function method,Geilhufe et al. (2015) in which disorder effects were treated within the coherent potential approach (CPA).Gyorffy (1972) The angular momentum cutoff was set to . We have used 32 Gaussian quadrature points to carry out a complex energy contour integration, while for the integration over the irreducible Brillouin zone we used a 303030 points mesh. The experimental lattice constants and atomic coordinates of (Bi,Sb)2Te3 were adopted for the calculations.Stasova and Abrikosov (1970) According to the available experimental data,Dyck et al. (2002, 2003, 2005); Kulbachinskii et al. (2005); Choi et al. (2004); Zhou et al. (2006); Hor et al. (2010); Song et al. (2012); West et al. (2012); Kou et al. (2012); Schlenk et al. (2013); Yee et al. (2015); Polyakov et al. (2015); Liu et al. (2015) 3 transition metal impurities in tetradymite-like chalcogenides substitute typically cation atoms (Bi and Sb). However, STM studies also reveal van der Waals positions Song et al. (2012); Yee et al. (2015) of Fe atoms in the bulk Bi2Se3. Based on these data, we considered that V may occupy the substitutional position in the (Bi,Sb)-sublattice and the octahedral interstitial site in the vdW gap.
To extract the V contribution to the Bloch spectral function (BSF), we calculated the Fourier transformed site and angular momentum projected Green function including non-site-diagonal terms within a coherent potential approximation. In this approach a direct extraction of the V contribution is not possible because of the non-site-diagonal terms. However, since in these systems only V atoms have electrons, the Bloch spectral function projected into the angular momentum channel can be associated with the V contribution to the BSF. The result for V0.06(Bi0.33Sb0.67)1.94Te3 considering only V in substitutional positions is shown in Figure 8d. A second calculation including aditional V in the vdW gap of V0.06+0.03(Bi0.33Sb0.67)1.94Te3 is shown in Figure 9.
IV Discussion
IV.1 Muon spin rotation
The strong increase of the static ZF relaxation rate below confirms the magnetic origin of the features we observe in wTF-SR measurements below the same temperature. The magnetic moments of the dopant atoms, which give only a small, motionally narrowed relaxation rate above the transition, slow down with decreasing temperature and produce a broad, static field distribution below . In the ZF measurements, a small increase of the dynamic relaxation is also observed below the transition, probably due to the slowing down of magnetic field fluctuations from the dopant moments. We also point out that the rate of the static depolarization at low temperature decreases with increasing doping level (not shown). This indicates a broader field distribution in the lower doping samples (as expected) and is generally consistent with the corresponding decrease in the wTF depolarization rates (Figure 2b).
The onset of the magnetic transition at , which coincides with the drop in , increases with doping level. We also note that the transition temperature is generally higher for the V doped samples than for the Cr doped sample, even at lower doping levels. This is in agreement with the ferromagnetism that is commonly observed in these materials Dyck et al. (2002, 2005); Kulbachinskii et al. (2005); Zhou et al. (2006); Chang et al. (2013a); Chang et al. (2015); Ye et al. (2015). As mentioned earlier, the gradual decrease of the wTF initial asymmetry below indicates the gradual formation of ferromagnetic regions, in an otherwise paramagnetic sample. At , ferromagnetism is established in small islands which increase in number and/or size as the temperature is decreased. One important aspect of the results in Figure 2 is the fact that in the samples with dopant concentrations the initial asymmetry seems to decrease to the same value at the lowest temperature, . Given the similar geometry of the measured samples, this is a clear indication that at this temperature the TI layer is fully magnetic and that the remaining asymmetry is due to muons stopping in the Te capping layer, the sapphire substrate or background contribution from muons landing outside the sample. From these measurements we can evaluate the magnetic volume fraction of the doped TI layer by considering the contribution of muons stopping in each layer to the measured asymmetry, normalized by the full asymmetry above . Here we assume that muons landing in the non-magnetic Te capping maintain their full polarization, while those stopping in the Ni backing depolarize immediately and do not contribute to the measured asymmetry. Furthermore we assume (based on measurements on the bare substrate) that muons in sapphire maintain only of their polarization due to Muonium formation. The full details of these estimates and the reference measurements are given in the SI SI . The resulting volume fraction as a function of temperature is shown in Figure 10.
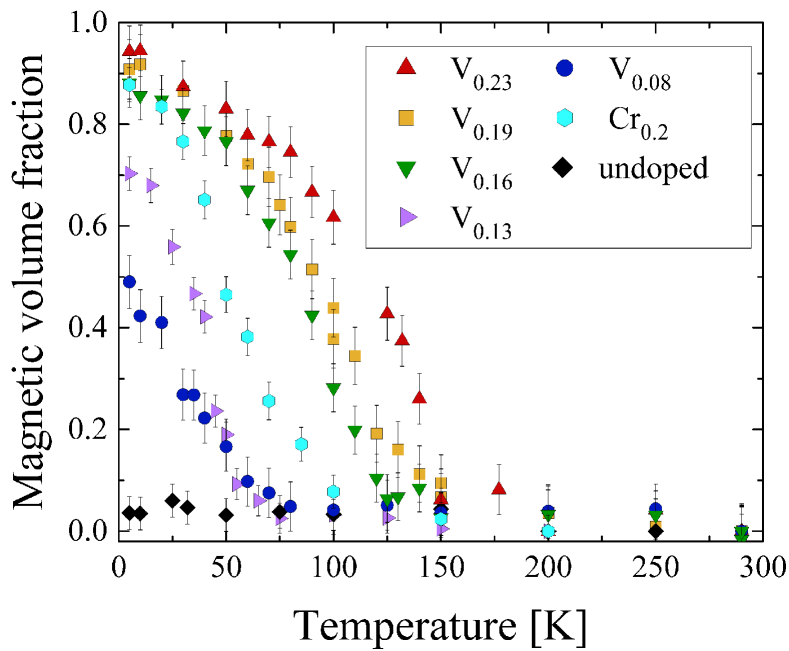
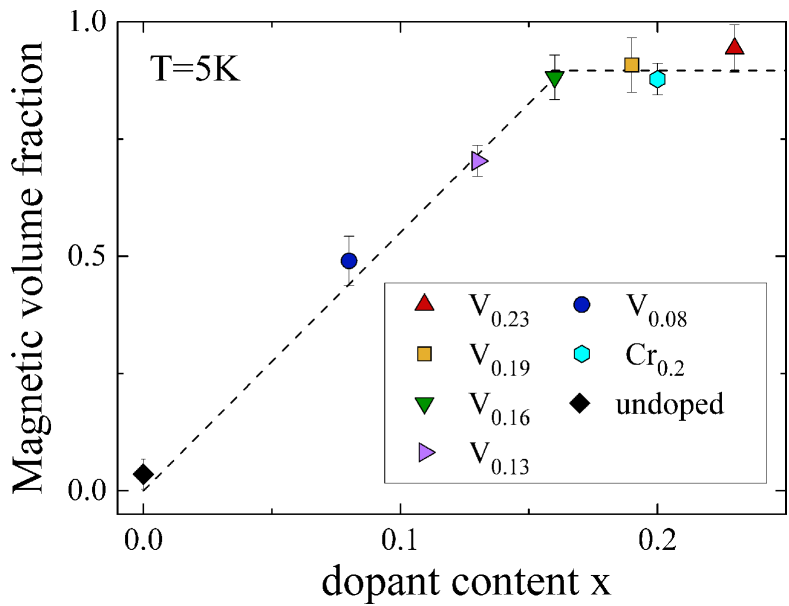
These results clearly show that the volume fraction at low temperature increases with increasing doping level saturating at a doping of , as shown in Figure 11. Note that this saturation value of the magnetic volume fraction is consistent with a full volume fraction considering the systematic uncertainty in estimating the probability of muonium formation in the sapphire substrate (see full details in the SI SI ). The samples with V doping levels of and do not reach a full magnetic volume fraction at the lowest measured temperature (), even when extrapolated to . This is one of the important aspects of our results, since such samples, seemingly with only partial magnetic volume fraction, have been shown to exhibit the QAH at very low (mK) temperature Chang et al. (2015); Grauer et al. (2015). Remember, the QAH effect can occur only if the topological surface states are gapped, e.g. by a static magnetic field perpendicular to the surface of the sample. A possible explaination for the source of this static field throughout the sample may be drawn from our measurements. The negative shift of (Figure 2c) implies that even in the paramagnetic regions of the sample there is on average a net static field perpendicular to the surface. At low enough temperatures these fields may be sufficient to open the required gap in the surface states which is necessary for the observation of the QAH effect.
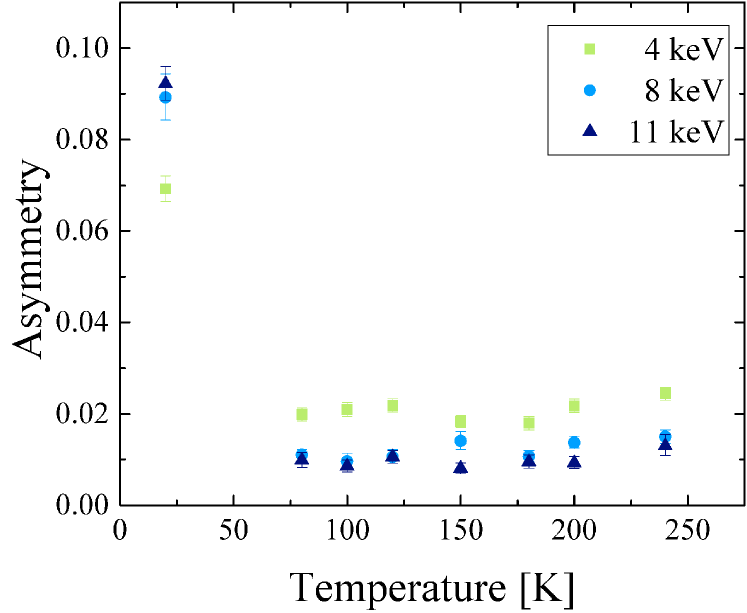
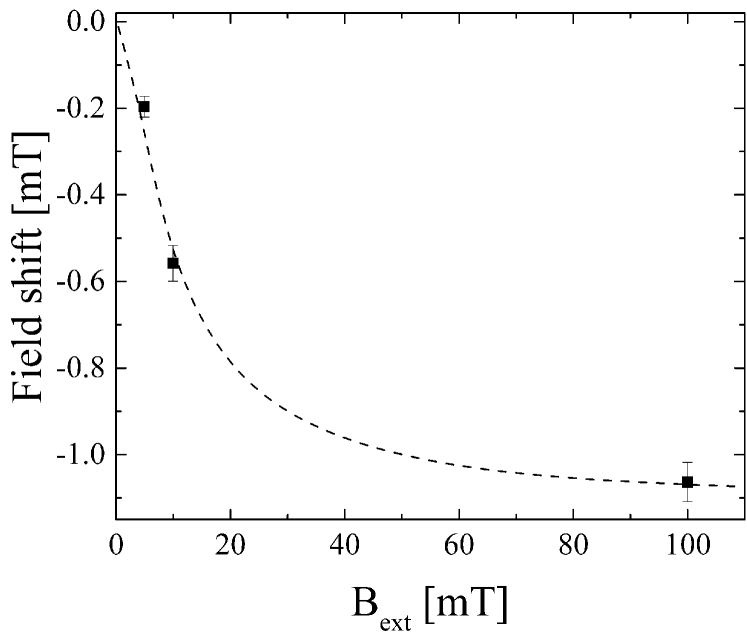
The drop in is consistent with both, partial volume ferromagnetism and superparamagnetism as has been reported on similar samples Lachman et al. (2015); Grauer et al. (2015). However, clues concerning the nature of the magnetic ordering in these systems can be obtained from a careful inspection of the temperature and field dependence of (Figure 2c). In the undoped Sb2Te3 we observe an increase of with decreasing temperature, up to of its value at room temperature (RT). The exact source of this shift is unknown, but it is most probably of hyperfine origin. A similar shift in is observed above in the magnetically doped samples. However, below we detect a negative shift in , which reaches of the RT value. This surprising effect is most pronounced in the lowest doping sample. Such large (and negative) field shifts have been reported in other materials, e.g. in the diluted magnetic semiconductor Cd1-xMnxTe Golnik et al. (1986); Ansaldo et al. (1988) and in MnSi S. Hayano et al. (1980); Lancaster et al. (2016). These were attributed to a large hyperfine interaction of the muon with the screening electrons, which results in a shift proportional to the applied field Yaouanc and de Réotier (2011); Golnik et al. (1986); Ansaldo et al. (1988); S. Hayano et al. (1980); Lancaster et al. (2016). However, in the V0.08 sample we detect a shift which is not proportional to the applied field (Figure 2 in the SI SI ). In addition field coled and zero field cooled measurements yield significantly different shifts (Figure 3 in the SI SI ). These observations exclude a shift due to hyperfine interaction and support a scenario where the shift is due to dipolar fields from ferromagnetic islands acting as superparamagnets.
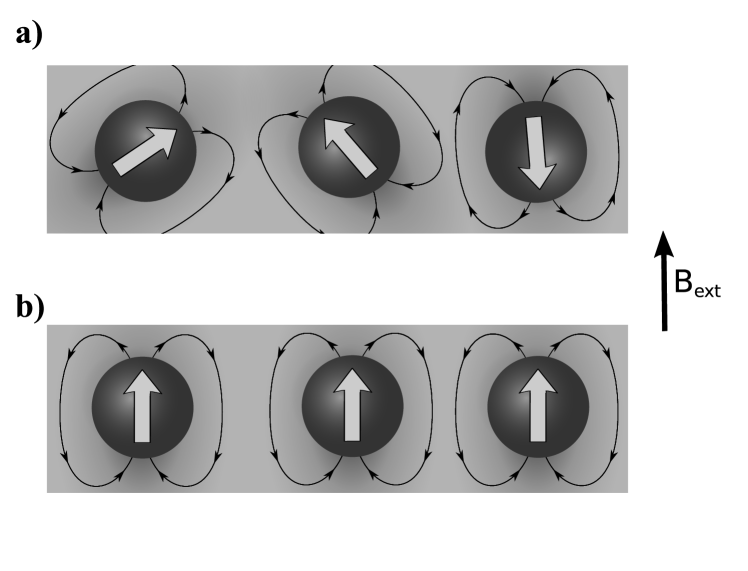
To understand this effect it is important to note that the measured precessing signal, and thereby the observed field shift, originate from parts of the sample which are not magnetically ordered. The ferromagnetic islands in the sample produce a dipolar field in these paramagnetic regions. If we assume that the magnetic moment of the islands are randomly oriented, then their dipolar contributions average to zero (sketched in Figure 12a). In such a case we would expect only an increase in the width of field distribution sensed by the muons. Therefore, the shift in the magnetic field below provides a strong evidence that the ferromagnetic domains align with the applied field, producing an average dipolar field in the opposite direction in the paramagnetic regions (Figure 12b). This is consitent with the reduction of the field shift upon zero-field cooling. Furthermore, it agrees with the superparamagnetism, i.e. weakly coupled magnetically ordered clusters embedded in a paramagnetic matrix, that has been reported in Refs. [Lachman et al., 2015; Grauer et al., 2015]. Both of these experiments were performed at temperatures below on samples with dopant concentrations of or of V or Cr, respectively. Based on our results, these samples are not expected to be fully magnetic. As the field shift and the paramagnetic volume fraction decreases with increasing doping level, it may be possible to suppress this superparamagnetic behavior by increasing the doping level of the samples.
IV.2 ARPES and Theory
We observe two peaks in the difference between resonant and off resonant AIPES. The one close to is in agreement with Ref. [Peixoto et al., 2016], while the second one has not been reported before. The additional increase of intensity at below (Figure 7b) has previously been attributed to a contribution of a direct Auger decay Peixoto et al. (2016). Here it is less pronounced than in Ref. [Peixoto et al., 2016], possibly due to the lower dopant concentration in our sample. The different values of the two resonances in the AIPES scan (Figure 6) point to the presence of two chemically different V species in the sample. This interpretation is consistent with the broader XAS peak that we observed.
The calculations show that there is a peak in the V-DOS of substitutional V around , independent of the presence of additional V in the vdW gap (Figures 8e and 9b). Therefore, we attribute the first peak at in resonant AIPES to substitutional V. In addition, this peak corresponds to a non-dispersing impurity band in the resonant ARPES measurement, which is also reproduced by the calculation for substitutional V but absent for V in the vdW gap, cf. Figure 9c, confirming our conclusion regarding its origin.
In contrast, the second resonance at higher and lower binding energy does not agree with the peaks in our calculations of the V-DOS. The difference spectra in Figure 8c features a general intensity increase around and some additional dispersing features around at the same binding energy. The latter seem to be hybridized with the host band structure and are likely to be caused by V in the vdW-gap as they agree with the calculated -resolved BSF in Figure 9c. The origin of the former is unclear, but we suspect it to be from V that segregated to the surface of the sample or oxidized during the sample preparation. In particular, some V oxides are expected to exhibit V derived states at this binding energy Zimmermann et al. (1998).
IV.3 Magnetic coupling mechanism
Both calculations and resonant ARPES measurements reveal a finite V-DOS at and therefore also at corresponding to the Dirac point, which is expected to be slightly below Zhang et al. (2011); Li et al. (2016). Bulk states at this binding energy are expected to destroy any quantized transport signatures, as they open additional conduction channels alongside the QAH states at the surface He et al. (2014); Li et al. (2016). However, they may be essential to mediate the magnetic coupling at higher temperatures. Carrier free magnetism has been proposed to either occur via van-Vleck ferromagnetism or ferromagnetic superexchange Yu et al. (2010); Peixoto et al. (2016). The latter is usually short ranged and requires a high enough dopant concentration to produce long-range order. The site percolation thresholds have been calculated to be in a triangular stack lattice and for a honeycomb lattice van der Marck (1997). These values are much higher than the magnetic dopant concentration in our samples, where we find a full volume fraction already at substitution of (Bi,Sb). This implies that a ferromagnetic superexchange alone is not sufficient to explain the long range magnetic coupling. Note that this does not exclude the presence of superexchange to trigger nucleation but requires other longer range interactions for the whole sample to become ferromagnetic.
The gradual evolution of the magnetic ordering which we see with SR is another clear indication that there is a broad range of magnetic interactions involved. This hints at a scenario where charge carrier mediated interactions dominate. It would also agree with the finite V-DOS that we observe at and with the magnetic moments on the Sb and Te sites that have been reported by X-ray magnetic circular dichroism Ye et al. (2015). In addition, DFT calculations on Bi2Te3 and Sb2Te3 predict the coupling to be caused mainly by RKKY interactions within the (Bi,Sb) layer and a double exchange via Te between adjacent layers Vergniory et al. (2014). Both of these mechanisms rely upon charge carriers at Sato et al. (2010). Together these findings favor a scenario where the magnetic interactions are carrier mediated, thus giving a possible explanation, for the observation of the QAH effect only at dilution refrigerator temperatures. It is likely that at these low temperatures other effects (like disorder induced localization of the impurity band together with gating) allow to fully gap the system without affecting the ferromagnetism in the sample.
V Conclusion
Our SR measurements on low doping samples indicate a partial volume fraction of magnetic regions embedded in a paramagnetic environment. They exhibit no long-range magnetic order even at temperatures down to . For higher doped samples () we show that the samples become fully magnetic at low temperatures. Our findings are consistent with a scenario where weakly coupled ferromagnetic islands behave as superparamagnetic clusters which can be aligned with fields as low as . Using resonant SX-ARPES we detect a non-dispersing impurity band close to which is doping level independent. By comparing it with calculations for two different V sites (V substituting Bi/Sb and in the vdW gap) we find that this impurity band originates from substitutional V. In addition, the calculations for both sites and the resonant ARPES measurements exhibit a finite V-DOS at . This implies that the magnetic coupling at high temperature is predominantly carrier mediated. Along with the partial magnetic volume fraction, the additional conduction channels introduced by the impurity band could be another factor limiting the observation of the QAH effect at elevated temperature.
In this study, we combine for the first time both LE-SR and SX-ARPES to investigate the same system. These two unique experimental techniques offer a complementary understanding of the electronic and magnetic state of the studied materials. This method of investigation is generally applicable to any magnetically doped system, including but not limited to dilute magnetic semiconductors, transition metal oxides, spin glasses, etc. and presents a powerful tool to tune and optimize such materials. Furthermore this approach can be extended to magnetic heterostructure and buried interfaces, given that the top layer is thin enough () in order to allow the escape of the SX-ARPES photoelectrons.
Acknowledgments
We thank Joel Mesot for fruitful discussions, support and valuable suggestions. We are also grateful to Juraj Krempasky for his advice on sample preparation for the ARPES measurements. The work at PSI was supported by the Swiss National Science Foundation (SNF-Grant No. 200021_165910). We acknowledge support from DFG through priority program SPP1666 (Topological Insulators), University of the Basque Country (Grant Nos. GIC07IT36607 and IT-756-13), Spanish Ministry of Science and Innovation (Grant Nos. FIS2013-48286-C02-02-P, FIS2013-48286-C02-01-P, and FIS2016-75862-P) and Tomsk State University competitiveness improvement programme (Project No. 8.1.01.2017). Partial support by the Saint Petersburg State University project No. 15.61.202.2015 is also acknowledged. At MIT, C.Z.C. and J.S.M. acknowledge support from the STC Center for Integrated Quantum Materials under NSF grant DMR-1231319 as well as grants NSF (DMR-1207469, DMR-1700137), ONR (N00014-13-1-0301 and N00014-16-1-2657). C.Z.C also acknowledges the support from the startup grant provided by Penn State University.
References
- Qi and Zhang (2011) X.-L. Qi and S.-C. Zhang, Reviews of Modern Physics 83, 1057 (2011).
- Qi et al. (2006) X.-L. Qi, Y.-S. Wu, and S.-C. Zhang, Physical Review B 74, 085308 (2006).
- Yu et al. (2010) R. Yu, W. Zhang, H.-J. Zhang, S.-C. Zhang, X. Dai, and Z. Fang, Science 329, 61 (2010).
- Qi et al. (2009) X.-L. Qi, R. Li, J. Zang, and S.-C. Zhang, Science 323, 1184 (2009).
- Qi (2010) X.-L. Qi, T. L. Hughes, S.-C. Zhang, Physical Review B 82 184516 (2010).
- Chang et al. (2013a) C.-Z. Chang, J. Zhang, X. Feng, J. Shen, Z. Zhang, M. Guo, K. Li, Y. Ou, P. Wei, L.-L. Wang, et al., Science 340, 167 (2013a).
- Chang et al. (2015) C.-Z. Chang, W. Zhao, D. Y. Kim, H. Zhang, B. A. Assaf, D. Heiman, S.-C. Zhang, C. Liu, M. H. W. Chan, and J. S. Moodera, Nature Materials 14, 473 (2015).
- Li et al. (2016) W. Li, M. Claassen, C.-Z. Chang, B. Moritz, T. Jia, C. Zhang, S. Rebec, J. J. Lee, M. Hashimoto, D.-H. Lu, et al., Scientific Reports 6, 32732 (2016).
- Feng et al. (2016) X. Feng, Y. Feng, J. Wang, Y. Ou, Z. Hao, C. Liu, Z. Zhang, L. Zhang, C. Lin, J. Liao, et al., Advanced Materials 28, 6386 (2016).
- Vergniory et al. (2014) M. G. Vergniory, M. M. Otrokov, D. Thonig, M. Hoffmann, I. V. Maznichenko, M. Geilhufe, X. Zubizarreta, S. Ostanin, A. Marmodoro, J. Henk, et al., Physical Review B 89, 165202 (2014).
- Li et al. (2015) M. Li, C.-Z. Chang, L. Wu, J. Tao, W. Zhao, M. H. W. Chan, J. S. Moodera, J. Li, and Y. Zhu, Physical Review Letters 114, 146802 (2015).
- Grauer et al. (2015) S. Grauer, S. Schreyeck, M. Winnerlein, K. Brunner, C. Gould, and L. W. Molenkamp, Physical Review B 92, 201304 (2015).
- Lachman et al. (2015) E. O. Lachman, A. F. Young, A. Richardella, J. Cuppens, H. R. Naren, Y. Anahory, A. Y. Meltzer, A. Kandala, S. Kempinger, Y. Myasoedov, et al., Science Advances 1, e1500740 (2015).
- Ye et al. (2015) M. Ye, W. Li, S. Zhu, Y. Takeda, Y. Saitoh, J. Wang, H. Pan, M. Nurmamat, K. Sumida, F. Ji, et al., Nature Communications 6, 8913 (2015).
- Henk et al. (2012a) J. Henk, M. Flieger, I. V. Maznichenko, I. Mertig, A. Ernst, S. V. Eremeev, and E. V. Chulkov, Physical Review Letters 109, 076801 (2012a).
- Henk et al. (2012b) J. Henk, A. Ernst, S. V. Eremeev, E. V. Chulkov, I. V. Maznichenko, and I. Mertig, Physical Review Letters 108, 206801 (2012b).
- Núñez and Fernández-Rossier (2012) A. S. Núñez and J. Fernández-Rossier, Solid State Communications 152, 403 (2012).
- Yang et al. (2013) F. Yang, Y. R. Song, H. Li, K. F. Zhang, X. Yao, C. Liu, D. Qian, C. L. Gao, and J.-F. Jia, Physical Review Letters 111, 176802 (2013).
- Sánchez-Barriga et al. (2016) J. Sánchez-Barriga, A. Varykhalov, G. Springholz, H. Steiner, R. Kirchschlager, G. Bauer, O. Caha, E. Schierle, E. Weschke, A. A. Ünal, et al., Nature Communications 7, 10559 (2016).
- Peixoto et al. (2016) T. R. F. Peixoto, H. Bentmann, S. Schreyeck, M. Winnerlein, C. Seibel, H. Maaß, M. Al-Baidhani, K. Treiber, S. Schatz, S. Grauer, et al., Physical Review B 94, 195140 (2016).
- Sessi et al. (2016) P. Sessi, R. R. Biswas, T. Bathon, O. Storz, S. Wilfert, A. Barla, K. A. Kokh, O. E. Tereshchenko, K. Fauth, M. Bode, et al., Nature Communications 7, 12027 (2016).
- Larson and Lambrecht (2008) P. Larson and W. R. L. Lambrecht, Physical Review B 78, 195207 (2008).
- Zhang et al. (2011) J. Zhang, C.-Z. Chang, Z. Zhang, J. Wen, X. Feng, K. Li, M. Liu, K. He, L. Wang, X. Chen, et al., Nature Communications 2, 574 (2011).
- Chang et al. (2013b) C.-Z. Chang, J. Zhang, M. Liu, Z. Zhang, X. Feng, K. Li, L.-L. Wang, X. Chen, X. Dai, Z. Fang, et al., Advanced Materials 25, 1065 (2013b).
- Hoefer et al. (2015) K. Hoefer, C. Becker, S. Wirth, and L. H. Tjeng, AIP Advances 5, 097139 (2015).
- Prokscha et al. (2008) T. Prokscha, E. Morenzoni, K. Deiters, F. Foroughi, D. George, R. Kobler, A. Suter, and V. Vrankovic, Nucl. Instrum. Methods Phys. Res., Sect. A 595, 317 (2008).
- Khasanov et al. (2008) R. Khasanov, Z. Guguchia, A. Maisuradze, D. Andreica, M. Elender, A. Raselli, Z. Shermadini, T. Goko, F. Knecht, E. Morenzoni, and A. Amato, High Pressure Research 36, 140 (2016).
- Yaouanc and de Réotier (2011) A. Yaouanc and P. de Réotier, Muon Spin Rotation, Relaxation, and Resonance: Applications to Condensed Matter, International Series of Monographs on Physics (OUP Oxford, 2011), ISBN 978-0-19-959647-8.
- Strocov et al. (2010) V. N. Strocov, T. Schmitt, U. Flechsig, T. Schmidt, A. Imhof, Q. Chen, J. Raabe, R. Betemps, D. Zimoch, J. Krempasky, et al., Journal of Synchrotron Radiation 17, 631 (2010).
- Strocov et al. (2014) V. N. Strocov, X. Wang, M. Shi, M. Kobayashi, J. Krempasky, C. Hess, T. Schmitt, and L. Patthey, Journal of Synchrotron Radiation 21, 32 (2014).
- Braun et al. (2013) J. Braun, J. Minár, S. Mankovsky, V. N. Strocov, N. B. Brookes, L. Plucinski, C. M. Schneider, C. S. Fadley, and H. Ebert, Physical Review B 88, 205409 (2013).
- Morenzoni et al. (2002) E. Morenzoni, H. Glückler, T. Prokscha, R. Khasanov, H. Luetkens, M. Birke, E. M. Forgan, C. Niedermayer, and M. Pleines, Nuclear Instruments and Methods in Physics Research Section B: Beam Interactions with Materials and Atoms 192, 254 (2002).
- (33) See Supplemental Material at [URL will be inserted by publisher].
- Saadaoui et al. (2012) H. Saadaoui, Z. Salman, T. Prokscha, A. Suter, B. M. Wojek, and E. Morenzoni, Physics Procedia 30, 164 (2012).
- Suter and Wojek (2012) A. Suter and B. M. Wojek, Physics Procedia 30, 69 (2012).
- Chen et al. (2009) Y. L. Chen, J. G. Analytis, J.-H. Chu, Z. K. Liu, S.-K. Mo, X. L. Qi, H. J. Zhang, D. H. Lu, X. Dai, Z. Fang, et al., Science 325, 178 (2009).
- Molodtsov et al. (1997) S. L. Molodtsov, M. Richter, S. Danzenbächer, S. Wieling, L. Steinbeck, and C. Laubschat, Physical Review Letters 78, 142 (1997).
- Kobayashi et al. (2014) M. Kobayashi, I. Muneta, Y. Takeda, Y. Harada, A. Fujimori, J. Krempaský, T. Schmitt, S. Ohya, M. Tanaka, M. Oshima, et al., Physical Review B 89, 205204 (2014).
- Perdew and Wang (1992) J. P. Perdew and Y. Wang, Phys. Rev. B 45, 13244 (1992).
- Geilhufe et al. (2015) M. Geilhufe, S. Achilles, M. A. Köbis, M. Arnold, I. Mertig, W. Hergert, and A. Ernst, Journal of Physics: Condensed Matter 27, 435202 (2015).
- Gyorffy (1972) B. L. Gyorffy, Physical Review B 5, 2382 (1972).
- Stasova and Abrikosov (1970) M. M. Stasova and N. K. Abrikosov, Neorganicheskie Materialy 6, 1090 (1970).
- Dyck et al. (2002) J. S. Dyck, P. Hájek, P. Lošt’ák, and C. Uher, Physical Review B 65, 115212 (2002).
- Dyck et al. (2003) J. S. Dyck, P. Svanda, P. Lošt’ák, J. Horak, W. Chen, and C. Uher, Journal of Applied Physics 94, 7631 (2003).
- Dyck et al. (2005) J. S. Dyck, C. Drašar, P. Lošt’ák, and C. Uher, Phys. Rev. B 71, 115214 (2005).
- Kulbachinskii et al. (2005) V. A. Kulbachinskii, P. M. Tarasov, and E. Brück, Physica B: Condensed Matter 368, 32 (2005).
- Choi et al. (2004) J. Choi, S. Choi, J. Choi, Y. Park, H.-M. Park, H.-W. Lee, B.-C. Woo, and S. Cho, Phys. Stat. Sol. (b) 241, 1541 (2004).
- Zhou et al. (2006) Z. Zhou, Y.-J. Chien, and C. Uher, Phys. Rev. B 74, 224418 (2006).
- Hor et al. (2010) Y. S. Hor, P. Roushan, H. Beidenkopf, J. Seo, D. Qu, J. G. Checkelsky, L. A. Wray, D. Hsieh, Y. Xia, S.-Y. Xu, et al., Phys. Rev. B 81, 195203 (2010).
- Song et al. (2012) C.-L. Song, Y.-P. Jiang, Y.-L. Wang, Z. Li, L. Wang, K. He, X. Chen, X.-C. Ma, and Q.-K. Xue, Phys. Rev. B 86, 045441 (2012).
- West et al. (2012) D. West, Y. Y. Sun, S. B. Zhang, T. Zhang, X. Ma, P. Cheng, Y. Y. Zhang, X. Chen, J. F. Jia, and Q. K. Xue, Phys. Rev. B 85, 081305 (2012).
- Kou et al. (2012) X. F. Kou, W. J. Jiang, M. R. Lang, F. X. Xiu, L. He, Y. Wang, Y. Wang, X. X. Yu, A. V. Fedorov, P. Zhang, et al., Journal of Applied Physics 112, 063912 (2012).
- Schlenk et al. (2013) T. Schlenk, M. Bianchi, M. Koleini, A. Eich, O. Pietzsch, T. O. Wehling, T. Frauenheim, A. Balatsky, J.-L. Mi, B. B. Iversen, et al., Phys. Rev. Lett. 110, 126804 (2013).
- Yee et al. (2015) M. M. Yee, Z.-H. Zhu, A. Soumyanarayanan, Y. He, C.-L. Song, E. Pomjakushina, Z. Salman, A. Kanigel, K. Segawa, Y. Ando, et al., Phys. Rev. B 91, 161306 (2015).
- Polyakov et al. (2015) A. Polyakov, H. L. Meyerheim, E. D. Crozier, R. A. Gordon, K. Mohseni, S. Roy, A. Ernst, M. G. Vergniory, X. Zubizarreta, M. M. Otrokov, et al., Phys. Rev. B 92, 045423 (2015).
- Liu et al. (2015) Z. Liu, X. Wei, J. Wang, H. Pan, F. Ji, M. Ye, Z. Yang, and S. Qiao, Phys. Rev. B 92, 100101 (2015).
- Golnik et al. (1986) A. Golnik, E. Albert, M. Hamma, E. Westhauser, A. Weidinger, and E. Recknagel, Hyperfine Interactions 31, 375 (1986).
- Ansaldo et al. (1988) E. J. Ansaldo, D. R. Noakes, J. H. Brewer, S. R. Kreitzman, and J. K. Furdyna, Physical Review B 38, 1183 (1988).
- S. Hayano et al. (1980) R. S. Hayano, Y. J. Uemura, J. Imazato, N. Nishida, K. Nagamine, T. Yamazaki, Y. Ishikawa, and H. Yasuoka, Journal of the Physical Society of Japan 49, 1773 (1980).
- Lancaster et al. (2016) T. Lancaster, F. Xiao, Z. Salman, I. O. Thomas, S. J. Blundell, F. L. Pratt, S. J. Clark, T. Prokscha, A. Suter, S. L. Zhang, et al., Physical Review B 93, 140412 (2016).
- Zimmermann et al. (1998) R. Zimmermann, R. Claessen, F. Reinert, P. Steiner, and S. Hüfner, J. Phys. Condens. Matter 10, 5697 (1998).
- He et al. (2014) K. He, Y. Wang, and Q.-K. Xue, National Science Review 1, 38 (2014).
- van der Marck (1997) S. C. van der Marck, Physical Review E 55, 1514 (1997).
- Sato et al. (2010) K. Sato, L. Bergqvist, J. Kudrnovský, P. H. Dederichs, O. Eriksson, I. Turek, B. Sanyal, G. Bouzerar, H. Katayama-Yoshida, V. A. Dinh, et al., Reviews of Modern Physics 82, 1633 (2010).
Supplemental Material: Spectroscopic perspective on the interplay between electronic and magnetic properties of magnetically doped topological insulators
Implantation energy dependence of the SR measurements
Figure S1a shows the initial asymmetry ( in Eq. 1 of the main text) as a function of implantation energy, together with the simulated stopping probability in Figure S1b. The latter also takes back scattered muons into account, which are relevant at low implantation energies. The detailed stopping profiles at the different implantation energies are shown in Figure S2. At room temperature and low implantation energy the wTF-SR spectra exhibit a high initial asymmetry. With increasing energy the initial asymmetry first increases, because less muons are back scattered, and then decreases as more and more muons are implanted into the sapphire substrate and form muonium, see black hexagons in Figure S1a.
At low temperatures the asymmetry measured with high implantation energy is somewhat increased (blue squares in Figure S1a). This effect is observed in all measured samples and is independent of the exact composition of the TI layer and is attributed to the temperature dependence of the muonium formation in sapphire Brewer et al. (2000). The asymmetry at low implantation energy is strongly decreased in comparison to its high temperature value. However, this behavior at low implantation energies depends strongly on the studied sample, cf. the measurements at shown in Figure 2 in the main text, where the undoped sample shows almost no change of the initial asymmetry over the full temperature range. In the magnetic samples, there is a small increase of the asymmetry towards the lowest implantation energies despite the enhanced backscattering. This indicates that the stray fields of the magnetic TI layer are not sufficient to depolarize the muons stopping in the Te capping.
In addition, the open symbols in Figure S1a show the results of reference measurements on a bare sapphire substrate. The measurements were performed at a temperature of (grey circles) and (cyan diamonds) in a wTF of . The sample used in this measurement was larger than the TI samples and covered the whole beamspot, and therefore, does not contain any background contribution from muons landing outside the sample. The full temperature dependence of the initial asymmetry in the bare substrate is shown in Figure S3, exhibiting a large increase in asymmetry below .
Calculation of the magnetic volume fraction
In order to accurately evaluate the magnetic volume fraction of the doped TI layer, we need to account for the contributions of the capping layer and substrate to the measured asymmetry. We start by assuming that muons stopping in the Te capping precess with full asymmetry while muons stopping in the Ni coated sample backing are completely depolarized. The fraction of muons stopping in the sapphire substrate is expected to partly form muonium, and thereby contributing to the loss of initial asymmetry, while the rest precesses at a frequency Brewer et al. (2000). Our measurements on the bare substrate show that the initial asymmetry in sapphire is in general temperature and implantation energy dependent, in agreement with other reports Brewer et al. (2000); Prokscha et al. (2007). Here we approximate it with , which is the average of the measurements on a bare substrate taken at different implantation energies and , see dashed line in Figure S1. We also take into account muons landing in the small exposed areas on the film (where the substrate was clamped during growth) and assume that they contribute an asymmetry of . This gives us rough estimates for the contribution to the initial asymmetry from each layer of our samples, except for the TI.
Using the calculated stopping fraction of muons in each layer (Figures S1b and S2), together with the measured initial asymmetry , we can evaluate the contribution of the TI layer to the initial asymmetry as follows. We start by evaluating the total asymmetry of the film after correcting for the exposed areas,
| (S1) |
where denotes the fraction of the exposed sample area, typically . Then, we determine the contribution to the asymmetry from muons stopping inside the TI layer using,
| (S2) |
Finally, the magnetic volume fraction, , in the TI is given by,
| (S3) |
It is important to point out here that the value of used in these calculation is the main source of systematic errors in this calculation. A change in this value will result in re-scaling the y-axis of Figure 10 in the main text. The error in can be estimated from the range of possible values, e.g. between the values measured at high implantation energy in our samples ( muons stopping in the substrate) and those reported in Ref. [Prokscha et al., 2007] at low implantation energies. This results in a variation of up to in the volume fraction estimates at the lowest temperature. In this error estimation we use in the range 0.042 and 0.155, obtained from the temperature average at an implantation of in the V0.19 sample (this underestimates the value at low temperature) and the value from Ref. [Prokscha et al., 2007] at an implantation energy of and a temperature of , respectively.
Field dependence of the mean field
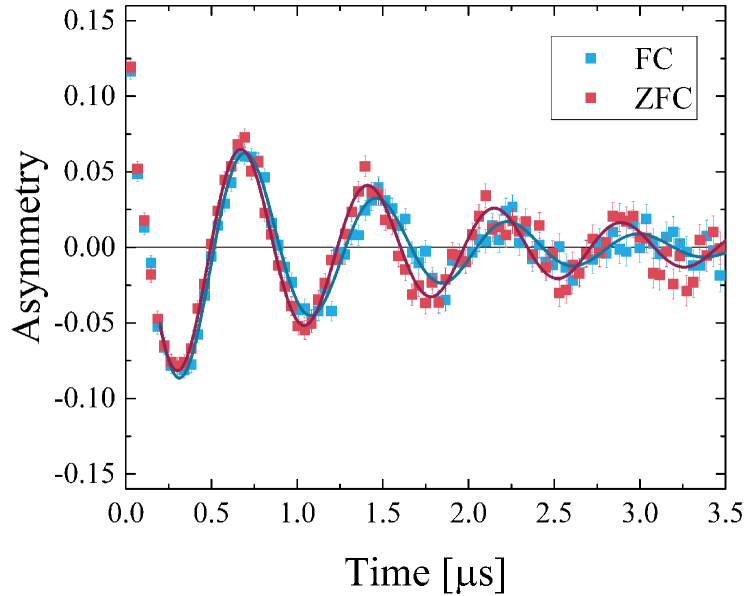
We performed measurements at different fields on the V0.08 sample in order to determine the nature of the field shift we observe at low temperatures in the wTF-SR measurements. We measured the precession signal at a temperature of , well above the magnetic transition, and compare it to measurements at . The shift in the mean field can be extracted from the difference in precession frequency at and . This is presented in Figure S4 as a function of applied field. Note that the shift is not proportional to the applied field, as one would expect e.g. for a Knight shift.
It resembles more the behavior of isolated large magnetic moments in a
magnetic field described by a
Brillouin-function Kittel (1986). Moreover, we find that the field
shift is reduced depending on the cooling history of the sample, as
evident in the difference between the measured spectra after field
cooling (FC) and zero field cooling (ZFC), shown in
Figure S5. Together, these results are strong indication
that the magnetic islands in the sample behave like superparamagnets
which are aligned by the small applied field.
References
- Brewer et al. (2000) J. D. Brewer, J. H. Brewer, G. D. Morris, D. G. Eshchenko, and V. G. Storchak, Physica B: Condensed Matter 289–290, 428 (2000).
- Prokscha et al. (2007) T. Prokscha, E. Morenzoni, D. G. Eshchenko, N. Garifianov, H. Glückler, R. Khasanov, H. Luetkens, and A. Suter, Physical Review Letters 98, 227401 (2007).
- Kittel (1986) C. Kittel, Introduction to Solid State Physics (John Wiley & Sons, Inc., New York, 1986), 8th ed.