SF2A 2017
Large-scale measurements of the red giant core rotation through asteroseismology
Abstract
Red giant stars are solar-like pulsators presenting mixed-modes. Such modes consist in a coupling between pressure waves propagating in the external convective envelope and gravity waves propagating in the radiative interior. Therefore, the red giant asteroseismology provides us with a direct view on their core and opens the possibility to monitor the evolution of their core rotation. Previous measurements of the mean core rotation revealed that angular momentum is efficiently transferred from the core to the envelope inside red giants, but the physical mechanisms at work are not yet fully understood. We thus need stronger observational constraints on the evolution of the red giant core rotation.
In this context, we developed an automated method to determine the mean core rotation of red giant branch stars observed with Kepler. This automated method is paving the way for the future PLATO data, representing hundreds of thousands of potential red giant oscillation spectra.
Results obtained for almost 1200 red giant branch stars indicate that the rate of the core rotation braking is lower than previoulsy estimated and does not seem to depend on the stellar mass.
keywords:
Stars: oscillations, - Stars: interior, - Stars: evolution, - Stars: rotation1 Introduction
The Kepler NASA space mission has provided frequency oscillation spectra of unprecedent quality, opening the possibility to study the red giant core rotation.
Red giants are evolved intermediate-mass stars, between 0.5 and 8 . Hydrogen is exhausted in the core and is burning in a shell above the core. Red giants can lay in two evolutionary phases, the red giant branch (RGB) or the red clump. During the RGB phase, the star undergoes strong structural changes: the inert helium core contracts while the convective envelope deepens and extends, leading to a strong increase of the stellar radius and luminosity. The clump phase comes when the red giant starts burning helium in the core.
Red giant stars are solar-type pulsators: internal seismic waves are stochastically excited by the turbulent convection in the external envelope (De Ridder et al. 2009). They present mixed-modes, consisting in a coupling between pressure waves propagating in the convective envelope and gravity waves propagating in the radiative interior (Beck et al. 2011). This feature allows us to have a direct insight on their core, which is not the case for solar-type pulsators on the main sequence like the Sun.
Rotation strongly impacts the stellar structure and evolution by altering the chemical element mixing inside stars (Lagarde et al. 2012), but including rotation in stellar evolution models is still challenging. Models still predict central rotation rates at least ten times too large compared to asteroseismic measurements. It is thus of prime importance to know how internal rotation evolves in time. Moreover, measurements of the mean core rotation of almost 300 red giants have revealed that the red giant core is slowing down along the RGB, while the core is contracting (Mosser et al. 2012). This necessarily implies that a very efficient angular momentum transport from the core to the envelope is at work inside red giants. Magnetic fields, (Cantiello et al. 2014), mixed-modes (Belkacem et al. 2015a, b) or internal gravity waves (Fuller et al. 2014; Pinçon et al. 2017) stand among the physical mechanisms that can dissipate angular momentum. Nevertheless, no modelling based on such physical mechanisms can reproduce the measured orders of magnitude of the red giant core rotation. We thus need stronger observational constraints on the evolution of rotation inside evolved stars.
2 Automatic measurements of the red giant mean core rotation
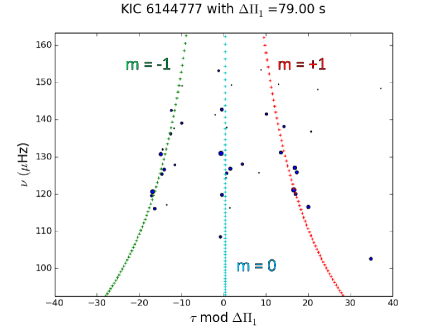
Rotation has an effect on oscillation spectra which is similar to the Zeeman effect of a magnetic field on the energy levels of an atom: it lifts the degeneracy between oscillation modes having the same angular degree but different azimuthal orders .
We consider in this study dipole mixed-modes with a degree as they mostly probe the red giant core (Goupil et al. 2013). In these conditions rotation generates three rotational components having azimuthal order values .
We can build échelle diagrams based on stretched periods that reveal the rotational components (Mosser et al. 2015; Gehan et al. 2016a, b). The number of visible rotational components depends on the stellar inclination: the two components associated to are present when the star is seen equator-on, all the three rotational components are visible for intermediate inclination configurations, and only the rotational component associated to can be observed when the star is seen pole-on.
The stretched period spacing between dipole mixed-modes having the same azimuthal order depends on the mean core rotational splitting (Mosser et al. 2015). It varies as
| (1) |
where is the asymptotic period spacing of pure dipole gravity modes, defines the stretching of the mode periods, and are the mode frequencies. The measurement of gives an estimate of the mean core angular velocity (Goupil et al. 2013; Mosser et al. 2015) through
| (2) |
We developed a method allowing an automated identification of the rotational components based on the correlation of the observed spectrum with synthetic ones constructed through Eq.1 (Gehan et al. 2018).
3 Constraining the rate of the core braking
We applied our method to 1714 RGB stars presenting a large mass range from 1 up to 2.5 (Gehan et al. 2018). Stellar masses were estimated from the asteroseismic global parameters and (Kjeldsen & Bedding 1995; Mosser et al. 2013) through
| (3) |
where is the large separation of pure pressure modes, and is the frequency of maximum oscillation power. Hz, Hz and are the solar values chosen as references.
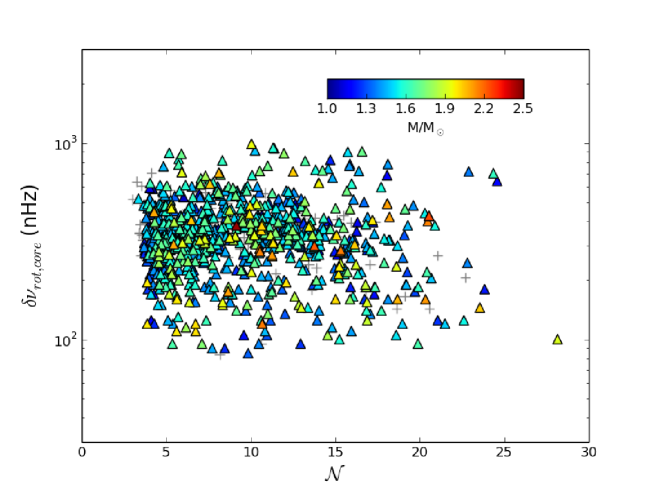
Our method led to the identification of the rotational components for 69% of cases. As it is not possible to retrieve information on the core rotation of stars seen pole-on, we obtained 875 mean core rotation measurements,
with a typical uncertainty of about 10 nHz (Fig. 2).
We considered the number of gravity modes per -wide frequency range as a proxy of stellar evolution (Gehan et al. 2018). This mixed-mode density is defined as
| (4) |
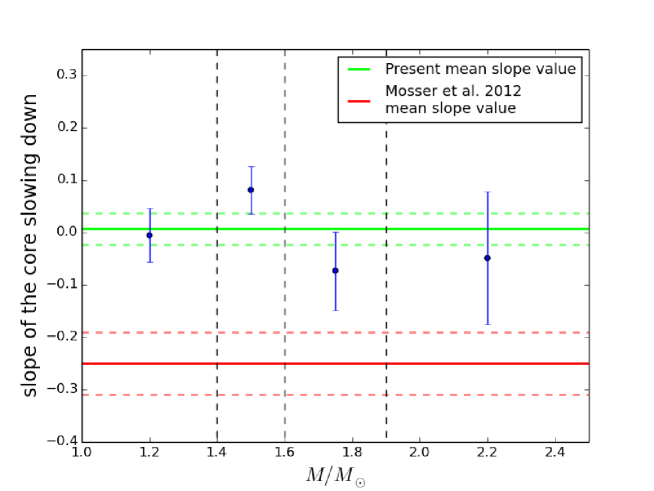
The large dataset considered in this study covering an extended mass range allowed us to investigate how the rate of the core braking depends on the stellar mass. We thus selected stars in four different mass ranges and fitted a relonship of the type
| (5) |
The exponents are summarized in Table 1 as a function of the mass range considered. The present result indicates that the braking rate of the core rotation does not seem to depend on the stellar mass (Fig. 3). When applying Eq.5 to the measurements for RGB stars made by Mosser et al. (2012), we obtain a mean braking rate much higher than the value measured in this study (Table 2). This discrepancy is mainly due to sample effects. Indeed, we now have a RGB sample about 10 times larger than Mosser et al. (2012), thus more significant from a statistical point of view. The result obtained provides a more precise estimate of the slope of the core braking (Fig. 3). Nevertheless, the lower slope of the core braking measured in this study does not call into question the results of Mosser et al. (2012) predicting an efficient angular momentum transport inside red giant cores.
4 Conclusions
Disentangling rotational splittings from mixed modes is now possible in a simple way, opening the era of large-scale measurements of the core rotation of red giants. We developed a method allowing an automated identification of the dipole gravity-dominated mixed-modes split by rotation, providing us with a measurement of the mean core rotational splitting . The method satisfactorily identified the rotational components of 1181 red giant branch stars, representing a success rate of 69% and providing us with 875 measurements. This large dataset including stars with masses as high as 2.5 allowed us to show that the slope of the core braking does not seem to depend on the stellar mass, but also that this slope is much lower than what was estimated by Mosser et al. (2012). Nevertheless, this measurement does not go against a very efficient angular momentum transport inside red giant cores. This result suggests that the efficiency of the mechanism transporting angular momentum inside red giant branch stars should increase with the stellar mass in order to compensate simultaneously the stronger differential rotation which is expected to develop in higher mass stars and their faster temporal evolution. Further investigation on the efficiency of the angular momentum transport inside red giants is necessary, through modelling of the evolution of the core inertia depending on the stellar mass.
Acknowledgements.
We acknowledge financial support from ”Programme National de Physique Stellaire” (PNPS) of CNRS/INSU, France.References
- Beck et al. (2011) Beck, P. G., Bedding, T. R., Mosser, B., et al. 2011, Science, 332, 205
- Belkacem et al. (2015a) Belkacem, K., Marques, J. P., Goupil, M. J., et al. 2015a, A&A, 579, A30
- Belkacem et al. (2015b) Belkacem, K., Marques, J. P., Goupil, M. J., et al. 2015b, A&A, 579, A31
- Cantiello et al. (2014) Cantiello, M., Mankovich, C., Bildsten, L., et al. 2014, ApJ, 788, 93
- De Ridder et al. (2009) De Ridder, J., Barban, C., Baudin, F., et al. 2009, Nature, 459, 398
- Fuller et al. (2014) Fuller, J., Lecoanet, D., Cantiello, M., et al. 2014, ApJ, 796, 17
- Gehan et al. (2016a) Gehan, C., Mosser, B., & Michel, E. 2016a, ArXiv e-prints
- Gehan et al. (2016b) Gehan, C., Mosser, B., & Michel, E. 2016b, ArXiv e-prints
- Gehan et al. (2018) Gehan, C., Mosser, B., & Michel, E. 2018, in prep.
- Goupil et al. (2013) Goupil, M. J., Mosser, B., Marques, J. P., et al. 2013, A&A, 549, A75
- Kjeldsen & Bedding (1995) Kjeldsen, H. & Bedding, T. R. 1995, A&A, 293, 87
- Lagarde et al. (2012) Lagarde, N., Decressin, T., Charbonnel, C., et al. 2012, A&A, 543, A108
- Mosser et al. (2012) Mosser, B., Goupil, M. J., Belkacem, K., et al. 2012, A&A, 548, A10
- Mosser et al. (2013) Mosser, B., Michel, E., Belkacem, K., et al. 2013, A&A, 550, A126
- Mosser et al. (2015) Mosser, B., Vrard, M., Belkacem, K., et al. 2015, A&A, 584, A50
- Pinçon et al. (2017) Pinçon, C., Belkacem, K., Goupil, M. J., et al. 2017, ArXiv e-prints