Average Spectral Properties of Type Ia Supernova Host Galaxies
Abstract
We construct average spectra of host galaxies of slower, faster, bluer, and redder Type Ia Supernovae (SNe Ia) from the SDSS-II supernova survey. The average spectrum of slower declining (broader light-curve width or higher stretch) SN Ia hosts shows stronger emission lines compared to the average spectrum of faster declining (narrower light-curve width or lower stretch) SN Ia hosts. Using pPXF, we find that hosts of slower declining SNe Ia have metallicities that are, on average, 0.24 dex lower than average metallicities of faster declining SN Ia hosts. Similarly, redder SN Ia hosts have slightly higher metallicities than bluer SN Ia hosts. Lick index analysis of metallic lines and Balmer lines show that faster declining SN Ia hosts have relatively higher metal content and have relatively older stellar populations compared with slower declining SN Ia hosts. We calculate average Star Formation Rate (SFR), stellar mass, and the specific-SFR (sSFR) of host galaxies in these subgroups of SNe Ia. We find that slower declining SN Ia hosts have significantly higher () sSFR than faster declining SN Ia hosts. A Kolmogorov-Smirnov test shows that these two types of hosts originate from different parent distributions. Our results, when compared with the models of Childress et al. (2014), indicate that slower declining SNe Ia, being hosted in actively star-forming galaxies, are young (prompt) SNe Ia, originating from similar progenitor age groups.
1 Introduction
Type Ia Supernovae (SNe Ia) are currently the most useful distance indicators across the wider history of cosmic expansion. Empirical correlations between the properties of SNe Ia have made them standardizable candles (Phillips, 1993). This eventually lead to the surprising discovery that the expansion of the universe is accelerating (Perlmutter et al. 1997, Riess et al. 1998). The unknown force responsible for this acceleration, commonly known as dark energy, is poorly understood. Reducing uncertainties in determining cosmological constraints is the key to shed light on the nature of dark energy (Scolnic et al. 2017; Betoule et al. 2014). Understanding the properties of SNe Ia and their astrophysical origin is an avenue to achieve this goal.
SNe Ia seem to show diversity in their light curve properties. Some are bluer while some are redder. Some have faster declining light curves, while some have slower declining light-curves. Why these diversities exist, is not clear yet. Theory suggests that SN Ia explosions are powered by radioactive decay of . More produces more luminous, slower declining SNe Ia. While directly probing SN Ia progenitors is challenging, we can study the global stellar populations of SNe Ia as a proxy for the progenitors. For example, Timmes et al. (2003) suggest a relationship between and host metallicity. If this prediction is true then we expect fainter, faster declining SNe Ia to be associated with massive, metal-rich, and therefore, lower star-forming galaxies and vice versa. Neill et al. (2009) have found that this trend is consistent with observed data.
A number of studies have been carried out on SN Ia - host correlations using both global and local host properties (e.g., Uddin et al. 2017; Pan et al. 2014; Gupta et al. 2011; Lampeitl et al. 2010; Sullivan et al. 2010; Rigault et al. 2013; Campbell et al. 2016; Wolf et al. 2016; Johansson et al. 2013; Hill et al. 2016; Roman et al. 2017 etc). Some of these studies use host photometry, while others use spectra of host galaxies. The general nature of these studies are two-fold: (1) SNe Ia are grouped according to their host galaxy properties and thereafter mean SN Ia properties are computed; (2) linear regression lines are drawn between pairs of SN Ia-host property groups and the slopes are computed. From these studies it is established that SNe Ia, after standardization, are more luminous111By more luminous we mean relatively lower Hubble residual, which is defined as, , the difference between the observed and the model distance modulus. and faster declining in massive (metal-rich), older hosts and hosts with lower specific star-formation rates (sSFR).
Why the above discussed correlations exist, is not clear yet. Childress et al. (2014) have made theoretical investigations on the ages of SNe Ia. Their study shows that young (prompt) SNe Ia are found in young, less massive, and actively star-forming galaxies. They originate from similar progenitor age groups and should make a uniform sample for cosmological analysis. On the other hand, old (tardy) SNe Ia are found in older galaxies with relatively lower star-formation activities. These SNe Ia originate from different progenitor age groups. It is also difficult to clearly understand progenitor channels of SNe Ia. Two possible scenarios are proposed: single degenerate and double degenerate. A recent analysis from Heringer et al. (2017) favors a double degenerate case, yet other options are possible.
A way to understand the diversity in SN Ia properties is to study average spectral signatures and average properties of their host galaxies grouped according to the properties of SNe Ia, such as color and light-curve width. The advantage of such analysis is that it will give a clear picture of the properties of stellar populations of SNe Ia with different properties. Brandt et al. (2010) has constructed average spectra of faster and slower declining SNe Ia hosts from 101 SDSS-II SN Ia sample and showed that the average spectrum of slower declining hosts is dominated by stronger emission lines, indicating ongoing star-formation. Using a sample of 84 SNe Ia, Johansson et al. (2013) split SN Ia host spectra into four bins in stretch and found that as we go from lower to higher stretch, emission line strengths of the host galaxies become increasingly prominent.
While both above mentioned studies make qualitative statements, no quantitative results were shown. Their sample sizes were small and moreover they have only studied average spectra in stretch bins, not in SN Ia color bins. In this paper, we extend such study with 311 SNe Ia from SDSS-II – a three-fold increase of sample size. Moreover, we quantify average emission line properties and derive average host properties, such as SFR and sSFR, after splitting SNe Ia according to their stretch and color.
2 Data
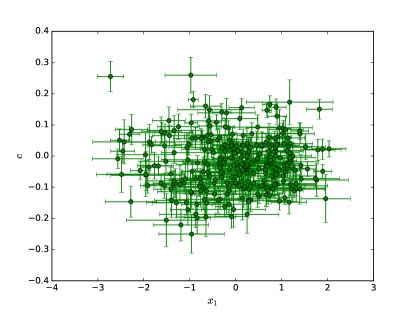
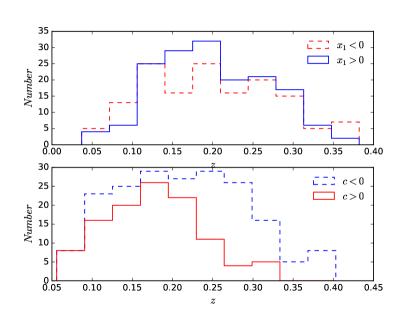
We use a sample of 311 SNe Ia from the Sloan Digital Sky Survey-II (SDSS-II; see Frieman et al. 2008 for SN survey). In phase two of the survey SDSS-II scanned a part of the sky near the celestial equator, known as the Stripe 82 in order to discover supernovae. Between Sept 2005 - Nov 2007, SDSS-II has discovered 500 spectroscopically confirmed SNe Ia in the range . The final data release of the SDSS-II supernova program is presented in Sako et al. (2014). We have taken SN Ia properties such as redshift (), stretch (), and color () from the Joint Light curve Analysis (JLA; Betoule et al. 2014). JLA uses SALT (Guy et al. 2010) to fit SN Ia light curves after calibrating with the CALSPEC standards. We show our sample in Fig. 1. The left panel shows the distribution of SNe in the stretch-color () plane. The right two panels show redshift distributions of SNe Ia in stretch and color subgroups. Subgroups are defined in Table 1. We see in color distributions that there are more bluer SNe Ia at higher redshifts than the redder ones. This is due to a Malmquist bias effect. The distributions in stretch subgroups seem to be similar.
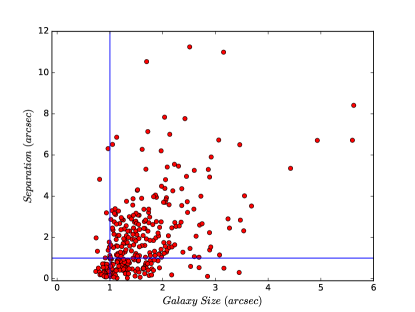
The source of SN Ia host spectra is the Baryon Oscillation Spectroscopic Survey (BOSS; Dawson et al. 2013) - a survey conducted between fall 2009 to spring 2014. The spectrograph of BOSS has 1000 fibers each of diameter 2 arcsec. The resolution is and the wavelength coverage is 360-1000nm. Our goal is to study global properties of host galaxies, not the local properties at the explosion sites of SNe Ia. For the latter, integral field spectroscopy is promising. Fig. 2 shows that some host galaxies fall within 1 arcsec radius of the fiber. Also, of the time, separations between SNe Ia and host nuclei are within 1 arcsec.
We gather FITS spectra from SDSS data release 12 (DR12) using a web based query located at the Science Archive Server222http://data.sdss3.org/. The second extension of each FITS file contains a coadded calibrated spectrum of a given combination of Plate-MJD-Fiber, which is a unique combination for a given object. The fourth extension contains integrated fluxes and equivalent widths of various spectral lines.
3 Analysis
Our aim of this study is to compare average spectral properties and stellar populations of SN Ia hosts by splitting them according to SN Ia properties. We define various SN Ia subgroups in Table 1 and split host galaxies according to these criteria. We first combine host spectra in different subgroups to create average host spectra and compare average spectra between subgroups. We then calculate average luminosities of various emission lines. Thereafter, we calculate SFR for these hosts, and using stellar mass from other work we calculate sSFRS. We present our analysis below.
| Subgroup | Criteria | Number |
|---|---|---|
| Faster | 116 | |
| Slower | 121 | |
| Bluer | 145 | |
| Redder | 92 |
3.1 Average Spectra
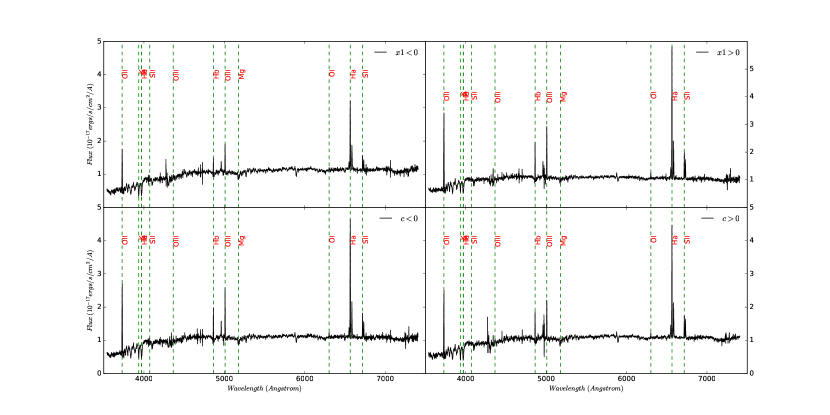
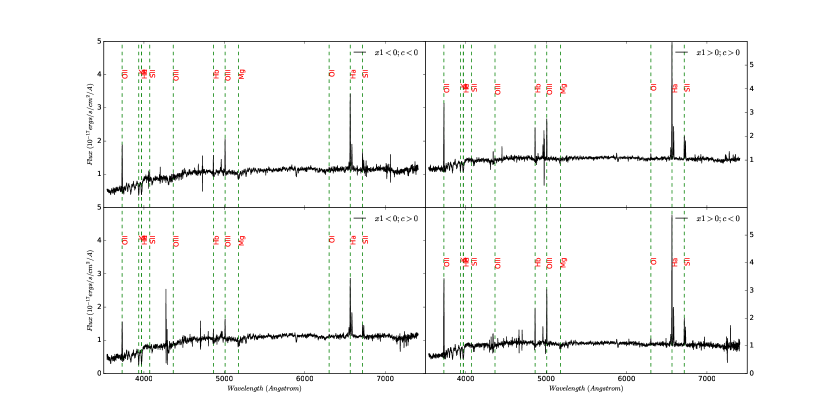
In order to study average spectra of SN Ia hosts in each group, we first split them according to SN Ia properties and coadd. Before coadding we interpolate each spectrum on to the rest frame wavelengths. We then coadd observed spectra with no correction for distance effects, which gives higher weight to galaxies of greater apparent brightness. Average spectra of SN Ia hosts in each subgroup are shown in Fig. 3.
It is easy to see from the top two panels of Fig. 3 that, on average, slower () SN Ia hosts have stronger emission lines compared to faster () SN Ia hosts, indicating stronger SFRs in them. This result confirms earlier findings of Brandt et al. (2010) and Johansson et al. (2013). We do not see any significant difference in the average spectra in color subgroups as shown in the bottom two panels of Fig. 3. We use penalized PiXel Fitting (pPXF; Cappellari & Emsellem 2004) method to fit stellar continuum and emission lines in these average spectra. Ages and metallicities derived from pPXF fitting on these average spectra are given in Table 2. Slower declining SN Ia hosts have relatively lower metallicity (0.24 dex lower) than faster declining SN Ia hosts. We find them slightly younger than their counterparts.
We also calculate Lick indices (Worthey et al. 1994) to compare ages and metallicities that are shown in Table 3. Comparing metallic lines ( and ), we find that hosts of faster declining SNe Ia have higher equivalent widths compared with hosts of slower declining SNe Ia. This proves that faster declining SN Ia hosts are relatively more metal rich and have relatively older stellar populations than their counterparts. In terms of Balmer lines (), they are stronger in slower declining SN Ia hosts, indicating relatively younger and metal poor stellar populations. From both pPXF fitting and Lick index measurements, we find that the redder SN Ia hosts have higher metallicities than bluer SN Ia hosts. This result is consistent with Childress et al. (2013), where they find that SNe Ia are redder when they explode in higher metallicity hosts.
| 0.875 | 0.902 | 0.926 | 0.880 | |
| -0.163 | -0.403 | -0.304 | -0.238 |
We calculate average luminosities of various emission lines in various subgroups and show them in Table 4. We find that hosts of slower declining SNe Ia on average are more luminous than hosts of faster declining SNe Ia. We also find that hosts of bluer SNe Ia are also more luminous than those of redder SNe Ia.
| Equivalent Widths | ||||
|---|---|---|---|---|
| 3.109 | 1.987 | 2.061 | 3.206 | |
| -0.090 | -2.437 | -1.329 | -1.339 | |
| 2.464 | 2.923 | 2.821 | 2.560 | |
| 0.155 | 0.113 | 0.131 | 0.136 |
We further divide SN Ia hosts into four quadrants in the plane. Average spectra of them are shown in Fig. 4. For faster SNe Ia, bluer and redder hosts seem to differ in the strength of the emission lines. Thus SFR (or more precisely, sSFR) are different. Redder ones have weaker emission. We expect that the redder ones would have more dust arising from more recent star formation, but we see the opposite here. Probably, there are more metal-rich and/or older.
For slower SNe Ia, there appears to be effectively no difference in host spectra between bluer and redder SNe Ia. If true, this would indicate that there is no real progenitor-related mechanism causing the color differences in these slower SNe Ia. Thus there is probably something driving intrinsic color which may be completely stochastic. It is a promising result for cosmology because it means we don’t have to worry about intrinsic color evolution with redshift.
| Emission Lines | ||||
|---|---|---|---|---|
| () | ||||
| Hα | 6.77 | 10.91 | 10.25 | 7.09 |
| Hβ | 1.45 | 2.66 | 2.67 | 1.40 |
| Hγ | 0.75 | 1.18 | 1.26 | 0.64 |
| Hδ | 1.12 | 2.45 | 3.17 | 0.61 |
| 3729 | 1.34 | 2.21 | 2.27 | 1.27 |
| 6583 | 3.73 | 4.00 | 3.89 | 3.84 |
3.2 Comparing Average Properties
After studying average spectra we now study several properties of SN Ia hosts in various subgroups. First we calculate SFR. is considered to be the best choice for calculating SFR because of its intrinsic strength. It is also suitably located in the redder part of the spectrum that avoids significant dust extinction. We obtain integrated flux of emission line for each galaxy that was used in the coadds. We then calculate luminosity of in CDM cosmological framework. To calculate SFR we use an empirical formulation given by Kennicutt (1998):
| (1) |
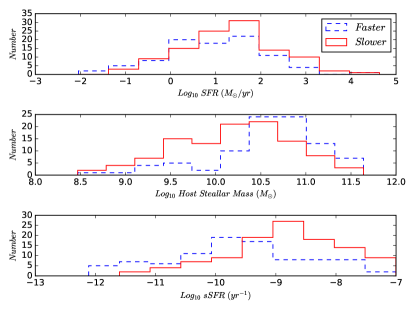
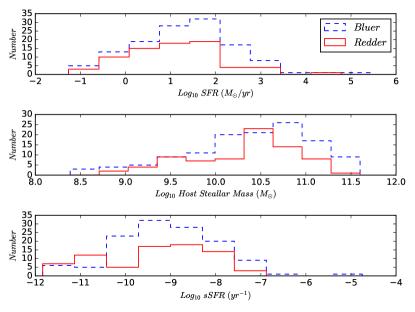
In Fig. 5 we show distributions of SFR, stellar mass (from Uddin et al. 2017), and sSFR of host galaxies of faster, slower, bluer, and redder SNe Ia. Host galaxies of slower declining SNe Ia tend to have higher SFRs, lower masses, and therefore higher sSFRs. On the other hand, these host properties do not differ between bluer and redder SN Ia hosts.
We further elaborate these results by performing statistical analysis. First, we perform a Kolmogorov-Smirnov (K-S) hypothesis test to state if two host distributions for each host property are intrinsically the same or not. The null hypothesis in this case is that two distributions are drawn from the same parent distribution. We show K-S test results in Table 6.
It is evident from very low -values for stellar mass and sSFR between faster and slower SN Ia hosts that they are intrinsically different. This also means that the mean values of stellar mass and sSFR on these two subgroups will be significantly different. We perform 100 bootstrap sampling to calculate mean and error in the mean host property in each subgroup. They are shown in Table 6.
We see that on average slower declining SN Ia hosts have significantly higher () sSFR than faster declining SN Ia hosts. They also have significantly lower () stellar mass than their counterparts. These properties do not seem to differ between the hosts of bluer and redder SNe Ia.
| Subgroup Pairs | Host Property | -statistics | -value |
|---|---|---|---|
| Faster-Slower | SFR | 0.17 | 0.10 |
| Mass | 0.32 | 3e-5 | |
| sSFR | 0.36 | 2e-6 | |
| Bluer-Redder | SFR | 0.17 | 0.12 |
| Mass | 0.19 | 0.06 | |
| sSFR | 0.17 | 0.11 |
| Subgroup | SFR | Mass | sSFR |
|---|---|---|---|
| Faster | 0.986 (0.117) | 10.581 (0.061) | -9.594 (0.116) |
| Slower | 1.376 (0.102) | 10.158 (0.068) | -8.773 (0.099) |
| Bluer | 1.305 (0.095) | 10.375 (0.061) | -9.064 (0.107) |
| Redder | 1.002 (0.135) | 10.308 (0.068) | -9.293 (0.140) |
4 Summary
We have studied average spectra and physical properties of slower, faster, bluer, and redder SN Ia host galaxies. We have seen that the average spectrum of slower declining SN Ia hosts has stronger emission line features compared with the average spectrum of faster declining SN Ia hosts. They also have metallicities that are, on average, 0.24 dex lower than their counterparts as derived using pPXF. Between bluer and redder SN Ia hosts, average spectra do not vary in terms of emission line features. We also perform Lick index analysis of metal and Balmer lines. Our result show that hosts of faster declining SNe Ia have relatively higher metal content and have relatively older stellar population than hosts of faster declining SNe Ia. Similarly, redder SN Ia host have relatively more metal than bluer SN Ia hosts. We have calculated SFRs from luminosities and found that slower declining SN Ia hosts have significantly () higher sSFR and also are significantly () lower mass galaxies than faster declining SN Ia hosts.
The K-S hypothesis test has shown that the hosts of slower and faster declining SNe Ia originate from different stellar populations when we compare their stellar mass and sSFR distributions. On the other hand, there are no significant differences in these properties between the hosts of bluer and redder SNe Ia and they originate from the same parent stellar population according to the K-S test.
Results we have summarized above have some significance in understanding SN Ia progenitors. It has been shown that young (prompt) SNe Ia originate from younger, low mass, actively star-forming galaxies (Childress et al. 2014). If we compare our results, we find that slower declining SNe Ia are young SNe Ia since they are hosted in high SFR galaxies.
In this paper we have studied SN Ia light-curve properties. The next step should be to study average properties of SN Ia hosts in SN Ia corrected luminosity subgroups, which will be important for addressing systematic uncertainties in SN Ia cosmology. We have performed this study within a redshift of . The Dark Energy Survey (DES; Bernstein et al. 2012) will discover SNe Ia upto redshift of . The host spectra for these SN Ia are coming from OzDES (Yuan et al. 2015), which will enable us to continue this study at higher redshifts.
References
- Astropy Collaboration et al. (2013) Astropy Collaboration, Robitaille, T. P., Tollerud, E. J., et al. 2013, A&A, 558, A33
- Bernstein et al. (2012) Bernstein, J. P., Kessler, R., Kuhlmann, S., et al. 2012, ApJ, 753, 152
- Betoule et al. (2014) Betoule, M., Kessler, R., Guy, J., et al. 2014, A&A, 568, A22
- Brandt et al. (2010) Brandt, T. D., Tojeiro, R., Aubourg, É., et al. 2010, AJ, 140, 804
- Campbell et al. (2016) Campbell, H., Fraser, M., & Gilmore, G. 2016, MNRAS, 457, 3470
- Cappellari & Emsellem (2004) Cappellari, M., & Emsellem, E. 2004, PASP, 116, 138
- Childress et al. (2013) Childress, M., Aldering, G., Antilogus, P., et al. 2013, ApJ, 770, 108
- Childress et al. (2014) Childress, M. J., Wolf, C., & Zahid, H. J. 2014, MNRAS, 445, 1898
- Dawson et al. (2013) Dawson, K. S., Schlegel, D. J., Ahn, C. P., et al. 2013, AJ, 145, 10
- Frieman et al. (2008) Frieman, J. A., Turner, M. S., & Huterer, D. 2008, ARA&A, 46, 385
- Gupta et al. (2011) Gupta, R. R., D’Andrea, C. B., Sako, M., et al. 2011, ApJ, 740, 92
- Guy et al. (2010) Guy, J., Sullivan, M., Conley, A., et al. 2010, A&A, 523, A7
- Heringer et al. (2017) Heringer, E., Pritchet, C., Kezwer, J., et al. 2017, ApJ, 834, 15
- Hill et al. (2016) Hill, R., Shariff, H., Trotta, R., et al. 2016, ArXiv e-prints, arXiv:1612.04417
- Johansson et al. (2013) Johansson, J., Thomas, D., Pforr, J., et al. 2013, MNRAS, 435, 1680
- Kennicutt (1998) Kennicutt, Jr., R. C. 1998, ApJ, 498, 541
- Lampeitl et al. (2010) Lampeitl, H., Smith, M., Nichol, R. C., et al. 2010, ApJ, 722, 566
- Neill et al. (2009) Neill, J. D., Sullivan, M., Howell, D. A., et al. 2009, ApJ, 707, 1449
- Pan et al. (2014) Pan, Y.-C., Sullivan, M., Maguire, K., et al. 2014, MNRAS, 438, 1391
- Perlmutter et al. (1997) Perlmutter, S., Gabi, S., Goldhaber, G., et al. 1997, ApJ, 483, 565
- Phillips (1993) Phillips, M. M. 1993, ApJ, 413, L105
- Riess et al. (1998) Riess, A. G., Filippenko, A. V., Challis, P., et al. 1998, AJ, 116, 1009
- Rigault et al. (2013) Rigault, M., Copin, Y., Aldering, G., et al. 2013, A&A, 560, A66
- Roman et al. (2017) Roman, M., Hardin, D., Betoule, M., et al. 2017, ArXiv e-prints, arXiv:1706.07697
- Sako et al. (2014) Sako, M., Bassett, B., Becker, A. C., et al. 2014, ArXiv e-prints, arXiv:1401.3317
- Scolnic et al. (2017) Scolnic, D. M., Jones, D. O., Rest, A., et al. 2017, ArXiv e-prints, arXiv:1710.00845
- Sullivan et al. (2010) Sullivan, M., Conley, A., Howell, D. A., et al. 2010, MNRAS, 406, 782
- Timmes et al. (2003) Timmes, F. X., Brown, E. F., & Truran, J. W. 2003, ApJ, 590, L83
- Uddin et al. (2017) Uddin, S. A., Mould, J., Lidman, C., Ruhlmann-Kleider, V., & Zhang, B. R. 2017, ArXiv e-prints, arXiv:1709.05830
- Wolf et al. (2016) Wolf, R. C., D’Andrea, C. B., Gupta, R. R., et al. 2016, ApJ, 821, 115
- Worthey et al. (1994) Worthey, G., Faber, S. M., Gonzalez, J. J., & Burstein, D. 1994, ApJS, 94, 687
- Yuan et al. (2015) Yuan, F., Lidman, C., Davis, T. M., et al. 2015, MNRAS, 452, 3047