11email: andrievskii@ukr.net 22institutetext: GEPI, Observatoire de Paris, PSL, Research University, CNRS, Univ Paris Diderot, Sorbonne Paris Cité, Place Jules Janssen, 92195 Meudon, France 33institutetext: Université Côte d’Azur, Observatoire de la Côte d’Azur, CNRS, Laboratoire Lagrange, Bd de l’Observatoire, CS 34229, 06304, Nice Cedex 4, France 44institutetext: Crimean Astrophysical Observatory, Nauchny, 298409, Crimea
Barium abundance in the central part of the dSph Fornax galaxy.
We revisited barium abundance in a sample of giant stars in the dwarf spheroidal Fornax galaxy. Non-local thermodynamic equilibrium (NLTE) synthesis was used to derive the barium abundance from two Ba II lines. Our new NLTE result for barium shows that in the range of metallicities from –1 to –0.5 the abundance of this element is almost the same as in the stars of the Milky Way. We conclude that the evolution of barium abundance in the dSph Fornax galaxy resembles that of the Milky Way at the epoch of the corresponding metallicity level.
Key Words.:
stars: abundances – galaxies: individual: Fornax – galaxies: evolution – galaxies: dwarf – galaxies: formation1 Introduction.
In recent years chemical properties of dwarf galaxies from the Local Group have attracted the attention of Galactic evolution researchers. Two questions are of particular importance. First, was our Galaxy formed as a result of the merging process involving smaller stellar systems such as the dwarf galaxy and irregular galaxies? Second, is chemical evolution in dwarf galaxies similar to or different from the evolution of our Galaxy at the similar metallicities? Many papers were published in the literature on these topics attempting to answer these two questions. Initially, formation scenarios considered two possible options. According to the first scenario (Eggen et al. 1962), our Galaxy was formed from a metal-poor, slowly spinning protogalactic cloud of spherical form and, after this cloud collapsed, field halo stars and globular clusters were formed. Another scenario, proposed by Searle (1977), assumed that the Galaxy formed from the ”building blocks” of masses of about 108 M⊙. Such merging fragments then evolved independently of each other. The problem of galaxy formation has not been solved to this point. For example, based on the chemodynamical analysis of the Galactic halo, Carollo et al. (2007) proposed that our Galaxy was formed by continuous accretion of separate stellar subsystems or protogalactic clumps (i.e., dwarf spheroidal galaxies and irregular galaxies). In contrast, Geisler et al. (2007) argued that stellar subsystems are rather different from the Galactic halo in their chemical properties and thus the accretion scenario is hardly valid.
It is considered to be well established today that dwarf galaxies from the Local Group demonstrate a decreased abundance of -elements compared to abundances in the Milky Way at the same metallicities. This is explained as a result of a different star formation history in dwarf galaxies; i.e., there is a lower star formation rate in the time-delay model (see Matteucci 2014).
Abundances of -process elements are also important tracers of Galactic evolution. The formation of -process elements occurs as a result of free neutron captures by seed nuclei in a medium with a low value of neutron flux. In contrast to this process, the -process produces higher mass nuclei in a medium with a high value of neutron flux. The interiors of AGB stars are appropriate places for such processes to operate. Among the elements that have a large contribution from -process are Sr, Y, Zr, Ba, and La and these have become the subject of many observational and theoretical studies. A high value of barium abundance indicates strong -process production in dwarf galaxies from low-mass stars with very long lifetimes.
The dwarf spheroidal galaxy Fornax is one of the most luminous satellites of the Milky Way. Its stellar population was studied spectroscopically by many authors. In particular, Letarte et al. (2010) and Lemasle et al. (2014) determined abundances of - and -process elements in the giants of this stellar system. In the first paper, these authors reported about a remarkable overabundance of barium in Fornax. In the second paper, the barium abundance results were revisited, but nevertheless, the new mean [Ba/Fe] value appeared to be rather high as well.
As a rule, the Ba II lines are used as a barium abundance indicator. Since the rather bright giant stars in external galaxies are more readily available for high resolution spectroscopy, one should expect that the Ba II lines seen in their spectra are strong. The abundance analysis of these strong lines require some additional attention and special methods. The abundances of -process elements in the stars of satellite dwarf galaxies are of great importance both for understanding their evolution and the evolution of our Galaxy. Therefore, we decided to reconsider barium abundance in the dwarf Sph Fornax galaxy without resorting to the LTE approximation.
2 Stellar sample and method
Our program star sample was previously investigated by Letarte et al. (2010). The spectra were secured with ESO VLT facilities with resolving power of about 20000 in the two ranges 5340–5620 Å and 6120–6701 Å. Eighty-one RGB stars were selected in the central part of the Fornax dSph galaxy. In contrast to the above-mentioned work, where authors derived abundances of 12 chemical elements, we only concentrated on one element, i.e., barium, because Letarte et al. reported a puzzling strong overabundance of this element in the Fornax giants.
We used stellar parameters and iron abundances determined by Letarte et al. (2010). The program stars and their iron abundances are listed in Table 2 together with our NLTE abundance of barium.
The barium abundance for each star was determined without the LTE approximation. For our NLTE calculations we used MULTI code (Carlsson 1986) later modified by Korotin et al. (1999). Our barium atomic model contains 31 levels of Ba I, 101 levels of Ba II with quantum number ¡ 50, and the ground level of Ba III ion. We computed in detail 91 bound-bound transitions between the first 28 levels of Ba II ( ¡ 12 and ¡ 5). Information about the adopted oscillator strengths, photoionization cross-sections, collisional rates, and broadening parameters can be found in (Andrievsky et al. 2009). To derive the barium abundance, we fitted the NLTE synthetic profiles with the observed profiles of two Ba II lines, i.e., 6141 and 6496 Å.
Within the considered range of atmosphere parameters, barium lines do not show large deviations from LTE. At the same time NLTE corrections demonstrate complex behavior that depends on atmosphere parameters and barium abundance itself (Korotin et al., 2015). For the 6496 Å barium line, the hyperfine structure (hfs) was taken into account, albeit its influence on the line profile is negligible. The distance between hfs components is less than 0.012 Å.
Because of the modest resolving power of our spectra (R=20000) the barium line 6496 Å is partially blended in its blue wing with neutral iron line 6496.4 Å. The line at 6141 Å is also blended with the line of the neutral iron at 6141.7 Å, which means that it is not possible to measure the equivalent widths of these lines accurately. Therefore we investigated their profiles using the synthetic spectrum technique.
As in our paper series on NLTE analysis, we used a combination of the NLTE calculation of the -factors (the ratio between NLTE and LTE atomic level populations) and the LTE spectrum synthesis (SYNTHV code; Tsymbal 1996). With the latter code we generated synthetic spectrum in the vicinity of each barium line taking into account all the lines in the considered wavelength region listed in the Vienna Atomic Line Database (VALD; Piskunov et al. 1996, Kupka et al. 1999) 111http://vald.astro.univie.ac.at/ vald3/php/vald.php. While those lines were treated in LTE, for the profile synthesis of the barium lines we used previously calculated -factors. We included these factors in SYNTHV to calculate the NLTE barium line source function, and using this procedure we were able to take into account the lines of other species that may blend the barium lines of interest. An example of the NLTE synthetic profiles fitted to observed profiles is shown in Fig. 1.
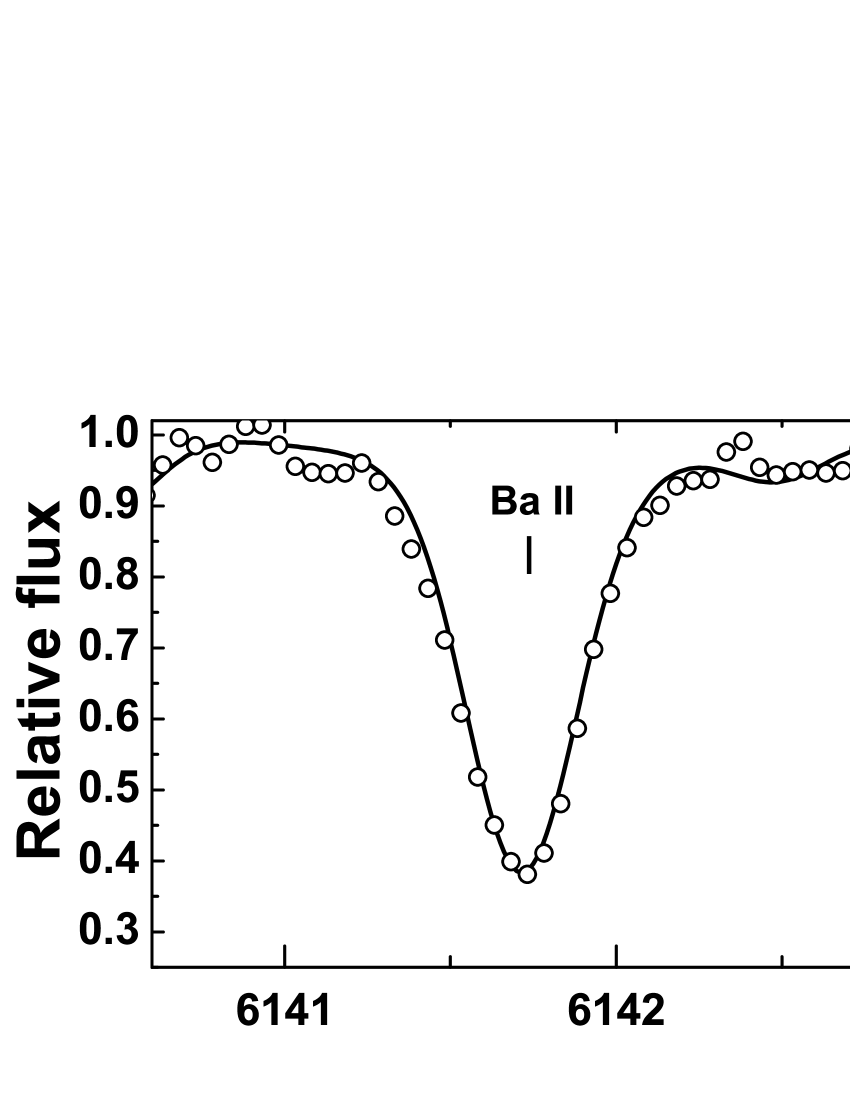
Table 1 contains information about barium line parameters used in our calculations.
| Ion | (Å) | hfs | log gf |
|---|---|---|---|
| , mÅ | |||
| Ba II | 6141.71 | - | –0.08 |
| Ba II | 6496.90 | 0 | –0.46 |
| Ba II | –4 | –1.32 | |
| Ba II | 8 | –1.55 |
3 Results and discussion
It is generally accepted that barium nuclei are produced in the -process at early stages of Galactic evolution and later in the -process in lower mass AGB stars along with even heavier -process elements (e.g., Busso et al., 1999). Among other factors, the efficiency of barium nuclei production also depends on the metallicity of AGB stars. Metal-poor AGB stars produce a larger amount of second -process peak nuclei. An increased ratio [Ba/Fe] in an external galaxy can either be a sign of the peculiar efficiency of barium production by AGB stars of that stellar system or the existence of an additional source of heavy -process nuclei.
Letarte et al. (2010) performed the LTE determination of the barium abundance in Fornax galaxy. For the program stars in the metallicity range from approximately –1 to –0.5, these authors obtained a remarkably high barium abundance when compared with, for example, the Milky Way data, i.e., [Ba/Fe] = +0.62 (see their Fig. 14). Later, Lemasle et al. (2014) added 47 Fornax red giant branch stars to their analysis. New data on barium abundance from Lemasle et al. (2014) gave the mean [Ba/Fe] value +0.37 . In their Fig. 15 these authors also plotted reconsidered barium abundance data from Letarte et al. (2010) and, after reconsidering, gave almost the same mean barium abundance value. Our mean barium abundance in this metallicity domain is +0.13 , which is much lower than reported before by the above-mentioned authors.
In Fig. 2 we present our individual barium abundances in Fornax stars graphically together with Letarte et al. (2010), Lemasle et al. (2014), and the Milky Way data, indicating the positions of the stars from thin and thick disks and also the Galactic halo. Such a comparison can be affected by intrinsic offsets since the Milky Way barium abundance data were derived in LTE, while we show the NLTE results for our program stars. Nevertheless, the NLTE corrections for the barium abundance at this metallicity, temperature, and gravity regime are very small (see Korotin et al., 2015), and thus, one can note that [Ba/Fe] ratios in our Fornax program stars are close to typical values for the Milky Way stars in the above-mentioned metallicity region.
In Fig. 2 we also plotted the theoretical model prediction for the Milky Way provided by Bisterzo et al. (2017). Theoretical curves for the thin and thick disk stars in the Galaxy describe positions for our Fornax stars very well.


4 Conclusions
We derived barium abundance for a sample of giant stars from the central part of the dSp Fornax galaxy. The barium abundance in 81 program stars was determined using the sophisticated NLTE approximation. Previous determinations (Letarte et al. 2010 and Lemasle et al. 2014) have led to the conclusion that barium abundances are enhanced in these stars. According to Reddy & Lambert (2017), the enhanced barium abundance often reported for solar twins, stellar associations, and open cluster stars at young ages is unrelated to stellar nucleosynthesis peculiarities, but on the contrary it results from an overestimation of barium abundance obtained through standard methods of LTE abundance analysis. Our NLTE spectroscopic analysis reveals that our program stars from the central part of the dSph Fornax galaxy do not display significantly increased barium abundances compared to the Milky Way stars. This may indicate that no special mechanism is required to explain the high LTE barium abundance in the Fornax galaxy found in previous studies. In this sense, the evolution of barium abundance in the dSph Fornax galaxy resembles its evolution in the Milky Way at the epoch of the corresponding metallicity level.
Acknowledgements.
We are thankful to Dr. Sara Bisterzo for her kind help with theoretical modeling data. SMA is thankful to the Universite Côte d’Azur, Observatoire de la Côte d’Azur, CNRS, Laboratoire Lagrange administration for their hospitality and financial support during his visit in 2016, and also for the partial financial support from the SCOPES grant No. IZ73Z0-152485, which is also acknowledged by SAK. We also thankful to the referee for many valuable comments that improved our paper.References
- Andrievsky et al. (2009) Andrievsky S.M., Spite M., Korotin S.A., Spite F., Francois P., Bonifacio P., Cayrel R., Hill V., 2009, A&A, 494, 1083
- Battistini & Bensby (2016) Battistini C., Bensby T., 2016, A&A, 586, A49
- Bisterzo et al. (2017) Bisterzo S., Travaglio C., Wiescher M., Käppeler F., Gallino R., 2017, ApJ, 835, 97
- Busso et al. (1999) Busso, M., Gallino, R., & Wasserburg, G. J. 1999, ARA&A, 37, 239
- Carollo et al. (2007) Carollo D., Beers T.C., Lee Y.S., Chiba M., Norris J.E., Wilhelm R., Sivarani T., Marsteller B., Munn J.A., Bailer-Jones C.A.L., Re Fiorentin P., York D.G., 2007, Natur. 450, 1020
- Eggen et al. (1962) Eggen O., Lynden-Bell D., Sandage A. R., 1962, ApJ 136, 748
- Geisler et al. (2007) Geisler D., Wallerstein G., Smith V.V., Casetti-Dinescu D.I., 2007, PASP, 119, 939
- Korotin et al. (2015) Korotin S.A., Andrievsky S.M., Hansen C.J., Caffau E., Bonifacio P., Spite M., Spite F., Fran cois P., 2015, A&A, 581, 70
- Kupka et al. (1999) Kupka, F., Piskunov, N., Ryabchikova, T. et al. 1999, A&AS, 138, 119
- Lemasle et al. (2014) Lemasle B., de Boer T.J.L. , Hill V., Tolstoy E., Irwin M.J., Jablonka P., Venn K., Battaglia G., Starkenburg E , Shetrone M., Letarte B., Fran cois P., Helmi A., Primas F., Kaufer A., Szeifert T., 2014, A&A, 572, A88
- Letarte et al. (2010) Letarte B., Hill V., Tolstoy E., Jablonka P., Shetrone M., Venn K.A., Spite M., Irwin M.J., Battaglia G., Helmi A., Primas F., Fran cois P., Kaufer A., Szeifert T., Arimoto N., Sadakane K., 2010, A&A, 523, A17
- Matteucci (2014) Matteucci F., 2014, SAAS, 37, 145
- Piskunov et al. (1996) Piskunov N. E., Kupka F., Ryabchikova T.A., Weiss W.W., Jeffery C.S., 1995, A&AS 112, 525
- Prantzos et al. (1990) Prantzos N., Hashimoto M., Nomoto K., 1990, A&A, 234, 211
- Raiteri et al. (1992) Raiteri C.M., Gallino R., Busso M., 1992, ApJ, 387, 263
- Reddy et al. (2003) Reddy B.E., Tomkin J., Lambert D.L., Allende Prieto C., 2003, MNRAS, 340, 304
- Reddy & Lambert (2017) Reddy A.B.S. & Lambert D.L., 2017, ApJ, 845, 151
- Searle (1977) Searle L., 1977, Egsp. conf., 219
- Tsymbal (1996) Tsymbal V.V., 1996, Model Atmospheres and Spectrum Synthesis, ed. S. J. Adelman, F. Kupka, & W. W. Weiss, San Francisco, ASP Conf. Ser., 108
- Venn et al. (2004) Venn K.A., Irwin M., Shetrone M.D., Tout C.A., Hill V., Tolstoy E., 2004, ApJ, 128, 1177
Appendix A Program stars, their metallicity, and abundances of Ba.
| Star | [Fe/H] | (Ba/H) | [Ba/Fe] | Star | [Fe/H] | (Ba/H) | [Ba/Fe] |
|---|---|---|---|---|---|---|---|
| BL038 | –0.88 | 1.32 | 0.03 | BL185 | –0.71 | 1.67 | 0.21 |
| BL045 | –1.09 | 0.79 | –0.29 | BL190 | –0.79 | 1.28 | –0.10 |
| BL052 | –1.02 | 1.06 | –0.09 | BL195 | –0.97 | 1.16 | –0.04 |
| BL065 | –1.43 | 0.72 | –0.02 | BL196 | –1.07 | 1.17 | 0.07 |
| BL076 | –0.85 | 1.43 | 0.11 | BL197 | –0.89 | 1.33 | 0.05 |
| BL077 | –0.79 | 1.43 | 0.05 | BL203 | –0.83 | 1.37 | 0.03 |
| BL079 | –0.52 | 1.94 | 0.29 | BL204 | –1.00 | 1.17 | 0.00 |
| BL081 | –0.62 | 1.88 | 0.33 | BL205 | –0.69 | 1.78 | 0.30 |
| BL084 | –0.85 | 1.44 | 0.12 | BL208 | –0.66 | 1.82 | 0.31 |
| BL085 | –2.59 | –0.50 | –0.08 | BL210 | –0.76 | 1.67 | 0.26 |
| BL091 | –0.96 | 1.25 | 0.04 | BL211 | –0.67 | 1.76 | 0.26 |
| BL092 | –0.95 | 1.25 | 0.03 | BL213 | –0.93 | 1.41 | 0.17 |
| BL096 | –0.75 | 1.42 | 0.00 | BL216 | –0.77 | 1.66 | 0.26 |
| BL097 | –0.92 | 1.41 | 0.16 | BL218 | –0.60 | 1.79 | 0.22 |
| BL100 | –0.93 | 1.09 | –0.15 | BL221 | –0.86 | 1.53 | 0.22 |
| BL104 | –0.96 | 1.29 | 0.08 | BL227 | –0.91 | 1.56 | 0.30 |
| BL113 | –0.75 | 1.59 | 0.17 | BL228 | –0.88 | 1.05 | –0.24 |
| BL115 | –1.47 | 0.50 | –0.20 | BL229 | –0.71 | 1.68 | 0.22 |
| BL123 | –0.97 | 1.20 | 0.00 | BL233 | –0.68 | 1.73 | 0.24 |
| BL125 | –0.73 | 1.62 | 0.18 | BL239 | –0.91 | 1.37 | 0.11 |
| BL132 | –0.89 | 1.21 | –0.07 | BL242 | –1.11 | 1.09 | 0.03 |
| BL135 | –0.95 | 1.43 | 0.21 | BL247 | –0.82 | 1.31 | –0.04 |
| BL138 | –1.01 | 1.28 | 0.12 | BL250 | –0.68 | 1.92 | 0.43 |
| BL140 | –0.87 | 1.44 | 0.14 | BL253 | –0.73 | 1.74 | 0.30 |
| BL141 | –0.82 | 1.31 | –0.04 | BL257 | –0.58 | 1.85 | 0.26 |
| BL146 | –0.92 | 1.35 | 0.10 | BL258 | –0.60 | 1.94 | 0.37 |
| BL147 | –1.37 | 1.34 | 0.54 | BL260 | –0.87 | 1.17 | –0.13 |
| BL148 | –0.63 | 1.70 | 0.16 | BL261 | –0.86 | 1.27 | –0.04 |
| BL149 | –0.91 | 1.34 | 0.08 | BL262 | –0.78 | 1.43 | 0.04 |
| BL150 | –0.83 | 1.24 | –0.10 | BL266 | –1.44 | 0.52 | –0.21 |
| BL151 | –0.86 | 1.41 | 0.10 | BL267 | –0.72 | 1.51 | 0.06 |
| BL155 | –0.75 | 1.72 | 0.30 | BL269 | –0.81 | 1.59 | 0.23 |
| BL156 | –1.13 | 1.04 | 0.00 | BL278 | –0.73 | 1.82 | 0.38 |
| BL158 | –0.87 | 1.56 | 0.26 | BL279 | –1.51 | 0.62 | –0.04 |
| BL160 | –0.95 | 1.31 | 0.09 | BL295 | –0.69 | 1.92 | 0.44 |
| BL163 | –0.77 | 1.80 | 0.40 | BL300 | –0.92 | 1.81 | 0.56 |
| BL166 | –0.89 | 1.44 | 0.16 | BL304 | –0.96 | 1.27 | 0.06 |
| BL168 | –0.88 | 1.44 | 0.15 | BL311 | –0.78 | 1.44 | 0.05 |
| BL171 | –0.90 | 1.33 | 0.06 | BL315 | –0.82 | 1.47 | 0.12 |
| BL173 | –0.85 | 1.33 | 0.01 | BL323 | –0.91 | 1.22 | –0.04 |
| BL180 | –0.91 | 1.79 | 0.53 |