Computational Analysis of the structural properties of Economic and Financial Networks
Abstract
In recent years, methods from network science are gaining rapidly interest in economics and finance. A reason for this is that in a globalized world the interconnectedness among economic and financial entities are crucial to understand and networks provide a natural framework for representing and studying such systems. In this paper, we are surveying the use of networks and network-based methods for studying economy related questions. We start with a brief overview of graph theory and basic definitions. Then we discuss descriptive network measures and network complexity measures for quantifying structural properties of economic networks. Finally, we discuss different network and tree structures as relevant for applications.
Frank Emmert-Streib, Aliyu Musa, Kestutis Baltakys, Juho Kanniainen, Shailesh Tripathi, Olli Yli-Harja, Herbert Jodlbauer and Matthias Dehmer
Predictive Medicine and Data Analytics Lab, Department of Signal Processing, Tampere University of Technology, Finland
*Corresponding author: v@bio-complexity.com
Institute of Biosciences and Medical Technology, Tampere, Finland
Industrial and Information Management, Tampere University of Technology, Tampere, Finland
Institute for Systems Biology, Seattle, USA
Institute for Intelligent Production, Faculty for Management, University of Applied Sciences Upper Austria, Steyr Campus, Austria
Department for Biomedical Computer Science and Mechatronics, UMIT - The Health and Lifesciences University, Hall in Tyrol, Austria
College of Computer and Control Engineering, Nankai University, Tianjin 300350, P. R. China
1 Introduction
In economics there is an increasing interest in recent years to investigate financial, economic, production and investment markets by means of networks. One reason for this interest is that a network, also called a graph, allows the convenient mathematical representation and analysis of a system with many interacting entities. This flexibility is wide enough to accommodate all different types of economic networks existing, e.g., interbank networks, investment networks, director networks, ownership networks, financial networks, product networks and trade networks [86, 8, 26, 42, 123, 141, 119, 49].
Despite the fact that the study of graphs and networks going back to Euler and Cayley [62, 34] with a formalization of the theory, by König in the 1930’s [99] and many interdisciplinary applications in mathematics [30, 51, 59, 81], computer science [39, 63], physics [81], biology [94, 117, 121, 54] and sociology [80, 126, 144], has a long lasting tradition the study of economic networks is lacking behind these other fields. One reason for this might be the difficulty in construction economic networks. For instance, while it is relatively easy to observe the acquaintanceships among a group of people or the molecular composition of chemicals leading to social and chemical networks the effect of one stock on another for constructing a financial network is considerably more difficult to infer requiring an appropriate statistical method and a dataset allowing to accomplish this. Fortunately, technological progress and the emergence of our digital society allow nowadays to tackle this problem.
Before we start with our review we want to mention a couple of possible applications. According to Hopp and Spearman [87] a production system is a network of interacting parts where managing the interactions is as - or even more - important, than managing individual processes and entities. Graph theory is a powerful approach to model these interactions.
Historically, well-known methods are the program evaluation and review technique (PERT), developed by Kelly and Walker for the US Navy, and the critical path method (CPM) developed by Booz, Allen and Hamilton [95]. Both methods help managers to schedule, monitor and control large as well as complex projects. In operations several complex projects may occur: optimal resource allocation for different flight rates of a space shuttle [85] or shutdown management and scheduling maintenance [122], to name only two. In [83, 118, 93, 111] a good survey of the resource-constrained project scheduling problem is given.
Similar to project schedules in manufacturing, graphs can be used to describe complex precedence constraints and production schedules [118, 93]. The broadly used Gantt charts in production planning have an equivalent graph representation. For flow shops with unlimited intermediate storage as well as limited intermediate storage a directed graph can be applied for the computation of different objectives like makespan, tardiness or number of tardy jobs. For job shop disjunctive graphs or bipartite graphs are suitable to model the minimization of the completion time. Assemble line balancing is a specific problem in production planning. Kilbridge and Wester developed a heuristic diagram of work elements based on precedence [96].
Network Location models [7] support the task to locate one or more new facilities in an existing network in order to minimize multi-objectives for instance some function of distance separating the new and existing facilities. Systematic Layout planning tries to find an optimal plant layout between technological limitations, organizational policies, safety considerations, space requirements, availability and product and process constraints by finding a maximally planar weighted graph [111].
The purpose of this paper is to generate more awareness about the potential of a structural analysis of economic networks by reviewing approaches from graph theory and network science. We start in Section (2) by providing necessary preliminaries from graph theory. In Section (3), we review local and global descriptive network measures and in Section 4 we discuss measures that quantify the structural complexity of networks. Section 5 gives an overview of important network and tree classes as useful for the study of economic networks. This article finishes in Section (6) and (7) with a discussion of potential future directions and conclusions.
2 Setting the framework from graph theory
Before we can begin surveying analysis methods of economic networks we need to provide the necessary preliminaries from graph theory. We start with basic definitions for undirected and directed graphs [11, 82].
Definition 2.1
The pair where represents a finite set of vertices and the set of edges, is called a finite undirected graph.
Throughout the paper, we set the cardinality of the vertex set . The cardinality of the edge set is denoted by . In the following, we write and instead of and when it is necessary to emphasize that we refer to a specific graph .
Definition 2.2
denotes the set of undirected graphs having vertices.
Definition 2.3
The pair where represents a finite set of vertices and the set of edges, , is called a finite directed graph.
We emphasize that in this paper, we are only considering graphs with a finite vertex set. Hence, their edge set is also finite. For this reason, those graphs are called finite graphs [82]. In contrast, infinite graphs possess a both infinite vertex set and an infinite edge set. They have been investigated, e.g., when studying growth models for the world wide web, birth and death processes, random graph models, or to investigate mathematical symmetry by using Cayley graphs [21, 36, 82, 61].
We remark if is allowed to have loops (reflexive edges) and parallel edges, then is called a multigraph [72, 82]. In contrast, hypergraphs [18] are generalizations of the ordinary notation of a graph, we just introduced. Specifically, for an ordinary graph (see Def. (2.1, (2.3)), an edge connects exactly two vertices whereas a hyperedge can connect any number of vertices, see [18]. Graphs which possess directed hyperedges are called directed hypergraphs and have been defined in [69].
A very important graph class are labeled graphs [82]. For instance, they have been used to model complex structures in various scientific disciplines like biology [65, 66, 127], chemistry [48, 137], sociology [144], and mathematical psychology [134, 133].
Definition 2.4
Let
| (1) |
and
| (2) |
be unique (finite) vertex and edge alphabets, respectively. and are the corresponding edge and vertex labeling functions.
| (3) |
is called a finite, labeled graph.
For representing a graph or a network practically, the so-called adjacency matrix can be used [82].
Definition 2.5
The adjacency matrix of a finite graph is defined by
| (4) |
In Fig. 1 we show an example for an adjacency matrix of an undirected network shown on the right hand side. This this case the matrix is symmetric.
Definition 2.6
The spectrum of consists of the sets and where denotes the multiplicity of the zero of the equation , the characteristic polynomial of where is its adjacency matrix and is the unit matrix.
Examples for eigenvalue-based models that have been applied in the context of economic networks can be found in [100].
3 Descriptive Network Measures
In the following sections we present quantitative network measures allowing to perform a descriptive network analysis. Many of the measures have their origin in the social sciences, chemistry or information sciences [5, 22, 23, 144]. If not stated otherwise, we are assuming that the networks have undirected edges.
3.1 Node Degree and Degree distribution
The degree of a vertex is the number of edges which are incident with vertex given by
| (5) |
From this the degree distribution [25, 106] is obtained by
| (6) |
where denotes the number of vertices in the network having a degree of and is the total number of nodes. Eqn. (6) corresponds to the proportion of vertices in having a degree of . Formally, can be written as,
| (7) |
where is the indicator function giving for a true argument and otherwise. Another meaning of Eqn. (6) is that a randomly chosen vertex in the network has a probability of to be linked with other vertices.
It was an interesting and important finding that many real world networks like the World Wide Web (WWW), the Internet, social networks, citation networks or food webs [2, 25, 29] are not Poison distributed like random networks (see Sec. 5.1 for a detailed discussion of random networks) but follow a power law distribution, i.e.,
| (8) |
In contrast to the above measures characterizing properties of individual nodes, there are also measures for characterizing the whole network. For instance, the average degree for the entire network is:
| (9) |
Finally, the edge density of is defined by
| (10) |
Here the denominator gives the total number of possible edges for a network with nodes, which corresponds to a fully connected network. Further network statistics and advanced aspects can be found in, e.g., [31, 132].
3.2 Clustering coefficient
The clustering coefficient is a local measure [145] defined for every vertex . For an undirected network it is defined by
| (11) |
where is the number of neighbors of vertex and is the number of adjacent pairs between all neighbors of [145]. In Fig. 2 we show an example.
3.3 Path-based measures
The next type of measures involve more than one node for their calculation, instead, they are based on the path between nodes [31, 32, 78, 132].
Let be a connected graph and
| (12) |
be the distance matrix, where denotes the distance (length of a shortest path) between the nodes and . From this the average distance of a network follows by
| (13) |
Additional graph metrics [132] based on the distance matrix are
| (14) |
| (15) |
and
| (16) |
The above entity is called the eccentricity of , is the diameter of , and is the radius of the graph.
3.4 Network Centrality Measures: Identifying important nodes
There is a large family of measures called centrality measures [67] that have their origin in the social sciences [74, 144]. The goal of these measures has been to identify nodes in a networks that are important in terms of communication.
Conceptually, one distinguishes between two fundamentally different types of centrality measures [67, 68]. The first type is called point centrality measures and the second graph centrality measures. The difference is that the former characterize local properties of a graph whereas the latter ones characterize global properties.
For an undirected graph , the degree centrality of a vertex is defined as its degree, i.e.,
| (17) |
The next measure is called betweenness centrality,
| (18) |
is based on distances, see, e.g., [67, 124, 126]. Here stands for the number of shortest paths from to and for the number of shortest paths from to that include . Thus, the quantity
| (19) |
can be interpreted as the probability that lies on a shortest path connecting with . Consequently, determines the appearance of on all shortest paths in the corresponding network. In Fig. 3 we show a visualization of .
Another well-known measure is the centrality index called closeness,
| (20) |
denotes the number of edges on a shortest path between and . In case there are multiple shortest paths connecting with , remains unchanged. Note that can be used to evaluate how close is a vertex to other vertices in a given network.
The previously mentioned measures are local centrality measures because they determine the centrality of a single vertex within a network. In contrast, we now present the definition of a global measure called graph centrality. Here, the crucial idea is to use these individual measures to obtain an average characteristic for the whole network:
| (21) |
denotes any of the three point (local) centrality measures:
| (22) |
is the maximum of determined for the given network and denotes the maximal value possible for (see Definition (2.2)),
| (23) |
As special graph centrality measures, we obtain exemplarily [29, 67, 144],
| (24) |
| (25) |
and
| (26) |
Further details and applications of these measures can be found in [29, 67, 144].
Aside from the measures presented so far, which are classic centrality measures there are several extended measures. For instance, Bonacich [24] introduced the eigenvector centrality,
| (27) |
The idea of this measure is to express that an important vertex is connected to important neighbors. For calculating , one needs to determine the eigenvector of the underlying adjacency matrix of a graph corresponding to the largest eigenvalue. Let’s assume denotes this largest eigenvalue and the corresponding eigenvector. It is important to note that is a point centrality measure because each vertex in the network obtains a value corresponding to the component of . Further eigenvector centrality measures have been investigated in [101].
A conceptual extension of betweenness centrality [131] has been provided by joint betweenness centrality (JBC) [56]. JBC is a non-local measure because it quantifies the number of paths that flow through pairs of nodes in a network. This centrality measure is defined by
| (28) |
JBC is evaluating the joint occurrence of two vertices on shortest communication paths in the network. Here gives the number of shortest paths connecting with and gives the number of shortest paths connecting with that contain the vertices and . In Fig. 4 we show a visualization of the joint betweenness centrality measure. Further application examples of betweenness centrality and other variants in the context of economy can be found in Shuja [131].
For the general application of centrality measures normalizations have been found to be useful. For instance, the analysis in [56] used the following normalization,
| (29) |
where
| (30) |
Examples of economic networks that have been analyzed by applying network centrality measures are prevalent. For instance, network centrality measures have been studied to identify systemically important financial institutions of the Turkish interbank market [102]. Specifically, the authors investigated the main borrower role of Demirbank in the crash of the banking system in 2000. A similar study of interbank networks can be found in [136] where data from the e-MID market in the Euro Area and US have been analyzed. Another study using centrality measures can be found in [130]. Their study aimed to identify core economic sectors of countries worldwide providing a linkage between financial networks and the underlying economic fundamentals. For their analysis they utilized eigenvector centrality. For further application examples to economic networks please see [71, 76, 140].
4 Network Complexity
In contrast to the quantitative measures discussed so far, network complexity measures, which will be discussed in this section, evaluate the network as a whole. Here the term complexity is in general broadly defined but refers often to the well-known Kolmogorov complexity [98, 103]. The underlying idea of network complexity measures is to assess the structural complexity as expressed by the intricate linking or branching structure of a graph.
In general, economic networks can be represented by undirected or directed networks. However, both types are topological networks which are amenable to a structural analysis in form of network complexity. The network complexity measures we are going to discuss in this section are quantitative measures. That means, an economic network will be mapped to a real number for determining the complexity thereof. This value can be seen as an index characterizing the network.
4.1 Network Complexity based on Information Theory
An important class of network complexity measures that is of relevance for practical applications is based on information theory. Information-theoretic complexity measures have been applied to many scientific areas such as biology, computer science or chemistry [22, 52, 45, 107]. In the following we review some of the most important measures from this area.
We start with a network , where is a graph invariant, and is an equivalence criterion. This leads to distributions like [22]:
| (31) |
The first row stands for the equivalency classes and the second row are the cardinalities of the obtained partitions. From this we calculate probabilities by , for each partition corresponding to the third row of the matrix. That means represents a probability distribution of . By using the well-known Shannon-entropy [129], one obtains
| (32) | ||||
| (33) |
Eqn. (32) stands for the so-called total information content of whereas Eqn. (33) is the mean information content. That means, once we have a given economic network, these two measures can be computed straight forward.
Another method to determine the entropy of econmic networks is due to Dehmer [44]. Instead of determining partitions by using a graph invariant , we assign a probability value to each vertex of a network. We do this by using an information functional that captures structural information of . So, if we apply Shannons-entropy again, we obtain
| (34) |
Once we choose concrete information functionals, we obtain concrete graph entropy measures. Examples are information functions based on metrical properties of graphs namely [44, 47]:
| (35) |
Note that the parameters can be used to weight structural characteristics or differences of in each sphere. They need to be chosen such that they are all different, e.g., , see [45]. Its evident that the choice of the has an impact on the resulting measured value. For special economic networks posssing special topological properties like pathness or a large number of cycles, these parameters could be learned systematically. When applying graph entropy measures to hierarchical economic networks representing hierarchical business group graphs, Altomonte and Rungi [6] generalized the work of [53]. They defined a new measure called ’Group Index of Complexity’ (GIC) which is given by
| (36) |
Here is the number of hierarchy levels, is the number of affiliates on hierarchical level and is the total number of affiliates in that network. Altomonte and Rungi [6] found a negative correlation between a vertical integration and the hierarchical complexity of business groups. Further, they also determined a positive correlation between the hierarchical complexity of a business group and their productivity.
The last contribution we mention in this section is due to Bekiros et al. [17]. They used information-theoretic quantities to measure the centrality of economic networks. An important result of [17] is that the authors proved evidence of the disparity of correlation and entropy-based centrality measurements for all markets between pre- and post-crisis periods.
5 Different types of Networks and Trees
Networks models in general have been useful for many reasons. In fact, networks enable an immediate visualization of complex interrelations among important players of a system under consideration. Also, networks constitute a mathematical representation which can be analyzed rigorously. We start this section by discussing important network classes.
5.1 Random Networks
Random networks are the first type of networks we have been studied extensively. For instance, the seminal work of Erdös and Rényi [59, 60] started this development. Putting it simply, a random graph with vertices can be obtained by connecting every pair of vertices with a probability of . The expected number of edges for a (undirected) network constructed this way is
| (37) |
The degree distribution of a vertex in a random network follows a binomial
| (38) |
because the maximal degree of vertex is at most , the probability that the vertex has edges is and there are possibilities to choose edges from vertices. By going to the limit , Eqn. (38) gives
| (39) |
Here is the expected number of edges for a vertex. That means for large , the degree distribution of a vertex in a random network can be approximated by the Poison distribution. For this reason random networks are also called Poison random networks [113].
Further one can show that the degree distribution of a random network (instead of just a vertex) follows also approximately a Poison distribution
| (40) |
It can be interpreted as there are vertices in the network that possess degree [4].
For random networks the clustering coefficient of a vertex , see Eqn. (11), assumes a very simple value. Specifically, because the average degree of a vertex can be approximated by , it follows
| (41) |
5.2 Trees
A simple but non-trivial network is a tree. [82]. In general, a tree is connected and ayclic [82]. We state a theorem showing that a tree can be characterized by various properties, see [88].
Theorem 5.1
Let be a graph having vertices. Then, the following assertions are equivalent:
-
1.
is a tree.
-
2.
Every two vertices of are connected by a unique path.
-
3.
is connected, but for every edge is disconnected.
-
4.
is connected and has exactly edges.
-
5.
is cycle free and has exactly edges.
-
6.
is cycle free, but for every two non-adjacent vertices , , contains exactly one cycle.
In Fig. (5) we show an example for an ordinary rooted tree. This ordinary rooted tree represents the relations between the directorates of firms. Specifically, a connection indicates that two company boards are having some common directors that serve on both boards. Due to the fact that such a relation does not imply a natural direction, the connections are undirected. This view allows easily to identify the distance between two directorates of two firms.
In contrast, in Fig. (6) we show an example of trees connecting stocks. We want to emphasize that a tree does not possess a hierarchy that means, there is no ‘top’ or ‘bottom’ in the graph of a tree. For this reason the trees shown in Fig. (6) can be rearranged arbitrarily. In contrast, rooted trees have a root that is a distinct vertex where all paths point away from it [82].
5.3 Generalized trees
In this section, we introduce an important extension of trees called generalized trees (GTs) [43, 109]. Here we only introduce undirected generalized trees. The idea of introducing directed generalized trees have firstly been raised in [108]. When introducing generalized trees, we claim that they are hierarchical and they possess a distinct vertex called root usually present in ordinary rooted trees. Besides the edges of an ordinary rooted tree, a GT has more edge types and this leads a richer connectivity among vertices.
Definition 5.1 (Generalized Tree)
A generalized tree is defined by a vertex set , an edge set , a level set and a multi-level function . The vertex and edge set define the adjacencies and the level set and the multi-level function induces a hierarchy between the vertices of . The index indicates the root.
The multi-level function is defined as follows.
Definition 5.2 (Multi-level function)
The function is called multi-level function with .
The multi-level function assigns to all vertices an element that corresponds to the level it will be assigned. The index refers to the root node, which is assigned to level . From these definitions it is immediately clear that a generalized tree is similar to a graph but additionally equipped with a level set and a multi-level function introducing a vertex grouping corresponding to the introduction of a hierarchy between vertices and sets thereof.
Definition 5.3 (Edge types)
A generalized tree has three edges types:
-
•
Edges with are called kernel edges ().
-
•
Edges with are called across edges ().
-
•
Edges with are called jump edges ().
Here .
Figure 7 shows a generalized tree. The edge types are highlighted by color; kernel edges forming the hierarchy are red, cross edges which do not overjump a level are green and jump edges are blue. Here it is important to emphasize that the two orange nodes representing two firms and are combined into one node representing a business group. That means the shown generalized tree has only one root node. Furthermore, we note that a generalized tree is a tree-like graph which may possess cycles [46]. However, a usual graph containing cycles is not hierarchical [82].
5.4 Bipartite networks
Another network structure that is important to represent economic networks is a bipartite network. A bipartite network consists of two types of nodes. Let’s call the first node type and the second node type . Edges can only occur between nodes of different type, i.e.,
| (42) |
In order to distinguish such a network one writes often . In the case of the network is called a balanced bipartite network. If the connections carry a weight, the graph is called a weighted bipartite network.
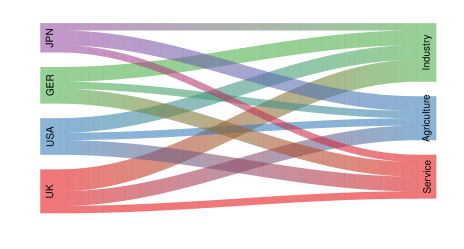
In Fig. 8 we show an example of a weighted bipartite network. This network connects four countries (UK, USA, GER and JPN) to three economic sectors (industry, agriculture and service). The width of the links is proportional to the strength of the corresponding economic sector. For instance, in this way one can express the contribution of different economic sectors to the GDP of a country or the number of people that are working in the corresponding fields.
We would like to note that there are many different graphical ways to visualize bipartite networks and in most cases, as seen in Fig. 8, the nodes of the bipartite networks are not shown as ’circles’, instead, the visualization is more artistic. Nevertheless, one should not forget that the underlying graph is defined in terms of graph theory with a strict meaning.
5.5 Complex network topologies
Toward the end of the 1990s two new types of networks have been added to the literature, namely small-world networks [145] and scale-free networks [4].
Specifically, Watts and Strogatz [145] found that networks, which have been generated according to some rules, have a high clustering coefficient, like regular networks, but also (in average) short distance among vertices, similar to random networks. Hence, these networks, which are called small-world networks, combine different features from different network classes. With respect to biological networks, small-world networks have been found in, e.g., coexpression, protein and metabolic networks [139, 142, 146].
An economic network with small-world characteristics is the directorate interlock network [41]. The authors study several hundred US firms and banks and thousands of directors on their board of directors during the 1980s and 1990s. They found that the director network where nodes correspond to directors and links correspond to common board positions of two directors is consistent with high clustering coefficients and low average path lengths.
Complementary to this, Barabási and Alber found that many real world networks show a scale-free behavior of the node degrees [4],
| (43) |
To explain this common feature Barabási and Albert introduced a model [12] now known as Barabási-Albert (BA) or preferential attachment model [113] that results in so called scale-free networks which have a degree distribution following a power law [12]. A major difference between the preferential attachment model and the other algorithms described above to generate random or small-world networks is that the BA model does not assume a fixed number of vertices and then rewires them iteratively with a fixed probability, but in this model grows. Each newly added vertex is connected with a certain probability (which is not constant) to other vertices already present in the network. This attachment probability,
| (44) |
is proportional to the degree, , of these vertices, explaining the name of the model. This way, each new vertex is added to existing vertices in the network.
6 Future directions and discussion
A natural prerequisite for any economic network analysis is the creation or inference of networks. For this reason, we think it would be useful to conduct some comparative analyses to identify the best method for different types of economic networks. In order to perform such analyses one would need to define what in this context ’best’ means. The problem is that in most cases the true economic network is not known. For instance, the true financial network of the NYSE connecting stocks is unknown. For this reason, one needs to define context-specific measures that allow, potentially in an indirect way, the assessment of the inferred network structure. In the case of financial networks this could be accomplished by utilizing financial networks in predictive forecasting models to estimate, e.g., future stock prices. That means one can compare predictive models taking the network structure into consideration vs. predictive models that do not. Better prediction results in the former case could indicate that the inferred financial network captures actually meaningful information that can be translated into beneficial forecasts.
As a further particular example we want to look at investor networks [104]. MacLeod [104] investigated social properties of stakeholders by using these networks. Also, they compared them with so-called advocacy networks of social activists. It’s worth mentioning that these network classes could be compared by comparative graph measures [55]. This would extent the work in [104] considerably as it leads to a thorough graph-theoretical treatment of this problem. Another example of analyzing investor networks by using quantitative network measures can be found in [116].
Research on networks in economics and finance has exploded for many reasons. Financial and economic systems are often complex and it is necessary to pay attention to the patterns of interactions to understand the behavior of systems and agents therein. Increasingly available data from various sources for different systems enables researchers to test and apply theories [92, 97, 116, 143, 75], but also conduct explanatory research [115, 114, 27, 89, 64, 138, 10] for better empirical understanding of financial and economic systems. At the same time, network research in economics and finance is quite fragmented. This research is not only fragmented in terms of research topics and applications, but also in terms of research approaches, academic disciplines and their journals.
In economics, there have been several application areas of networks, including network games [9, 28], labor markets [33, 16], international trade [120, 37] and social networks overall [110]. This type of research is typically published in well-established journals in economics, but especially research on international trade has also published in cross-disciplinary journals (see, for example [19, 91, 125]).
In finance, complex systems and networks offer potential for better analysis and monitoring of research in systemic risk in financial systems, and research on this topic has been published in both financial journals [1, 105, 84, 50, 20] and multi-disciplinary journals [77, 14, 38, 13]. As emphasized in [90], in the area of systemic risk, the gap between theory and applications still needs to be closed, which is important because in this area network theory can have an immediate as well as lasting impact. Secondly, research papers on networks in the financial markets have mainly been published in multi-disciplinary, complexity, and physics journals rather than in finance (see, for example, [115, 114, 58, 57, 15, 138, 112, 73]), though exceptions recent exist [79, 116, 3]. Network methods can be used to investigate investors joint behavior and interaction, and given that investor network structure is important for the stock price dynamics [143], it is quite surprising that finance journals have so slowly and marginally adopted network methods in the research of investor behavior.
In econophysics, papers are often data-driven and exploratory whereas papers published in finance journals rely on models, typically under the neoclassical economics paradigm of rational individual choice. The research questions and approaches can be very different between different journals, indeed, which can partially be explained by researchers’ different interests and backgrounds. Nevertheless, different research approaches (e.g. exploratory vs confirmatory research) can benefit from each other and one of the most important possibilities in network research in finance is to have actual interaction between research published in different journal categories, i.e. multidisciplinary journals, complexity, (econo)physics, and finance journals. Particularly, data-driven research can feed ’traditional’ finance research by raising observations that should be theoretically explained, and, on the other hand theoretical models should be carefully reflected and evaluated by large data sets with alternative methods used to use in non-financial journals. Also, there would be possibilities of using methods developed in exploratory research in financial modeling. For example, [138] provide a method to estimate links between investors and detect investor communities, which could be used to verify financial theories in the interaction of individual investors and information transformation. For example, as there is a theoretical relation between investor networks and volatility dynamics [143], methods developed to estimate links between investor [138, 10] could be used to produce state variables to be augmented into volatility models for better risk management and option pricing accuracy. Addressing this question requires experience on both network inference methods, which are typically published in multi-disciplinary journals (see, for example [138]), as well as established time-series models.
7 Conclusion
The purpose of this survey was to showcase the use of graph theoretic methods for studying economic problems. We hope this will help in making the study of economic networks more popular and accessible in the economics and finance literature because of the tremendous potential of such approaches for shedding light on our global, interconnected world.
8 Acknowledgments
Matthias Dehmer thanks the Austrian Science Funds for supporting this work (project P26142). JK received funding from the European Union Horizon 2020 research and innovation programme under the Marie Sklodowska-Curie grant agreement No 675044 “BigDataFinance”.
References
- [1] Daron Acemoglu, Asuman Ozdaglar, and Alireza Tahbaz-Salehi. Systemic risk and stability in financial networks. The american economic review, 105(2):564–608, 2015.
- [2] L. Adamic and B. Huberman. Power-law distribution of the world wide web. Science, 287:2115a, 2000.
- [3] Kenneth R Ahern. Information networks: Evidence from illegal insider trading tips. Journal of Financial Economics, 125(1):26–47, 2017.
- [4] R. Albert and A.L. Barabasi. Statistical mechanics of complex networks. Rev. of Modern Physics, 74:47, 2002.
- [5] E. B. Allen. Measuring graph abstractions of software: An information-theory approach. In Proceedings of the 8-th International Symposium on Software Metrics table of contents, page 182. IEEE Computer Society, 2002.
- [6] Carlo Altomonte and Armando Rungi. Business groups as hierarchies of firms: Determinants of vertical integration and performance. European Central Bank WP series, (N. 1554), 2013.
- [7] Saman Hassanzadeh Amin and Guoqing Zhang. A multi-objective facility location model for closed-loop supply chain network under uncertain demand and return. Applied Mathematical Modelling, 37(6):4165–4176, 2013.
- [8] J Arnold, ML Bech, WE Beyeler, RJ Glass, and K Soramäki. The topology of interbank payment flows. Federal Reserve Bank of New York, Staff Report, 243, 2006.
- [9] Coralio Ballester, Antoni Calvó-Armengol, and Yves Zenou. Who’s who in networks. wanted: The key player. Econometrica, 74(5):1403–1417, 2006.
- [10] Kestutis Baltakys, Juho Kanniainen, and Frank Emmert-Streib. Multilayer aggregation of investor trading networks. arXiv preprint arXiv:1708.09850, 2017.
- [11] J. Bang-Jensen and G. Gutin. Digraphs. Theory, Algorithms and Applications. Springer, London, Berlin, Heidelberg, 2002.
- [12] A. L. Barabási and R. Albert. Emergence of scaling in random networks. Science, 206:509–512, 1999.
- [13] Stefano Battiston, J Doyne Farmer, Andreas Flache, Diego Garlaschelli, Andrew G Haldane, Hans Heesterbeek, Cars Hommes, Carlo Jaeger, Robert May, and Marten Scheffer. Complexity theory and financial regulation. Science, 351(6275):818–819, 2016.
- [14] Stefano Battiston, Domenico Delli Gatti, Mauro Gallegati, Bruce Greenwald, and Joseph E Stiglitz. Liaisons dangereuses: Increasing connectivity, risk sharing, and systemic risk. Journal of Economic Dynamics and Control, 36(8):1121–1141, 2012.
- [15] Stefano Battiston, Michelangelo Puliga, Rahul Kaushik, Paolo Tasca, and Guido Caldarelli. Debtrank: Too central to fail? financial networks, the fed and systemic risk. Scientific reports, 2:srep00541, 2012.
- [16] Lori Beaman. Social networks and the labor market. In Andrea Galeotti Bramoullé, Yann and Brian Rogers, editors, The Oxford Handbook on the Economics of Networks, pages 649–674. Oxford University Press, 2016.
- [17] S. Bekiros, D. K. Nguyen, L. Sandoval Junior, and G. S. Uddin. Information diffusion, cluster formation and entropy-based network dynamics in equity and commodity markets. European Journal of Operational Research, 256(3):945 – 961, 2017.
- [18] C. Berge. Hypergraphs: Combinatorics of Finite Sets. North Holland, Amsterdam, 1989.
- [19] Kunal Bhattacharya, Gautam Mukherjee, Jari Saramäki, Kimmo Kaski, and Subhrangshu S Manna. The international trade network: weighted network analysis and modelling. Journal of Statistical Mechanics: Theory and Experiment, 2008(02):P02002, 2008.
- [20] Monica Billio, Mila Getmansky, Andrew W Lo, and Loriana Pelizzon. Econometric measures of connectedness and systemic risk in the finance and insurance sectors. Journal of Financial Economics, 104(3):535–559, 2012.
- [21] B. Bollabás. Modern Graph Theory. Graduate Texts in Mathematics. Springer, New York, 1998.
- [22] D. Bonchev. Information Theoretic Indices for Characterization of Chemical Structures. Research Studies Press, Chichester, 1983.
- [23] D. Bonchev and D. H. Rouvray. Complexity in Chemistry, Biology, and Ecology. Mathematical and Computational Chemistry. Springer, 2005. New York, NY, USA.
- [24] P. Bonacich. Factoring and weighting approaches to status scores and clique identification. Journal of Mathematical Sociology, 2:113–120, 1972.
- [25] S. Bornholdt and H. G. Schuster. Handbook of Graphs and Networks: From the Genome to the Internet. John Wiley & Sons, Inc., New York, NY, USA, 2003.
- [26] Michael Boss, Helmut Elsinger, Martin Summer, and Stefan Thurner 4. Network topology of the interbank market. Quantitative Finance, 4(6):677–684, 2004.
- [27] Michael Boss, Helmut Elsinger, Martin Summer, and Stefan Thurner 4. Network topology of the interbank market. Quantitative Finance, 4(6):677–684, 2004.
- [28] Yann Bramoullé and Rachel Kranton. Games played on networks. 2015.
- [29] U. Brandes and T. Erlebach. Network Analysis. Lecture Notes in Computer Science. Springer, Berlin Heidelberg New York, 2005.
- [30] A. Brandstädt, V. B. Le, and J. P. Sprinrand. Graph Classes. A Survey. SIAM Monographs on Discrete Mathematics and Applications, 1999.
- [31] M. Brinkmeier and T. Schank. Network statistics. In U. Brandes and T. Erlebach, editors, Network Analysis, Lecture Notes of Computer Science, pages 293–317. Springer, 2005.
- [32] F. Buckley and F. Harary. Distance in Graphs. Addison Wesley Publishing Company, 1990.
- [33] Antoni Calvó-Armengol and Matthew O Jackson. Networks in labor markets: Wage and employment dynamics and inequality. Journal of economic theory, 132(1):27–46, 2007.
- [34] A. Cayley. On the theory of analytic forms called trees. Philos. Mag., 13:19–30, 1857.
- [35] A. Cayley. On the analytical forms called trees, with application to the theory of chemical combinatorics. Report of the British Association for the Advancement of Science, pages 257–305, 1875.
- [36] S. Chakrabarti. Mining the Web: Discovering Knowledge from Hypertext Data. Morgan Kaufmann, San Francisco, 2002.
- [37] Thomas Chaney. Networks in international trade. In Andrea Galeotti Bramoullé, Yann and Brian Rogers, editors, The Oxford Handbook on the Economics of Networks, pages 754–775. Oxford University Press, 2016.
- [38] Giulio Cimini, Tiziano Squartini, Diego Garlaschelli, and Andrea Gabrielli. Systemic risk analysis on reconstructed economic and financial networks. Scientific reports, 5, 2015.
- [39] T.H. Cormen, C.E. Leiserson, R.L. Rivest, and C. Stein. Introduction to Algorithms. MIT Press, 2001.
- [40] D. M. Cvetkovic, M. Doob, and H. Sachs. Spectra of Graphs. Theory and Application. Academic Press, 1997.
- [41] Gerald F Davis, Mina Yoo, and Wayne E Baker. The small world of the american corporate elite, 1982-2001. Strategic organization, 1(3):301–326, 2003.
- [42] Hans Degryse and Grégory Nguyen. Interbank exposure: An empirical examination of systemic risk in the belgian banking system. ECONSTOR working papers, (43):62, 2004.
- [43] M. Dehmer. Strukturelle Analyse web-basierter Dokumente. Multimedia und Telekooperation. Deutscher Universitäts Verlag, Wiesbaden, 2006.
- [44] M. Dehmer. A novel method for measuring the structural information content of networks. Cybernetics and Systems, 39:825–843, 2008.
- [45] M. Dehmer and F. Emmert-Streib. Structural information content of networks: Graph entropy based on local vertex functionals. Comput. Biol. Chem., 32:131–138, 2008.
- [46] M. Dehmer, A. Mehler, and F. Emmert-Streib. Graph-theoretical characterizations of generalized trees. In Proceedings of the International Conference on Machine Learning: Models, Technologies & Applications (MLMTA’07), Las Vegas/USA, 2007, pages 113–117, 2007.
- [47] M. Dehmer, K. Varmuza, S. Borgert, and F. Emmert-Streib. On entropy-based molecular descriptors: Statistical analysis of real and synthetic chemical structures. J. Chem. Inf. Model., 49:1655–1663, 2009.
- [48] J. Devillers and A. T. Balaban. Topological Indices and Related Descriptors in QSAR and QSPR. Gordon and Breach Science Publishers, 1999. Amsterdam, The Netherlands.
- [49] Vasant Dhar, Tomer Geva, Gal Oestreicher-Singer, and Arun Sundararajan. Prediction in economic networks. Information Systems Research, 25(2):264–284, 2014.
- [50] Francis X Diebold and Kamil Yılmaz. On the network topology of variance decompositions: Measuring the connectedness of financial firms. Journal of Econometrics, 182(1):119–134, 2014.
- [51] R. Diestel. Graph Theory. Springer, Heidelberg, 2000.
- [52] F. Emmert-Streib and M. Dehmer. Information theoretic measures of UHG graphs with low computational complexity. Appl. Math. Comput., 190:1783–1794, 2007.
- [53] F. Emmert-Streib and M. Dehmer. Information theoretic measures of UHG graphs with low computational complexity. Applied Mathematics and Computation, 190(2):1783–1794, 2007.
- [54] F. Emmert-Streib and M. Dehmer. Analysis of Microarray Data: A Network-Based Approach. Wiley-VCH, 2008. Weinheim, Germany.
- [55] F. Emmert-Streib, M. Dehmer, and Y. Shi. Fifty Years of Graph Matching, Network Alignment and Network Comparison. Information Sciences, 346-347:180–197, 2016.
- [56] Frank Emmert-Streib, Lin Chen, and John Storey. Functional annotation of genes in saccharomyces cerevisiae based on joint betweenness. arXiv preprint arXiv:0709.3291, 2007.
- [57] Frank Emmert-Streib and Matthias Dehmer. Identifying critical financial networks of the djia: Toward a network-based index. Complexity, 16(1):24–33, 2010.
- [58] Frank Emmert-Streib and Matthias Dehmer. Influence of the time scale on the construction of financial networks. PloS one, 5(9):e12884, 2010.
- [59] P. Erdös and A. Rényi. On random graphs. I. Publicationes Mathematicae, 6:290–297, 1959.
- [60] P. Erdös and A. Rényi. On random graphs. Publ. Math. Inst. Hung. Acad. Sci., 5:17, 1960.
- [61] P. Erdös and P. Rényi. On the evolution of random graphs. Magyar Tud. Akad. Mat. Kutató Int. Közl, 5:17–61, 1960.
- [62] L. Euler. Solutio problematis ad geometriam situs pertinentis. Comment. Acad. Sci. U. Petrop., 8:128–140, 1736.
- [63] S. Even. Graph Algorithms. Computer Science Press, 1979.
- [64] Giorgio Fagiolo, Javier Reyes, and Stefano Schiavo. World-trade web: Topological properties, dynamics, and evolution. Physical Review E, 79(3):036115, 2009.
- [65] J. Felsenstein. Inferring Phylogenies. Sinauer Associates, Sunderland, Mass., 2003.
- [66] L. R. Foulds. Graph Theory Applications. Springer, 1992.
- [67] L. C. Freeman. A set of measures of centrality based on betweenness. Sociometry, 40, 1977.
- [68] L. C. Freeman. Centrality in social networks: Conceptual clarification. Social Networks, 1:215–239, 1979.
- [69] Giorgio Gallo, Giustino Longo, and Stefano Pallottino. Directed hypergraphs and applications. Discrete Applied Mathematics, 42(2):177–201, 1993.
- [70] Diego Garlaschelli, Stefano Battiston, Maurizio Castri, Vito DP Servedio, and Guido Caldarelli. The scale-free topology of market investments. Physica A: Statistical Mechanics and its Applications, 350(2):491–499, 2005.
- [71] Paolo Giudici and Alessandro Spelta. Graphical network models for international financial flows. Journal of Business & Economic Statistics, 34(1):128–138, 2016.
- [72] J. L. Gross and J. Yellen. Graph Theory and Its Applications, Second Edition. Discrete Mathematics and Its Applications. Chapman & Hall, Boca Raton, 2006.
- [73] Stanislao Gualdi, Giulio Cimini, Kevin Primicerio, Riccardo Di Clemente, and Damien Challet. Statistically validated network of portfolio overlaps and systemic risk. Scientific reports, 6:39467, 2016.
- [74] P. Hage and F. Harary. Eccentricity and centrality in networks. Social Networks, 17:57–63, 1995.
- [75] Björn Hagströmer and Albert J Menkveld. A network map of information percolation. Working paper, 2016.
- [76] Muhammad Mohsin Hakeem and Ken ichi Suzuki. Centrality measures for trade and investment networks. Australian Academy of Accounting and Finance Review, 1(2):103–118, 2017.
- [77] Andrew G Haldane and Robert M May. Systemic risk in banking ecosystems. Nature, 469(7330):351, 2011.
- [78] R. Halin. Graphentheorie. Akademie Verlag, 1989. Berlin, Germany.
- [79] Bing Han and Liyan Yang. Social networks, information acquisition, and asset prices. Management Science, 59(6):1444–1457, 2013.
- [80] F. Harary. Status and contrastatus. Sociometry, 22:23–43, 1959.
- [81] F. Harary. Graph theory and theoretical physics. Academic Press, London, UK, 1967.
- [82] F. Harary. Graph Theory. Addison Wesley Publishing Company, 1969. Reading, MA, USA.
- [83] Sönke Hartmann and Dirk Briskorn. A survey of variants and extensions of the resource-constrained project scheduling problem. European Journal of operational research, 207(1):1–14, 2010.
- [84] Nikolaus Hautsch, Julia Schaumburg, and Melanie Schienle. Financial network systemic risk contributions. Review of Finance, 19(2):685–738, 2014.
- [85] MD HEILEMAN, DG Linton, and S Khajenoori. Simulation study aids space-shuttle flight rate planning, 1992.
- [86] Yael V Hochberg, Alexander Ljungqvist, and Yang Lu. Whom you know matters: Venture capital networks and investment performance. The Journal of Finance, 62(1):251–301, 2007.
- [87] Wallace J Hopp and Mark L Spearman. Factory physics. Waveland Press, 2011.
- [88] T. Ihringer. Diskrete Mathematik. Teubner, Stuttgart, 1994.
- [89] Giulia Iori, Giulia De Masi, Ovidiu Vasile Precup, Giampaolo Gabbi, and Guido Caldarelli. A network analysis of the italian overnight money market. Journal of Economic Dynamics and Control, 32(1):259–278, 2008.
- [90] Matthew O. Jackson. The past and future of network analysis in economics. In Andrea Galeotti Bramoullé, Yann and Brian Rogers, editors, The Oxford Handbook on the Economics of Networks, pages 71–79. Oxford University Press, 2016.
- [91] Matthew O Jackson and Stephen Nei. Networks of military alliances, wars, and international trade. Proceedings of the National Academy of Sciences, 112(50):15277–15284, 2015.
- [92] Matthew O Jackson and Asher Wolinsky. A strategic model of social and economic networks. Journal of economic theory, 71(1):44–74, 1996.
- [93] Krzysztof Kalinowski, Cezary Grabowik, Wojciech M Kempa, and Iwona Paprocka. The graph representation of multivariant and complex processes for production scheduling. In Advanced Materials Research, volume 837, pages 422–427. Trans Tech Publ, 2014.
- [94] S.A. Kauffman. Metabolic stability and epigenesis in randomly constructed genetic nets. Journal of Theoretical Biology, 22:437–467, 1969.
- [95] James E Kelley Jr and Morgan R Walker. Critical-path planning and scheduling. In Papers presented at the December 1-3, 1959, eastern joint IRE-AIEE-ACM computer conference, pages 160–173. ACM, 1959.
- [96] Maurice D Kilbridge and Leon Wester. A heuristic method of assembly line balancing. Journal of Industrial Engineering, 12(4):292–298, 1961.
- [97] Alan Kirman. The economy as an evolving network. Journal of evolutionary economics, 7(4):339–353, 1997.
- [98] A. N. Kolmogorov. Three approaches to the quantitative definition of ‘information’. Problems of Information Transmission, 1:1–7, 1965.
- [99] D. König. Theorie der endlichen und unendlichen Graphen. Chelsea Publishing, 1936.
- [100] M.D. König and S. Battiston. From graph theory to models of economic networks. a tutorial. In A.K. Naimzada et al., editor, Networks, Topology and Dynamics, Lecture Notes in Economics and Mathematical Systems 613, pages 23–63, Berlin/New York, 2009. Springer.
- [101] D. Koschützki, K. A. Lehmann, L. Peters, S. Richter, D. Tenfelde-Podehl, and O. Zlotkowski. Clustering. In U. Brandes and T. Erlebach, editors, Centrality Indices, Lecture Notes of Computer Science, pages 16–61. Springer, 2005.
- [102] Tolga Umut Kuzuba?, Inci Omercikoglu, and Burak Saltoglu. Network centrality measures and systemic risk: An application to the turkish financial crisis. Physica A: Statistical Mechanics and its Applications, 405:203 – 215, 2014.
- [103] M. Li and P.M.B. Vitányi. An Introduction to Kolmogorov Complexity and Its Applications. Springer, 1997.
- [104] Michael R. MacLeod. Emerging investor networks and the construction of corporate social responsibility. The Journal of Corporate Citizenship, (34):69–98, 2009.
- [105] Sheri Markose, Simone Giansante, and Ali Rais Shaghaghi. ?too interconnected to fail?financial network of us cds market: Topological fragility and systemic risk. Journal of Economic Behavior & Organization, 83(3):627–646, 2012.
- [106] O. Mason and M. Verwoerd. Graph theory and networks in biology. IET Systems Biology, 1(2):89–119, 2007.
- [107] A. Mehler. A quantitative graph model of social ontologies by example of wikipedia. In A. Mehler, S. Sharoff, G. Rehm, and M. Santini, editors, Genres on the Web: Computational Models and Empirical Studies. Springer, 2009. to appear.
- [108] A. Mehler, M. Dehmer, and R. Gleim. Towards logical hypertext structure — A graph-theoretic perspective. In T. Böhme and G. Heyer, editors, Proceedings of the Fourth International Workshop on Innovative Internet Computing Systems (I2CS ’04), Lecture Notes in Computer Science 3473, pages 136–150, Berlin/New York, 2004. Springer.
- [109] A. Mehler, M. Dehmer, and R. Gleim. Towards logical hypertext structure. a graph-theoretic perspective. In Proceedings of I2CS’04, pages 136–150. Lecture Notes, Berlin - New York: Springer, 2005.
- [110] Sylvia A Morelli, Desmond C Ong, Rucha Makati, Matthew O Jackson, and Jamil Zaki. Empathy and well-being correlate with centrality in different social networks. Proceedings of the National Academy of Sciences, page 201702155, 2017.
- [111] Eiji Morinaga, Yutaro Shintome, Hidefumi Wakamatsu, and Eiji Arai. Facility layout planning with continuous representation considering temporal efficiency. Transactions of the Institute of Systems, Control and Information Engineers, 29(9):408–413, 2016.
- [112] Federico Musciotto, Luca Marotta, Salvatore Miccichè, Jyrki Piilo, and Rosario N Mantegna. Patterns of trading profiles at the nordic stock exchange. a correlation-based approach. Chaos, Solitons & Fractals, 88:267–278, 2016.
- [113] M. E. J. Newman. The structure and function of complex networks. SIAM Review, 45:167–256, 2003.
- [114] J-P Onnela, Anirban Chakraborti, Kimmo Kaski, and Janos Kertesz. Dynamic asset trees and black monday. Physica A: Statistical Mechanics and its Applications, 324(1):247–252, 2003.
- [115] J-P Onnela, Anirban Chakraborti, Kimmo Kaski, Janos Kertesz, and Antti Kanto. Dynamics of market correlations: Taxonomy and portfolio analysis. Physical Review E, 68(5):056110, 2003.
- [116] Han N. Ozsoylev, Johan Walden, M. Deniz Yavuz, and Recep Bildik. Investor networks in the stock market. The Review of Financial Studies, 27(5):1323–1366, 2014.
- [117] B.O. Palsson. Systems Biology. Cambridge University Press, Cambridge; New York, 2006.
- [118] Michael Pinedo. Scheduling. Springer, 2012.
- [119] Tian Qiu, Bo Zheng, and Guang Chen. Financial networks with static and dynamic thresholds. New Journal of Physics, 12(4):043057, 2010.
- [120] James E Rauch. Networks versus markets in international trade. Journal of international Economics, 48(1):7–35, 1999.
- [121] F. Roberts. Applications of Combinatorics and Graph Theory to the Biological and Social Sciences Series. IMA Volumes in Mathematics and its Applications. Springer, 1989.
- [122] Stephen M Roberts and Karen J Mask. Shutdown management-five years of learning. AACE International Transactions, 2:U–3, 1992.
- [123] Tarik Roukny, Co-Pierre Georg, and Stefano Battiston. A network analysis of the evolution of the german interbank market. Technical report, Discussion Paper, Deutsche Bundesbank, 2014.
- [124] G. Sabidussi. The centrality index of a graph. Psychometrika, 31:581–603, 1966.
- [125] Fabio Saracco, Riccardo Di Clemente, Andrea Gabrielli, and Tiziano Squartini. Detecting early signs of the 2007–2008 crisis in the world trade. Scientific reports, 6, 2016.
- [126] F. Scott. Social Network Analysis. Sage Publications, 2001.
- [127] C. Semple and M. Steel. Phylogenetics. Graduate Series Mathematics and its Applications. Oxford University Press, 2003.
- [128] Ma Angeles Serrano and Marián Boguná. Topology of the world trade web. Physical Review E, 68(1):015101, 2003.
- [129] C. E. Shannon and W. Weaver. The Mathematical Theory of Communication. University of Illinois Press, 1997. Urbana, IL, USA.
- [130] Kiran Sharma, Balagopal Gopalakrishnan, Anindya S Chakrabarti, and Anirban Chakraborti. Financial fluctuations anchored to economic fundamentals: A mesoscopic network approach. Scientific Reports, 7, 2017.
- [131] A. Shuja. Social and Economic Networks: An Investigation of Retailer Networks in Lahore & their Impact on Enterprise Performance. PhD thesis, Lahore School of Economics, 2016.
- [132] V. A. Skorobogatov and A. A. Dobrynin. Metrical analysis of graphs. Commun. Math. Comp. Chem., 23:105–155, 1988.
- [133] E. Sommerfeld. Kognitive Strukturen. Mathematisch-psychologische Elementaranalysen der Wissensstrukturierung und Informationsverarbeitung. Waxmann Publishing, 1994.
- [134] E. Sommerfeld and F. Sobik. Operations on cognitive structures - their modeling on the basis of graph theory. In D. Albert, editor, Knowledge Structures, pages 146–190. Springer, 1994.
- [135] Wataru Souma, Yoshi Fujiwara, and Hideaki Aoyama. Complex networks and economics. Physica A: Statistical Mechanics and its Applications, 324(1):396 – 401, 2003. Proceedings of the International Econophysics Conference.
- [136] Asena Temizsoy, Giulia Iori, and Gabriel Montes-Rojas. Network centrality and funding rates in the e-mid interbank market. Journal of Financial Stability, 2016.
- [137] N. Trinajstić. Chemical Graph Theory. CRC Press, 1992. Boca Raton, FL, USA.
- [138] Michele Tumminello, Fabrizio Lillo, Jyrki Piilo, and Rosario N Mantegna. Identification of clusters of investors from their real trading activity in a financial market. New Journal of Physics, 14(1):013041, 2012.
- [139] V. van Noort, B. Snel, and M. A. Huymen. The yeast coexpression network has a small-world, scale-free architecture and can be explained by a simple model. EMBO reports, 5(3):280–284, 2004.
- [140] Stefania Vitali and Stefano Battiston. The community structure of the global corporate network. PLOS ONE, 9(8):1–13, 08 2014.
- [141] Stefania Vitali, James B Glattfelder, and Stefano Battiston. The network of global corporate control. PloS one, 6(10):e25995, 2011.
- [142] Andreas Wagner and David A. Fell. The small world inside large metabolic networks. Proceedings of the Royal Society of London. Series B: Biological Sciences, 268(1478):1803–1810, 2001.
- [143] Johan Walden. Trading, profits, and volatility in a dynamic information network model. Working paper, 2017.
- [144] S. Wasserman and K. Faust. Social Network Analysis: Methods and Applications. Structural Analysis in the Social Sciences. Cambridge University Press, 1994.
- [145] D. J. Watts and S. H. Strogatz. Collective dynamics of ‘small-world’ networks. Nature, 393:440–442, 1998.
- [146] Thomas Wilhelm, Heinz-Peter Nasheuer, and Sui Huang. Physical and Functional Modularity of the Protein Network in Yeast. Mol Cell Proteomics, 2(5):292–298, 2003.