Redshift determination of the BL Lac object 3C 66A by the detection of its host galaxy cluster at ††thanks: Based on observations carried out at the 8.1 meter telescope of Gemini North Observatory, Mauna Kea (Hawaii, USA).
Abstract
The BL Lac object 3C 66A is one of the most luminous extragalactic sources at TeV -rays (VHE, i.e. GeV). Since TeV -ray radiation is absorbed by the extragalactic background light (EBL), it is crucial to know the redshift of the source in order to reconstruct its original spectral energy distribution, as well as to constrain EBL models. However, the optical spectrum of this BL Lac is almost featureless, so a direct measurement of is very difficult; in fact, the published redshift value for this source () has been strongly questioned. Based on EBL absorption arguments, several constraints to its redshift, in the range , were proposed. Since these AGNs are hosted, typically, in early type galaxies that are members of groups or clusters, we have analysed spectro-photometrically the environment of 3C 66A, with the goal of finding the galaxy group hosting this blazar. This study was made using optical images of a arcmin2 field centred on the blazar, and spectra of 24 sources obtained with Gemini/GMOS-N multi-object spectroscopy. We found spectroscopic evidence of two galaxy groups along the blazar’s line of sight: one at and a second one at . The first one is consistent with a known foreground structure, while the second group here presented has six spectroscopically confirmed members. Their location along a red sequence in the colour-magnitude diagram allows us to identify 34 additional candidate members of the more distant group. The blazar’s spectrum shows broad absorption features that we identify as arising in the intergalactic medium, thus allowing us to tentatively set a redshift lower limit at . As a consequence, we propose that 3C 66A is hosted in a galaxy that belongs to a cluster at .
keywords:
BL Lacertae objects: individual: 3C66A – galaxies: distances and redshifts – galaxies: clusters: general1 INTRODUCTION
Blazars are the class of active galactic nuclei (AGN) which display the most extreme properties: strong and highly variable emission across the entire electromagnetic spectrum, from radio to gamma-rays, reaching in some cases the very high energy (VHE; i.e. GeV) domain (Urry & Padovani, 1995). It is widely accepted that a blazar’s observed radiation arises from a relativistic jet pointing at small angles with respect to our line of sight. The spectral energy distribution (SED) of these sources is thus dominated by non-thermal radiation, showing two bumps: the low-frequency one (from radio to X-rays) is ascribed to synchrotron emission, while the bump at high-frequencies (X-rays to -rays) is likely produced by inverse-Compton scattering (Konigl, 1981).
Blazars are classified based on the specific characteristics of their optical spectra. In this way, objects with significant emission-line equivalent widths ( Å, rest frame) are called flat-spectrum radio quasars (FSRQ), while those without (or with weak) emission lines are called BL Lac objects. The featureless continua that —by definition— characterise the optical spectra of these latter, in many cases prevent the determination of their redshifts. Nevertheless, a precise knowledge of the distances of these objects is mandatory for constraining models of their emission, considering also that these sources are the dominant population of the extragalactic sky at high energies (Costamante, 2013). In the absence of direct (i.e. spectroscopic) redshift measurements, other indirect procedures have been proposed to estimate, or at least constrain, BL Lac’s redshifts.
One of them uses the blazar’s host galaxy as a standard candle. Observations —particularly those performed with the Hubble Space Telescope (HST)— have shown that BL Lac objects are, almost always, found in elliptical galaxies; often luminous ellipticals comparable to brightest galaxies in small clusters or groups of galaxies (Urry et al., 2000). Sbarufatti et al. (2005) give, for BL Lac host galaxies, a mean absolute magnitude , with a very low dispersion ( mag), and a mean effective radius kpc. Shaw et al. (2013), on the other hand, say that when the sample is limited to -emitting BL Lacs, the hosts seem to be mag fainter: mag. Thus, the photometric (non)detection of the host galaxy is used to set limits to the blazar’s distance. Alternatively, a similar approach can be made through optical spectra, where the absence of host galaxy absorption lines (e.g. Landoni et al., 2014) or the detection of foreground absorptions (e.g. Landt, 2012) set lower limits to a BL Lac’s redshift.
The study of the TeV spectra of blazars can also provide redshift limits. Commonly, for large values of , VHE gamma-rays are absorbed by the infrared component of the extragalactic background light (EBL), since its photons are annihilated via pair-production (; Gould & Schréder, 1967). This causes a decrease in the observed flux and a softening of the measured spectrum. The optical depth () can be calculated if a model of the EBL is available, along with the redshift () and the gamma-ray photons energy (). In this way, depends both on the distance travelled by the gamma-ray photon and its energy (Stecker et al., 1992), therefore, the knowledge of this parameter can be used to estimate the intrinsic flux of the source, once de-absorbed. Conversely, if an EBL model and an intrinsic gamma-ray SED are assumed, the redshift can be estimated (Prandini et al., 2010).
3C 66A is a well-studied blazar; it was classified as a BL Lac object by Maccagni et al. (1987), based on its significant optical and X-ray variability, and was detected at VHE gamma-rays by VERITAS (Acciari et al., 2009). The synchrotron peak of this source is located between and Hz (Perri et al., 2003), therefore it can also be classified as an intermediate-frequency peaked BL Lac object (IBL, or ISP blazar).
An accurate determination of is crucial to obtain the original photon spectrum of the source. The VHE gamma-ray flux of distant sources, such as 3C 66A should the assumed be real, is expected to be significantly suppressed. Even assuming a smaller value for , the total amount of gamma-ray flux emitted, calculated following the prescription of Mazin & Raue (2007) for 3C 66A, must be huge and with a very hard spectrum (Aliu et al., 2009). Hence, verification of the actual redshift of the source is of importance both for AGN astrophysics and cosmology, therefore, several efforts have been made to determine this physical parameter.
The published redshift of this blazar was determined to be from optical spectroscopy by Miller et al. (1978), based on the detection of one single line; however, the authors stated that they were not sure of the reality of this emission feature, and warned that the redshift value is not reliable. Lanzetta et al. (1993) claimed a confirmation of the value, based on data from the International Ultraviolet Explorer (IUE). Only one emission line was marginally detected and systematic errors affecting such detections could not be ruled out completely. This value was questioned by Bramel et al. (2005), who encouraged further spectroscopic observations of this source. Another observation of 3C 66A at a different spectral range was reported by Finke et al. (2008), but no spectral feature was found; a lower limit for its redshift was thus set at . On the other hand Wurtz et al. (1996) reported a marginal photometric detection of 3C 66A’s host galaxy setting a lower limit to its redshift at .
More recently, by assuming that the EBL-corrected TeV spectrum is not harder than the Fermi–LAT spectrum, Prandini et al. (2010) suggested an upper-limit for the redshift of 3C 66A, with its most likely value being . Also based on EBL absorption of 3C 66A’s VHE spectrum, Yang & Wang (2010) set , while Yan et al. (2010) obtained , with a best-fit value . Finally, Furniss et al. (2013) reported a firm lower limit of 3C 66A’s redshift at , while a 99.9% confidence upper-limit was set at . These results are based on far-ultraviolet spectra (1132 Å–1800 Å) obtained with the Cosmic Origins Spectrograph (COS) on-board HST, where intergalactic medium absorption features were detected on a smooth continuum.
An independent approach to find out the redshift of a BL Lac with featureless optical spectrum, is to search its (projected) neighbourhood for a group or cluster of galaxies, to which the blazar might be associated. Although several works have undertaken the study of the immediate environment of BL Lacs (Farina et al., 2016, and references therein), the use of the group/cluster redshift as a proxy for the blazar’s redshift has been scarcely used (Pesce et al., 1995; Muriel et al., 2015; Rovero et al., 2016) (see also Torres Zafra et al., 2013, for preliminary results from the present project).
In particular, the galaxy environment of 3C 66A was tested by Butcher et al. (1976, hereafter But76), who found 15 probable members of a cluster surrounding 3C 66A, from which they estimated a photometric redshift . Later, and using the luminosity function of field galaxies, Wurtz et al. (1993) suggested that the blazar is associated to a poor cluster with a loosely constrained redshift . Bowen et al. (1997, hereafter Bow97), in turn, provided redshifts between and for 7 galaxies within a 16.7 arcmin2 projected area centred on 3C 66A; however, these objects are relatively bright, and none of them is included among the cluster member candidates cited above.
Considering the controversy about the redshift of 3C 66A, we have studied its environment using deep, two-colour photometry of objects within a field centred on the blazar, and spectra of a sub-sample of 24 objects (down to mag, and including 3C 66A itself), obtained with the Gemini North Telescope and the Gemini Multi-Object Spectrograph (GMOS). Our goal is to look for both photometric and spectroscopic signatures of a group or cluster of galaxies hosting the blazar, thus providing an independent and reliable determination of its redshift.
2 OBSERVATIONS AND DATA ANALYSIS
Observations were made at the 8.1 m Gemini North Telescope, Mauna Kea, Hawaii (USA), in August 2009, using the GMOS (Gemini Multi-Object Spectrograph) instrument in both image and MOS modes (program GN-2009B-Q-2; PI: I. Andruchow). The details on these data and their reduction process are given below.
2.1 Images
Observations included images in the (475 nm) and (780 nm) bands, covering a field of arcmin2 centred on the blazar. Seeing was about 0.7 arcsec, and we chose to use no binning (thus giving a scale of 0.0727 arcsec pix-1), to avoid saturation of the AGN, while getting sufficient S/N on the field galaxies. For the same purpose, we took several short-exposure frames through each filter: s and s in and , respectively.
Images were bias-subtracted and flat-fielded with dome flats. Overall, data reduction was performed with tasks from the gemini.gmos package included in iraf111IRAF is distributed by the National Optical Astronomy Observatories, which are operated by the Association of Universities for Research in Astronomy, Inc., under cooperative agreement with the National Science Foundation.
We performed photometry on the images using SExtractor (Bertin & Arnouts, 1996). This software allows to identify and classify point and extended sources, building catalogues with several photometric parameters. The MAG_AUTO parameter was used to measure total magnitudes of all the objects detected in the field, with an average error of mag for the brightest sources () and mag for the faintest sources (). The CLASS_STAR parameter, in turn, allowed us to identify the galaxies. This classification was further verified from the PSF (Point Spread Function) of the sources, discarding those showing a brightness profile with pixels in the band. In this way we could discriminate, with greater certainty, extended sources presenting intermediate classifications with CLASS_STAR (see Fig. 1). A visual inspection of the identified extended objects was performed, discarding those which were found to be saturated point sources, CCD blemishes, etc.
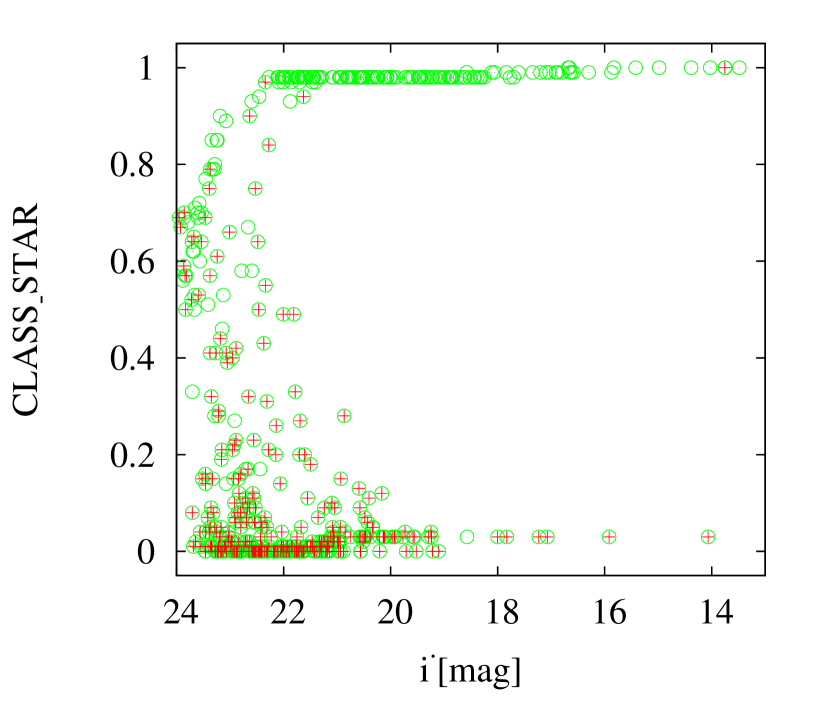
Magnitudes were corrected for Galactic extinction with the values from Schlafly & Finkbeiner (2011), as given in NASA Extragalactic Database (NED)222https://ned.ipac.caltech.edu/. We compared our photometry with several field stars in common with González-Pérez et al. (2001), obtaining fairly good agreement. The apparent magnitudes for 3C 66A were then measured to be and mag. In Fig. 1, we plot the classification parameter CLASS_STAR as a function of the magnitude for all sources detected in the field of 3C 66A. On the same diagram, we plotted extended objects identified from the pixels criterion, which were selected for this research.
The objects selected within the field for further photometric analysis were those brighter than 24.5 mag in the g′ band .
2.2 Spectra
Spectroscopic data were acquired in the multi-object (MOS) mode, making use of two diffraction gratings: and . Two multi-slit masks (one for each grating) were created from a co-added image provided by Gemini from our photometric images (see Section 2.1). The final mask for the B600-G5307 grating consisted of 23 slits with dimensions of 1.5 arcsec by 8 arcsec, whereas for the grating it consisted of 11 slits with dimensions of 1 arcsec by 8 arcsec. Slits were placed prioritising faint non-stellar objects in the usable field. Six exposures of 1800 s each were obtained with the grating (with a binning of ) in three different central wavelengths: 490 nm, 500 nm and 510 nm, to remove the gaps between the CCDs. The wavelength range covered was 3500 Å–6500 Å with a spectral resolution of 0.54 nm. The mask allowed us to extract the spectra of 23 objects.
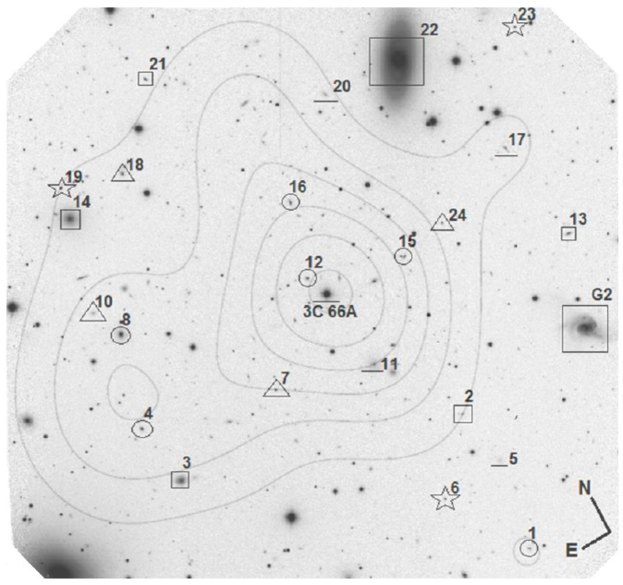
The grating was used in the MOS+N&S mode, covering a wavelength range of 7000 Å–10 000 Å with a spectral resolution of 0.79 nm. Eight exposures of 500 s each were obtained (with a binning of ) in three different central wavelengths: 790 nm, 800 nm and 810 nm. The Nod&Shuffle (N&S) mode was used to optimally subtract the sky (Glazebrook & Bland-Hawthorn, 2001), which is a particularly important issue in the redder range. Unfortunately, an error during the observations design led to partial overlapping of the resulting spectra, so we were only able to extract the spectra of 4 objects in this mask (of these, 3 were also observed through the mask). The objects with spectroscopic data in the field (with at least one grating) are shown in Fig. 2.
The spectroscopic data reduction was also performed with standard iraf procedures within the gemini package, namely: gbias, gsflat, gsreduce, gsmosaic, and gscut. Pixel to wavelength transformation was established using gstransform, from CuAr lamps spectra obtained as daytime calibrations. Finally, the individual spectra were extracted with gsextract. As redshift determination was our main goal, no flux calibration was performed on the extracted spectra.
This procedure was followed on data obtained in both observing modes; however, additional tasks (gnsskysub and gnscombine) were necessary for the subtraction of the sky and the combination of spectra taken in the N&S mode.
Cosmic rays cleaning was performed following the routine given in the gscrspec.cl script, available at the Gemini Observatory website333http://www.gemini.edu/sciops/data/software/gscrspec.cl. This script uses the Laplacian Cosmic Ray Identification method developed by Pieter G. van Dokkum in the lacos_spec.cl script444http://www.astro.yale.edu/dokkum/lacosmic/lacos_spec.cl. We verified that this procedure is more efficient than the iraf task gscrrej to clean cosmic rays.
We then used the fxcor task to determine the redshifts of selected objects in the field. This task allows to calculate the radial velocity through Fourier cross correlation between the spectrum of the object under analysis and a reference (template) spectrum (Tonry & Davis, 1979). Both spectra are continuum subtracted and Fourier filtered before doing the correlation, while dispersions are equalised by rebinning to the smallest dispersion. For this work we used two reference spectra: that of NGC 4449 (Kennicutt, 1992), an irregular galaxy that has well-defined emissions, and the spectrum of NGC 4387 (Gavazzi et al., 2004), an elliptical galaxy showing strong absorptions. Both templates were downloaded from NED. For those spectra where it was possible to establish a tentative redshift value, typical emission lines were identified, such as H , [O ii] (3727Å), H , [O iii] (4959Å), [O iii] (5007Å), and/or absorptions, like Ca ii (H+K), Ca+Fe, Na i, H . Finally, the redshift adopted for each object was computed from Gaussian fits to two or more such features in its spectrum. Three objects (slits #6, #19, and #23) turned out to be Galactic stars555The spectrum of object #6 looks like that of a red dwarf star, possibly blended with a hotter component. Given its magnitude ( mag), it should then be a very distant ( kpc) halo star. (we give their radial velocities in Table 1), while no reliable redshift value could be obtained for other five objects (slits #5, #11, #13, #17 and #20), due to the low S/N ratio of their spectra (we will return to objects #5 and #11 in Section 3.2). Tentative redshifts for two of them (slits #17 and #20) were measured through just one emission line each, which we assumed to be [O ii] (3727Å) and H , respectively (based on their colours and spiral morphology). So, their tentative redshift values would be and . No clear emission or absorption lines could be identified in the blazar’s spectrum, besides telluric lines and diffuse interstellar bands (DIB), so no definite redshift value could be established in this way for 3C 66A (see, however, Section 3.3 for our analysis on probable foreground absorptions on the blazar’s spectrum). Redshifts were thus established for 15 (plus two just tentative) out of the 24 selected objects. Our results are shown in Table 1, where we also include the only galaxy with a previously published redshift within our GMOS field (G2 in Bow97).
| Slit | ID | RAJ2000 | DecJ2000 | (or ) | Object type | ||
| (hh:mm:ss) | (∘:′:′′) | (mag) | (mag) | ||||
| 1 | 3C66A_01 | 02:22:35.3 | 42:59:05 | 22.275 | 20.518 | Elliptical | |
| 2 | 3C66A_02 | 02:22:35.7 | 43:00:32 | 21.849 | 21.309 | Spiral (strong bulge) | |
| 3 | 3C66A_03 | 02:22:50.7 | 43:01:03 | 18.859 | 17.830 | Spiral (Sa?) | |
| 4 | 3C66A_04 | 02:22:51.4 | 43:01:39 | 21.354 | 19.581 | Spiral | |
| 5 | 3C66A_05 | 02:22:34.9 | 42:59:58 | 22.012 | 20.974 | … | Dwarf elliptical |
| 6 | 3C66A_06 | 02:22:38.3 | 42:59:51 | 21.992 | 19.231 | ( km s-1) | Galactic star |
| 7 | 3C66A_07 | 02:22:44.1 | 43:01:28 | 21.827 | 20.575 | Spiral | |
| 8 | 3C66A_08 | 02:22:50.4 | 43:02:34 | 20.060 | 18.001 | Elliptical | |
| 9 | 3C 66A | 02:22:39.6 | 43:02:08 | 14.323 | 13.755 | … | Blazar |
| 10 | 3C66A_10 | 02:22:51.3 | 43:02:52 | 21.489 | 20.559 | Irregular | |
| 11 | 3C66A_11 | 02:22:38.8 | 43:01:18 | 20.065 | 19.100 | … | Dwarf elliptical |
| 12 | 3C66A_12 | 02:22:40.2 | 43:02:20 | 21.828 | 19.730 | Elliptical | |
| 13 | 3C66A_13 | 02:22:26.7 | 43:01:42 | 21.138 | 19.768 | … | Spiral or S0 |
| 14 | 3C66A_14a | 02:22:50.4 | 43:03:47 | 18.124 | 17.072 | Dwarf elliptical | |
| 15 | 3C66A_15 | 02:22:35.1 | 43:02:09 | 22.116 | 19.933 | Elliptical | |
| 16 | 3C66A_16 | 02:22:39.4 | 43:03:04 | 21.383 | 19.247 | Elliptical | |
| 17 | 3C66A_17∗ | 02:22:27.9 | 43:02:42 | 22.186 | 20.208 | Spiral | |
| 18 | 3C66A_18 | 02:22:46.9 | 43:03:59 | 21.529 | 19.559 | Early-type Spiral | |
| 19 | 3C66A_19 | 02:22:50.2 | 43:04:06 | 22.053 | 20.107 | ( km s-1) | Galactic star |
| 20 | 3C66A_20∗ | 02:22:35.4 | 43:03:53 | 21.579 | 20.107 | Late-type spiral | |
| 21 | 3C66A_21 | 02:22:43.8 | 43:04:45 | 20.963 | 20.107 | Spiral (Sc?) | |
| 22 | 3C66A_22b | 02:22:31.1 | 43:03:54 | 15.342 | 14.067 | Spiral (Sa) | |
| 23 | 3C66A_23 | 02:22:24.8 | 43:03:44 | 21.701 | 20.258 | ( km s-1) | Galactic star |
| 24 | 3C66A_24 | 02:22:32.6 | 43:02:18 | 21.710 | 20.478 | Spiral | |
| - - | G2c | 02:19:18.3 | 42:47:09 | 17.090 | 15.917 | 0.0667 | Spiral |
| a Galaxy G3 in Bow97 (no redshift was reported). | |||||||
| b UGC 1832 galaxy G1 in Bow97; the published value agrees with our result. | |||||||
| c Redshift from Bow97. | |||||||
| ∗ Galaxies whose tentative redshifts were measured through just one emission line. | |||||||
3 RESULTS
In order to determine or —at least— to constrain the redshift of 3C 66A, we perform an individual spectroscopic analysis of the source itself, as well as a spectro-photometric analysis of its close environment, aiming to identify the host galaxy group of this BL Lac object. Considerations about the blazar’s host galaxy are also presented.
3.1 Identification of galaxy groups
Based on the spectro-photometric results obtained (Table 1), we plot in Fig. 3 the distribution of the 18 spectroscopic redshifts measured within the area of our GMOS frame (17 from the present study plus one from the literature). We include 8 additional galaxies with published redshifts (from NED) lying within 7 arcmin from 3C 66A, but out of our arcmin field.
At least 3 concentrations of galaxies are evident in redshift space: one at , a second at , and a third one at . The first (6 members) is close to the redshift of the cluster Abell 347 (; Abell, 1958). In particular, the sight-line to 3C 66A goes through the poor cluster WBL 069, associated to Abell 347, and composed by the galaxies UGC 1832, UGC 1837, UGC 1841 (a.k.a. 3C 66B), and its compact dwarf neighbour V Zw 230, with a mean redshift (White et al., 1999). UGC 1832 is galaxy G1 in Bow97; we obtain for it (slit #22), in agreement with the published redshift. We obtain for the galaxy in slit #14; Bow97 list this galaxy as G3, with no redshift value due to the low S/N in their spectrum. We thus confirm it as a member of the same foreground group.
A second group in redshift space comprises 4 galaxies within 5 arcmin from 3C 66A with redshifts between according to NED. These include galaxies G2, G4 666This galaxy seems to be misidentified in NED; its coordinates in the database point to an object that looks like a Galactic star., and G6 in Bow97, along with the radio-source 3C 66, although only the first one lies within the GMOS field.
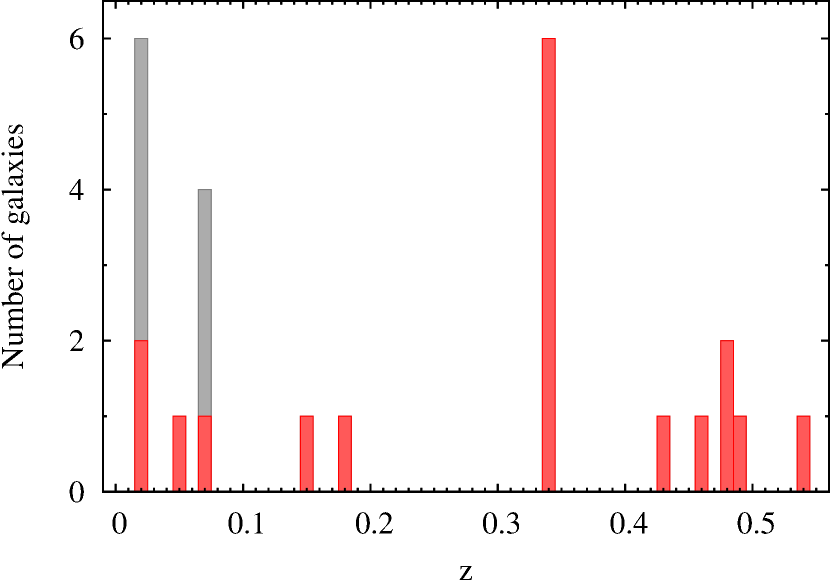
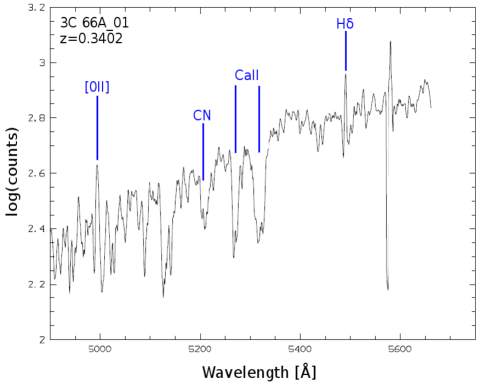
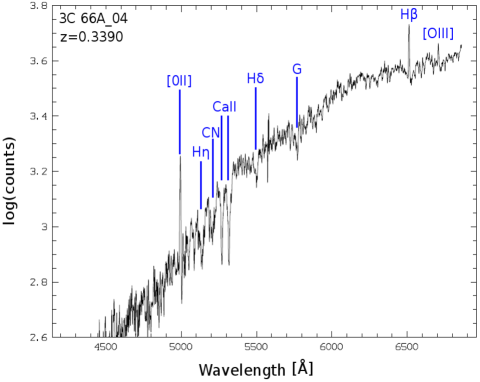
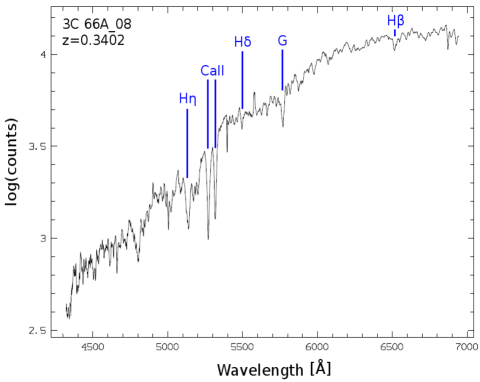
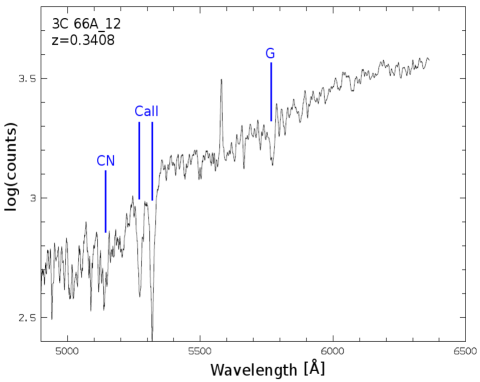
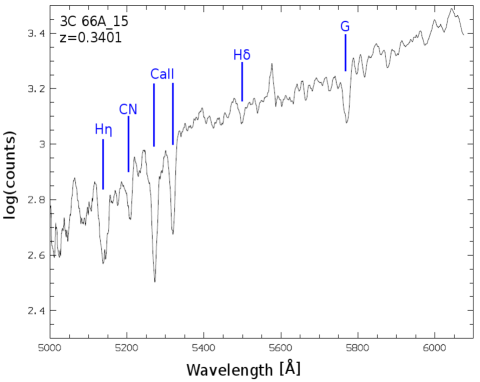
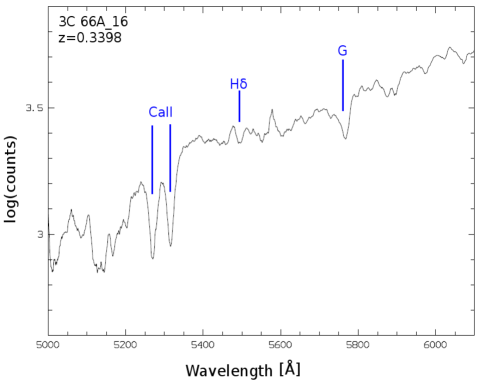
The third grouping is comprised by the 6 galaxies with redshifts between ( rms) presented in this paper (see Table 1). They all have spectral features typical of early-type galaxies (see Fig. 4), while their magnitudes span between and mag. Three of them are part of the galaxy overdensity identified by But76 in the immediate projected proximity of 3C 66A (see Fig. 2). In the following subsection we shall further analyse the spatial distribution and location of these galaxies in the colour-magnitude relation (CMR).
Note that no galaxy was detected at , which is the usually quoted redshift for 3C 66A. This could be, at least partially, the result of a selection effect, given that an elliptical galaxy would have mag at that redshift, i.e., too faint for our spectroscopy. However, we could still have measured spectroscopic redshifts for E galaxies with mag at . Also note that our data were able to disclose four late-type galaxies at ; while none of them is exactly at the published redshift for 3C 66A, at least one of them (object #10 in Table 1) would lie within km s-1 of the blazar, if at that redshift. Thus, our spectroscopic data cannot either confirm nor rule out the presence of a cluster at in the observed field.
3.2 The reference CRS as a clusters detector
Taking advantage of the evidence that early type galaxies in rich clusters follow a linear colour-magnitude relation (CMR), called Cluster Red Sequence (CRS; e.g.: Gladders & Yee, 2000), and considering the universal properties that the CRS presents: a low colour dispersion ( mag; mag), a slope that does not change significantly with , and a shift to redder colours as one progresses in redshift (López-Cruz et al., 2004), the CRS of a known cluster, or a reference CRS, can serve as a powerful observational tool for detecting galaxy clusters.
We use the red sequence of the Virgo cluster, conveniently shifted, as a reference CRS to confirm if the spectroscopically identified galaxies are members of galaxy clusters. At the same time, this allows us to identify new (photometric) candidate members for each cluster. The projected spatial distribution of both, confirmed and candidate members, may then provide additional support to a real connection between any of the clusters and the blazar.
The adopted CRS was obtained from the photometric analysis for 100 galaxies of the Virgo Cluster core performed by Chen et al. (2010), from SDSS (Sloan Digital Sky Survey) images in the bands. These galaxies allowed us to determine the best-fitting Virgo CRS, which is represented by:
| (1) |
We used this CRS shifted to and (Fig. 3). Shifts in colour and magnitude were established using - and evolutionary corrections computed through the stellar population synthesis template galaxy models of Buzzoni (2005). We obtain for the Virgo red-sequence at : mag and mag. Luminosity distance was computed with the aid of Ned Wright’s Cosmology Calculator 777http://www.astro.ucla.edu/~wright/CosmoCalc.html.
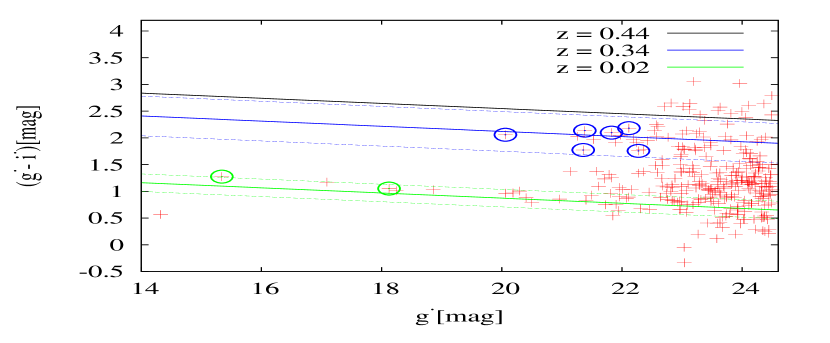
We plot in Fig. 5 the colour-magnitude diagram for all extended sources detected in the GMOS field of 3C 66A, showing also the Virgo red-sequence shifted to (blue solid line). The CRS clearly coincides with the position of the spectroscopically identified galaxies, confirming the presence of a cluster at . To identify other candidate members of this cluster, we calculated a maximum colour scatter around the reference CRS and a magnitude limit to minimize effects from photometric errors and background contamination. The colour scatter was determined based on the 6 spectroscopically identified members, mag. Following the recommendation of López-Cruz et al. (2004), the magnitude cut can be set at 2.0 mag below the apparent magnitude corresponding to the break of the typical cluster (Schechter) luminosity function, , at the cluster redshift. Given the adopted Cosmology, mag. This magnitude was transformed into the Gunn-Sloan photometric system through the colours given by Buzzoni (2005) for galaxies of different ages, resulting in mag. Therefore, an appropriate magnitude cut can be set at mag, corresponding to mag for this cluster (). This allowed us to consider as probable members those objects with mag, that are within the range of the CRS (blue dashed lines in Fig. 5). A total of 41 candidate members were identified in this way (including the 6 confirmed members), and we list them in Table 2. Galaxy 1456 (#18 in Table 1), however, is a background () spiral whose colour is redshifted onto the CRS. We consistently keep it in Table 2; it is clear that a certain level of contamination still remains within our candidate list.
Cluster membership probability for each galaxy was determined based on their magnitudes, following:
| (2) |
Here, is the number of galaxies with apparent magnitudes within a given range, is the number of galaxies with apparent magnitudes between the magnitude cut and , while is the total number of galaxies in the selected range. Besides membership probabilities, projected distances to the blazar (assuming they are at ) were obtained for the 41 candidate members (see Table 2). Note that of the candidates would lie within 500 kpc (projected distance) from the blazar.
| ID | RAJ2000 | DecJ2000 | DC | |||
|---|---|---|---|---|---|---|
| SExtractor | (hh:mm:ss) | (∘:′:′′) | (mag) | (mag) | kpc | |
| 872#8 | 02:22:50.4 | 43:02:34 | 20.06 | 18.00 | 1.000 | 593.0 |
| 1136 | 02:22:37.0 | 43:02:03 | 21.26 | 19.23 | 0.975 | 141.6 |
| 697#4 | 02:22:51.4 | 43:01:39 | 21.35 | 19.58 | 0.950 | 648.7 |
| 1377#16 | 02:22:39.4 | 43:03:04 | 21.38 | 19.25 | 0.926 | 274.1 |
| 1456#18 | 02:22:46.9 | 43:03:59 | 21.53 | 19.56 | 0.900 | 669.4 |
| 1195#12 | 02:22:40.2 | 43:02:20 | 21.83 | 19.73 | 0.878 | 66.9 |
| 717 | 02:22:47.1 | 43:01:22 | 21.89 | 19.97 | 0.853 | 461.0 |
| 1142 | 02:22:38.7 | 43:02:13 | 21.97 | 19.92 | 0.829 | 54.1 |
| 1243#15 | 02:22:35.1 | 43:02:09 | 22.12 | 19.93 | 0.800 | 241.4 |
| 1535 | 02:22:27.9 | 43:02:42 | 22.19 | 20.21 | 0.780 | 649.2 |
| 934 | 02:22:37.6 | 43:01:25 | 22.25 | 20.34 | 0.756 | 236.1 |
| 188#1 | 02:22:35.3 | 42:59:05 | 22.27 | 20.52 | 0.731 | 924.5 |
| 766 | 02:22:53.0 | 43:02:03 | 22.36 | 20.58 | 0.700 | 719.1 |
| 1006 | 02:22:39.8 | 43:01:58 | 22.43 | 20.48 | 0.682 | 50.1 |
| 1474 | 02:22:48.7 | 43:04:06 | 22.54 | 20.40 | 0.658 | 755.8 |
| 1082 | 02:22:40.7 | 43:02:07 | 22.57 | 20.33 | 0.634 | 59.2 |
| 1155 | 02:22:48.0 | 43:02:56 | 22.58 | 20.56 | 0.600 | 508.0 |
| 858 | 02:22:38.0 | 43:01:15 | 22.60 | 20.38 | 0.585 | 273.1 |
| 804 | 02:22:45.2 | 43:01:42 | 22.77 | 20.75 | 0.560 | 326.2 |
| 1372 | 02:22:38.1 | 43:02:50 | 22.94 | 21.10 | 0.536 | 220.6 |
| 2579 | 02:22:38.5 | 43:04:04 | 22.98 | 21.33 | 0.512 | 570.5 |
| 932 | 02:22:44.1 | 43:02:01 | 22.98 | 21.29 | 0.487 | 243.8 |
| 2081 | 02:22:38.3 | 43:04:18 | 23.00 | 20.93 | 0.463 | 639.7 |
| 772 | 02:22:38.1 | 43:00:53 | 23.01 | 21.17 | 0.439 | 375.7 |
| 1498 | 02:22:42.9 | 43:03:41 | 23.03 | 21.24 | 0.414 | 488.2 |
| 1388 | 02:22:36.1 | 43:02:44 | 23.04 | 21.26 | 0.390 | 257.4 |
| 1511 | 02:22:39.4 | 43:03:42 | 23.07 | 20.94 | 0.365 | 460.0 |
| 1111 | 02:22:49.1 | 43:02:52 | 23.20 | 21.38 | 0.341 | 553.1 |
| 2510 | 02:22:37.7 | 43:04:29 | 23.22 | 21.46 | 0.317 | 697.2 |
| 1910 | 02:22:23.7 | 43:03:23 | 23.22 | 21.43 | 0.292 | 928.2 |
| 198 | 02:22:46.4 | 42:59:59 | 23.24 | 21.16 | 0.268 | 729.0 |
| 1577 | 02:22:39.2 | 43:03:46 | 23.29 | 21.18 | 0.243 | 479.9 |
| 532 | 02:22:34.7 | 42:59:40 | 23.35 | 21.33 | 0.219 | 770.3 |
| 689 | 02:22:52.0 | 43:01:35 | 23.37 | 21.55 | 0.195 | 684.4 |
| 456 | 02:22:54.0 | 43:00:57 | 23.40 | 21.75 | 0.170 | 847.0 |
| 2478 | 02:22:44.6 | 43:04:50 | 23.47 | 21.55 | 0.146 | 836.6 |
| 1173 | 02:22:41.8 | 43:02:21 | 23.48 | 21.63 | 0.121 | 134.0 |
| 1936 | 02:22:27.6 | 43:03:39 | 23.69 | 21.93 | 0.097 | 782.4 |
| 2410 | 02:22:41.3 | 43:04:41 | 23.72 | 21.69 | 0.073 | 754.0 |
| 723 | 02:22:46.7 | 43:01:20 | 23.75 | 21.49 | 0.048 | 447.5 |
| 1553 | 02:22:28.3 | 43:02:42 | 23.81 | 21.85 | 0.024 | 628.4 |
| #1, #4, #8, #12, #15, #16 and #18: object numbers in Table 1. | ||||||
The spatial distribution of candidate members can be further illustrated by means of a density map (Gal et al., 2000). Fig. 2 shows contours of projected galaxy density, using a fixed Gaussian kernel with arcmin, where candidates are weighted by , as given in Table 2. The projected distribution of candidates is strongly concentrated to 3C 66A, with the maximum density centred very close to the blazar. The central peak was found to be significant at a level, through a significance map constructed from 500 synthetic data sets (see Gal et al., 2000, for details on significance maps computation).
The integrated luminosity of the 41 candidate member galaxies (excluding the blazar’s host) amounts to , giving an upper limit of total stellar mass (without considering any weight for the galaxies), consistent with a poor cluster of galaxies (see e.g. Buzzoni et al., 2012, and references therein), as proposed by Wurtz et al. (1993).
As discussed in Section 1, and considering that BL Lac objects are usually hosted by giant elliptical galaxies, typically associated with groups or galaxy clusters, we propose that the host galaxy of 3C 66A is a member of the cluster at found in this work. Assuming that the host galaxy is typical for TeV emitting BL Lacs (see section 3.4), its apparent magnitude should be mag, i.e., slightly fainter than the brightest galaxy in the group (slit #8). The cluster, then, seems to be dominated by these two bright ellipticals.
On the other hand, another red sequence, highlighted by some of the brightest objects in the field, can be visually identified in Fig. 5. We found that it can be fitted by shifting the Virgo CRS to , and the two galaxies with (spectroscopic) lie on this red sequence; this allows us to verify the presence, within the analysed field, of several members of the foreground group associated with Abell 347. Note that the typical Abell radius for a galaxy cluster is arcmin , so a cluster at would cover a diameter of arcmin. This indicates that the GMOS field of view ( arcmin2) allows us to observe only a small portion of the cluster (most probably at its outskirts). Since in this case we are sampling the faintest portion of the red sequence (where colour scatter is larger), in order to identify candidate members of this group we adopted a mag colour range (green dashed lines in Fig. 5), and a magnitude cutoff at mag, which corresponds to at , i.e. within the early-type dwarf galaxies domain, where the CMR is still well defined for nearby clusters (see Smith Castelli et al., 2008; Calderón et al., 2015). In this way, besides the 2 spectroscopically confirmed galaxies, #14 and #22, we identify 5 additional candidate members. Of these, galaxy G2 in Bow97 (, i.e. a neighbour of the radio source 3C 66) and object #3 () are background interlopers in the early-type galaxies CMR at . The other candidates (including objects #5 and #11, for which we could obtain no spectroscopic redshift, due to their very low surface brightnesses), however, show clear dE (dwarf elliptical) morphologies; this has been shown to be an excellent membership indicator for low-redshift clusters (e.g. Cellone & Buzzoni, 2005, and references therein), so we retain them as probable members of the group.
3.3 Analysis of the optical spectrum of 3C 66A
Due to its inherent nature of non-thermal emission, a proper analysis of any blazar spectrum is a difficult task. In our specific case, as we will see in the next section, the underlying galaxy hosting 3C 66A (most likely a gas-poor early-type system) seems to be too faint to leave any explicit signature in the target integrated spectrum. The resulting spectral energy distribution (SED) is, therefore, expected to lack any striking absorption feature, and actually this enhanced “smoothness” is a recognised drawback when trying to constrain the blazar distance (and therefrom its related physical properties) through a redshift measurement.
A hint pointing to a quite “blue” object does emerge from our photometry, once considering the likely effect of redshift on target apparent colour (namely, ). The two wavelength branches of 3C 66A’s spectrum, respectively for the and gratings are displayed in Fig. 6.
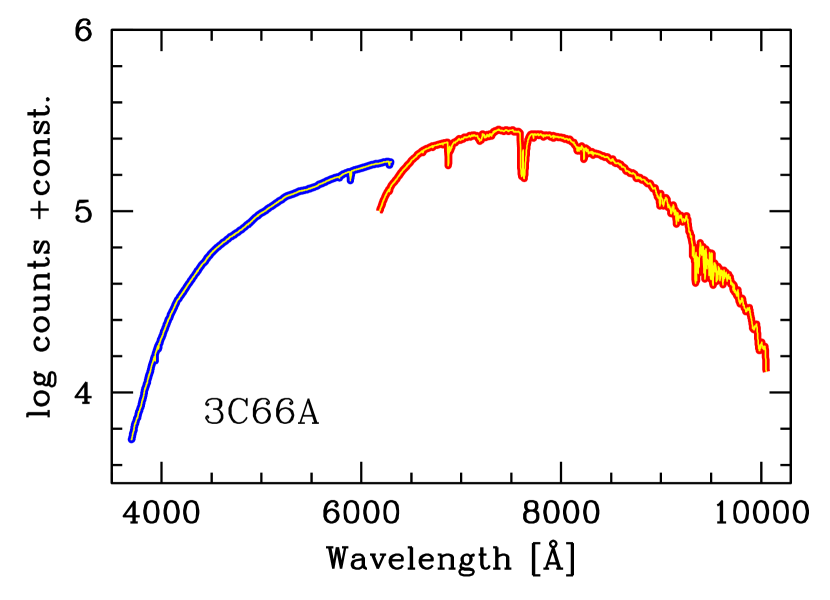
At first glance, one sees that a more thorough analysis could be enabled if the bell-shaped instrumental response is removed, for instance by normalising the observed spectrum with respect to its pseudo-continuum. This task has been carried out with the appropriate midas routine (i.e. normalise/spectrum in the Longslit context), by interactively identifying the upper envelope in the logarithmic count domain to be eventually subtracted to the observations. The blue and red branches of the spectrum have then been carefully matched around 6100 Å, and a unique spectrum, between 4000 and 10 000 Å, has been obtained (Fig. 7).
After linearisation, a more entangled plot begins to appear from our data, clearly putting in evidence a number of thin but significant absorption features. To a closer analysis, one has first to report the pervasive contribution of telluric absorptions. Both O2 and water vapour (H2O) bands strongly affect the target emission and severely tackle our chance to single out any genuine target feature longward of Å. The telluric pattern, however, fairly well compares with the study of Stevenson (1994) and these features clearly stand out, in our spectrum, for their sharp profile.

Quite more importantly, on the contrary, a number of broadened absorption features also mark the linearised spectrum, with prominent bands easily recognised about 4300, 4800, 5550, 6350 and 8700 Å (see, again, Fig. 7). Such broadened features are certainly of extragalactic origin, and might be suggestive of some interloping gas clouds, which selectively absorb the 3C 66A luminosity along the line of sight. No obvious constrain can be posed to this scenario, of course, but a speculative fit with a redshifted synthetic spectrum from the Bluered stellar library (Bertone et al., 2008) for a K (metal-poor) model atmosphere might lead to identify some of the observed bands with the H, H and H Balmer lines, as provided by foreground gas clouds up to , as sketched in the figure. If this is the real case, then a lower limit can be placed to 3C 66A redshift at .
3.4 The host galaxy
In this section we briefly analyse the image of the blazar, in order to see if we can detect its host galaxy, to further constrain or confirm the blazar’s redshift. We used iraf task psfmeasure to fit a Moffat function to the PSF of the blazar and 12 stars on the central chip of the GMOS array (the same where the blazar image is). This was done on the image only, because in the image the AGN is slightly saturated. After correcting for PSF trends with position on the chip, we find that the FWHM of the blazar’s PSF is marginally larger () than the mean value corresponding to stars. For the Moffat parameter, in turn, the blazar’s value is larger than for the stars. This would mean that the host galaxy is marginally resolved in our images, in agreement with Wurtz et al. (1996). However, the presence of haloes of stray light around the AGN and bright stars in our images makes this result uncertain.
We then simulated images of an elliptical galaxy (represented by a de Vaucouleurs model) with mag and kpc (Shaw et al., 2013; Sbarufatti et al., 2005) plus a Moffat model representing the AGN, at different redshifts. Galaxy models 1 mag fainter/brighter than the mean adopted absolute magnitude were also considered, and their apparent magnitudes were calculated using - and evolutionary corrections following Buzzoni (2005). Due to the mentioned stray light halo around the blazar’s image, all we can say is that detection of a typical host galaxy at would have been marginal, at best. In any case, it is clear that we can definitely rule out a low redshift value such as , corresponding to the foreground grouping of galaxies mentioned in section 3.1.
4 SUMMARY AND CONCLUSIONS
We have spectro-photometrically analysed the close environment of 3C 66A using two-band () optical images of a arcmin2 field centred on the blazar, along with multi-object spectroscopy obtained with the Gemini North telescope and the Gemini Multi Object Spectrograph (GMOS). We obtained spectra for the blazar as well as twenty-four objects in the field, and we were able to measure reliable redshifts for 15 galaxies in the blazar’s line of sight, spanning the range . We found no evidence confirming the published redshift () for 3C 66A, although we cannot formally rule it out either. Instead, we could firmly establish the presence of a galaxy group at in the close environment of 3C 66A. In particular:
-
•
We identified two concentrations of galaxies (in redshift space) along the blazar line of sight, at and , respectively. The first of them corresponds to the poor cluster WBL 069, associated to Abell 347 (White et al., 1999); we identified two new members of this cluster. The second one is composed of six objects with redshifts between and ; we classify almost all of them as early type galaxies. On the other hand, there is a galaxy in our GMOS field that seems to belong to another loose grouping in the line of sight at , associated with the radio-source 3C 66.
-
•
Using the Virgo Cluster red sequence (from data published in Chen et al., 2010) as a reference CRS, shifted to and , we were able to identify two structures (i.e., “red sequences”) traced by early-type galaxies on the colour-magnitude diagram. The six galaxies with and the two galaxies with , coincide with the position of the Virgo CRS shifted to these same values, respectively, thus supporting the presence of two galaxy clusters, one at and other at .
-
•
Adopting a colour dispersion mag for the cluster detected at , we identified candidate members (including spectroscopically confirmed members and 2 confirmed background objects). On the other hand, for the cluster, the colour dispersion (as measured from the 6 spectroscopically confirmed members) is mag. This allowed us to identify 41 candidate members from the CMD (including spectroscopically confirmed members and one confirmed background galaxy). The projected spatial distribution of candidates shows a significant concentration centred on 3C 66A’s position.
-
•
It was not possible to detect the 3C 66A host galaxy on the images. Simulations of a de Vaucouleurs profile for the host galaxy ( mag and kpc, Shaw et al., 2013; Sbarufatti et al., 2005) combined with a Moffat function for the AGN seeing convolved PSF, showed that the host galaxy would have been, at best, marginally detected if at . At the same time, membership of 3C 66A to any of the lower redshift groups at and can be ruled out.
-
•
Analysing the blazar’s normalised optical spectrum between Å– Å, we were able to relate some absorption features with contributions of telluric origin, while shallow and broad absorption bands around , , , , and Å could be associated with the foreground intergalactic medium (IGM). By fitting a stellar synthetic spectrum ( K) at varying redshifts, it was possible to tentatively identify those absorption bands with the Balmer series (H, H and H) produced in the IGM at . In this way, a redshift lower limit can be established for 3C 66A. This is consistent with the firm lower limit and the 99.9% confidence upper-limit given by Furniss et al. (2013).
Finally, considering these lower/upper limits for 3C 66A, and taking into account the fact that BL Lac hosts are, typically, early type galaxies associated to a group or a galaxy cluster (Urry et al., 2000), we propose that the host galaxy of 3C 66A belongs to a galaxy cluster at .
Acknowledgements
Based on observations obtained at the Gemini Observatory (program GN-2009B-Q-2), which is operated by the Association of Universities for Research in Astronomy, Inc., under a cooperative agreement with the NSF on behalf of the Gemini partnership: the National Science Foundation (United States), the National Research Council (Canada), CONICYT (Chile), Ministerio de Ciencia, Tecnología e Innovación Productiva (Argentina), and Ministério da Ciência, Tecnologia e Inovação (Brazil). Data were acquired through the Gemini Science Archive and processed using the Gemini IRAF package.
This work has been partially supported with grants from La Plata National University (Argentina) and The Argentinian National Gemini Office. We thank Dr. Germán Gimeno, Gemini staff member, for his advice in the process of Nod&Shuffle data reduction, and Dr. Analía Smith Castelli for her recommendations on data analysis.
The authors want to thank the anonymous referee for valuable comments that really helped to improve this paper.
References
- Abell (1958) Abell G. O., 1958, ApJS, 3, 211
- Acciari et al. (2009) Acciari V. A., et al., 2009, ApJ, 693, L104
- Aliu et al. (2009) Aliu E., et al., 2009, ApJ, 692, L29
- Bertin & Arnouts (1996) Bertin E., Arnouts S., 1996, A&AS, 117, 393
- Bertone et al. (2008) Bertone E., Buzzoni A., Chávez M., Rodríguez-Merino L. H., 2008, A&A, 485, 823
- Bowen et al. (1997) Bowen D. V., Osmer S. J., Blades J. C., Tytler D., 1997, MNRAS, 284, 599
- Bramel et al. (2005) Bramel D. A., et al., 2005, ApJ, 629, 108
- Butcher et al. (1976) Butcher H. R., Oemler Jr. A., Tapia S., Tarenghi M., 1976, ApJ, 209, L11
- Buzzoni (2005) Buzzoni A., 2005, MNRAS, 361, 725
- Buzzoni et al. (2012) Buzzoni A., Cellone S. A., Saracco P., Zucca E., 2012, MNRAS, 420, 3427
- Calderón et al. (2015) Calderón J. P., Bassino L. P., Cellone S. A., Richtler T., Caso J. P., Gómez M., 2015, MNRAS, 451, 791
- Cellone & Buzzoni (2005) Cellone S. A., Buzzoni A., 2005, MNRAS, 356, 41
- Chen et al. (2010) Chen C.-W., Côté P., West A. A., Peng E. W., Ferrarese L., 2010, ApJS, 191, 1
- Costamante (2013) Costamante L., 2013, International Journal of Modern Physics D, 22, 1330025
- Farina et al. (2016) Farina E. P., Fumagalli M., Decarli R., Fanidakis N., 2016, MNRAS, 455, 618
- Finke et al. (2008) Finke J. D., Shields J. C., Böttcher M., Basu S., 2008, A&A, 477, 513
- Furniss et al. (2013) Furniss A., Fumagalli M., Danforth C., Williams D. A., Prochaska J. X., 2013, ApJ, 766, 35
- Gal et al. (2000) Gal R. R., de Carvalho R. R., Odewahn S. C., Djorgovski S. G., Margoniner V. E., 2000, AJ, 119, 12
- Gavazzi et al. (2004) Gavazzi G., Zaccardo A., Sanvito G., Boselli A., Bonfanti C., 2004, A&A, 417, 499
- Gladders & Yee (2000) Gladders M. D., Yee H. K. C., 2000, AJ, 120, 2148
- Glazebrook & Bland-Hawthorn (2001) Glazebrook K., Bland-Hawthorn J., 2001, PASP, 113, 197
- González-Pérez et al. (2001) González-Pérez J. N., Kidger M. R., Martín-Luis F., 2001, AJ, 122, 2055
- Gould & Schréder (1967) Gould R. J., Schréder G. P., 1967, Physical Review, 155, 1404
- Kennicutt (1992) Kennicutt Jr. R. C., 1992, ApJS, 79, 255
- Konigl (1981) Konigl A., 1981, ApJ, 243, 700
- Landoni et al. (2014) Landoni M., Falomo R., Treves A., Sbarufatti B., 2014, A&A, 570, A126
- Landt (2012) Landt H., 2012, MNRAS, 423, L84
- Lanzetta et al. (1993) Lanzetta K. M., Turnshek D. A., Sandoval J., 1993, ApJS, 84, 109
- López-Cruz et al. (2004) López-Cruz O., Barkhouse W. A., Yee H. K. C., 2004, ApJ, 614, 679
- Maccagni et al. (1987) Maccagni D., Garilli B., Schild R., Tarenghi M., 1987, A&A, 178, 21
- Mazin & Raue (2007) Mazin D., Raue M., 2007, A&A, 471, 439
- Miller et al. (1978) Miller J. S., French H. B., Hawley S. A., 1978, in Wolfe A. M., ed., BL Lac Objects. pp 176–187
- Muriel et al. (2015) Muriel H., Donzelli C., Rovero A. C., Pichel A., 2015, A&A, 574, A101
- Perri et al. (2003) Perri M., et al., 2003, A&A, 407, 453
- Pesce et al. (1995) Pesce J. E., Falomo R., Treves A., 1995, AJ, 110, 1554
- Prandini et al. (2010) Prandini E., Bonnoli G., Maraschi L., Mariotti M., Tavecchio F., 2010, MNRAS, 405, L76
- Rovero et al. (2016) Rovero A. C., Muriel H., Donzelli C., Pichel A., 2016, A&A, 589, A92
- Sbarufatti et al. (2005) Sbarufatti B., Treves A., Falomo R., 2005, ApJ, 635, 173
- Schlafly & Finkbeiner (2011) Schlafly E. F., Finkbeiner D. P., 2011, ApJ, 737, 103
- Shaw et al. (2013) Shaw M. S., et al., 2013, ApJ, 764, 135
- Smith Castelli et al. (2008) Smith Castelli A. V., Bassino L. P., Richtler T., Cellone S. A., Aruta C., Infante L., 2008, MNRAS, 386, 2311
- Stecker et al. (1992) Stecker F. W., de Jager O. C., Salamon M. H., 1992, ApJ, 390, L49
- Stevenson (1994) Stevenson C. C., 1994, MNRAS, 267, 904
- Tonry & Davis (1979) Tonry J., Davis M., 1979, AJ, 84, 1511
- Torres Zafra et al. (2013) Torres Zafra J., Cellone S. A., Andruchow I., 2013, Boletín de la Asociación Argentina de Astronomía, 56, 37
- Urry & Padovani (1995) Urry C. M., Padovani P., 1995, PASP, 107, 803
- Urry et al. (2000) Urry C. M., Scarpa R., O’Dowd M., Falomo R., Pesce J. E., Treves A., 2000, ApJ, 532, 816
- White et al. (1999) White R. A., Bliton M., Bhavsar S. P., Bornmann P., Burns J. O., Ledlow M. J., Loken C., 1999, AJ, 118, 2014
- Wurtz et al. (1993) Wurtz R., Ellingson E., Stocke J. T., Yee H. K. C., 1993, AJ, 106, 869
- Wurtz et al. (1996) Wurtz R., Stocke J. T., Yee H. K. C., 1996, ApJS, 103, 109
- Yan et al. (2010) Yan D., Fan Z., Dai B., 2010, arXiv:1011.1537,
- Yang & Wang (2010) Yang J., Wang J., 2010, PASJ, 62, L23