Calibrating Star Formation in WISE using Total Infrared Luminosity
Abstract
We present accurate resolved WISE photometry of galaxies in the combined SINGS and KINGFISH sample. The luminosities in the W3 12µm and W4 23µm bands are calibrated to star formation rates (SFRs) derived using the total infrared luminosity, avoiding UV/optical uncertainties due to dust extinction corrections. The W3 relation has a 1- scatter of 0.15 dex over nearly 5 orders of magnitude in SFR and 12µm luminosity, and a range in host stellar mass from dwarf (107 M⊙) to M⋆ (1011.5 M⊙) galaxies. In the absence of deep silicate absorption features and powerful active galactic nuclei, we expect this to be a reliable SFR indicator chiefly due to the broad nature of the W3 band. By contrast the W4 SFR relation shows more scatter (1- 0.18 dex). Both relations show reasonable agreement with radio continuum-derived SFRs and excellent accordance with so-called “hybrid” Hm and FUV24µm indicators. Moreover, the WISE SFR relations appear to be insensitive to the metallicity range in the sample. We also compare our results with IRAS-selected luminous infrared galaxies, showing that the WISE relations maintain concordance, but systematically deviate for the most extreme galaxies. Given the all-sky coverage of WISE and the performance of the W3 band as a SFR indicator, the SFR relation could be of great use to studies of nearby galaxies and forthcoming large area surveys at optical and radio wavelengths.
2017 November 17
1 Introduction
Mapping the build-up of stellar mass underpins galaxy evolution studies and tests of the CDM cosmological framework that informs simulations of our Universe. Accurate star formation rates therefore form the cornerstone of extragalactic studies and have been the subject of vigorous study for at least the past three decades (see reviews by Kennicutt, 1998; Calzetti, 2013). However, the determination of a star formation rate (SFR) for any given galaxy is inherently difficult; active star formation is associated with copious dust, which itself obscures the radiation from the hot, young stars one is trying to measure. The ultraviolet (UV) directly traces the youngest stellar populations and therefore respresents the “purest” star formation indicator. However, the UV is heavily extincted by dust, and although numerous methods exist to correct for this dust extinction, variations in dust content and geometry unavoidably produce large scatter (e.g. Calzetti et al., 2007).
The optical nebular recombination lines are less affected by dust compared to the UV, and of these the H emission line is the least attenuated. However, uncertainties still arise due to the variation of the dust extinction from location to location and the assumption of the underlying stellar absorption (e.g. Calzetti et al., 2007). H maps, corrected for extinction, have been successfully used to trace star formation (e.g. Casasola et al., 2015) and with increased access to integral field observations, studies of the impact of aperture corrections on particularly single-fiber-derived SFRs advocate caution to avoid systematic bias (e.g. Iglesias-Páramo et al., 2013; Richards et al., 2016).
Surveys with multiwavelength coverage can rely on multiband photometry combined with spectral energy distribution (SED) models to determine the physical properties of galaxies using codes such as MAGPHYS (da Cunha et al., 2008) and CIGALE (Noll et al., 2009). However, full radiative transfer solutions (e.g. Natale et al., 2014; Grootes et al., 2017) will ultimately be crucial to disentangling star formation processes within galaxies.
Exploiting dust emission itself as a measure of the SFR, i.e. calibrating dust reprocessed starlight, has its own pitfalls (for a detailed review see Calzetti, 2013). Using emission from µm, usually termed the total infrared luminosity or , has the advantage of sampling dust heated by young (1 - 100 Myr), UV-luminous O and B stars, as well as intermediate mass (2 - 3 M⊙), UV-faint A and F stellar populations. However, having a well-sampled dust SED is observationally intensive and can only be achieved using space-based observatories. For example, the ongoing DustPedia project (Davies et al., 2017) leverages Herschel Space Observatory (Pilbratt et al., 2010) and Planck (Planck Collaboration et al., 2016) observations with ancillary archival multiwavelength data to produce Bayesian SED fits and photon tracing radiative transfer modeling, providing a legacy dataset for exploring how dust emission is related to its physical properties and origins.
Hybrid SFR indicators compensate for extinction effects by combining a dust-obscured star formation tracer with an unobscured measure of star formation (see, for example, Calzetti et al., 1995; Buat et al., 1999). Seminal work by Kennicutt et al. (2007) and Calzetti et al. (2007), combining H and 24µm, was expanded by Kennicutt et al. (2009), and although highly successful, does require some caution when low levels of star formation are measured (e.g. Boselli et al., 2015). The equivalent FUV 24µm SFR relation (e.g. Bigiel et al., 2008; Leroy et al., 2008; Boquien et al., 2016) was made possible by the NUV and FUV bands of the GALEX satellite (Martin et al., 2005). Both these relations have been used extensively to study star formation in nearby galaxies (e.g. Rahman et al., 2011; Ford et al., 2013; Momose et al., 2013; Heesen et al., 2014) and variations include: FUV 25µm (e.g. Hao et al., 2011), UV 22µm (e.g. Cortese, 2012; Huang & Kauffmann, 2015; Casasola et al., 2017), and H 22µm (e.g. Lee et al., 2013).
The Infrared Astronomical Satellite, IRAS (Neugebauer et al., 1984), Infrared Space Observatory, ISO (Kessler et al., 2003), Spitzer Space Telescope (Werner et al., 2004), and Herschel Space Observatory (Pilbratt et al., 2010) pioneered the use of monochromatic infrared SFR calibrators. In particular, the 24µm band has been characterised by several studies for the determination of global SFRs (Wu et al., 2005; Zhu et al., 2008; Rieke et al., 2009; Calzetti et al., 2010). Tracing the warm dust continuum arising from small grains, as well as non-thermal emission from stochastically heated grains, the MIPS 24µm band is relatively free of contamination from the stellar continuum, polycyclic aromatic hydrocarbons (PAHs), and nebular line emission, while also providing adequate spatial resolution for optically-derived surveys. In addition, warm dust emission is more closely associated with recent star formation than emission at longer wavelengths, where heating from old stellar populations become an important consideration (e.g. Popescu et al., 2000).
Indeed, with the launch of the Wide-Field Infrared Explorer, WISE (Wright et al., 2010), and its all-sky survey, the W4 band (nominally centered on 22µm, but more recent work by Brown et al., 2014b, places the center of the band closer to 23µm) was expected to be the primary SFR indicator. As with the Spitzer 24µm band, the WISE W4 band is not contaminated by emission lines (at ), measuring the warm dust continuum which, in the absence of active galactic nucleaus (AGN) activity, provides a reliable measure of star formation, comparable to that of Balmer-corrected H measures (Brown et al., 2017). However, the widespread use of this band is severely hampered due to a lack of sensitivity (Jarrett et al., 2013).
In contrast to the WISE 23µm band, which benefits from numerous Spitzer MIPS-24 studies, the 12µm window was last used extensively as part of the IRAS (Infrared Astronomical Satellite) mission, but was limited by its 4′ resolution. Nevertheless, Takeuchi et al. (2005) showed that the 12µm luminosity could be used as a reliable measure of .
Compared to the Spitzer mid-infrared bands, the WISE W3 band is somewhat unusually broad, covering 7.5 – 16.5µm at half-power (Jarrett et al., 2011), which at samples part of the broad 7.7µm PAH feature, the 8.5µm PAH, the 10µm silicate absorption feature, the 11.3µm PAH feature, the S(2) line of pure rotational H2 at 12.3µm, and the 12.81µm Ne ii and 13.7µm Ne iii nebular emission lines. It is sometimes characterized as the “PAH” band of WISE, because the center of the band (11.6µm) is close to the 11.3µm emission feature, but it is clearly far more complex. PAH fractions are high in regions of active star formation and their abundance suggests that they are produced in molecular clouds (Sandstrom et al., 2010), likely growing on dust grains, but are destroyed by the relatively hard interstellar radiation field of the diffuse interstellar medium (ISM) and that produced by AGN (Smith et al., 2007).
In this paper we build on the work of Cluver et al. (2014) exploring the use of the WISE 12µm and 23µm bands as SFR indicators. In order to be independent of uncertainties associated with dust extinction corrections for calibrators in the UV and optical (for example, see comparison of 12 SFR metrics in Davies et al., 2016), we exploit the Spitzer and Herschel photometry of the combined SINGS (Spitzer Infrared Nearby Galaxy Survey; Kennicutt et al., 2003) and KINGFISH (Key Insights on Nearby Galaxies: a Far-Infrared Survey with Herschel; Kennicutt et al., 2011) samples to calibrate star formation determined from . In addition to this sample of “typical” galaxies from which we derive new SFR relations, we also compare with WISE measurements of the most luminous infrared galaxies.
In this work, all monochromatic luminosities are defined as , for example, . We adopt a Kroupa (2002) initial mass function (IMF) throughout this work, where the IMF has the slope for stellar masses 0.5100 M⊙ and a shallower slope for the mass range 0.10.5 M⊙. The cosmology adopted throughout this paper is km s-1 Mpc-1, , and . All magnitudes are in the Vega system accordant to the calibration adopted by the WISE survey (as described in Jarrett et al., 2011). All linear fits are performed using the Hyper-Fit package (Robotham & Obreschkow, 2015) which incorporates heteroscedastic errors and outputs a measure of intrinsic scatter, as well as a parameter covariance matrix.
2 Data
2.1 Sample
The SINGS survey (Kennicutt et al., 2003) was carried out as a Legacy Project on the Spitzer Space Telescope in order to study the physics of the star-forming ISM. A sample of 75 galaxies was drawn from the nearby universe (d Mpc) to provide spatially-resolved Spitzer images and spectra of a diverse set of typical local galaxies. Combined with comprehensive ancillary multi-wavelength data, a key science goal of the project was to develop improved diagnostics of SFRs in galaxies.
Building on the successes of the SINGS study, the KINGFISH project on the Herschel Space Observatory (Kennicutt et al., 2011) obtained far-infrared imaging and spectral line maps to enable the detailed characterisation of the ISM, as well as the heating and cooling of gaseous and dust components. The KINGFISH sample consists of a subset (57 galaxies) of the SINGS sample, with the addition of 4 galaxies: IC 0342, NGC 2146, NGC 3077 and M101 (NGC 5457). The combined SINGS/KINGFISH sample therefore consists of 79 galaxies.
2.2 WISE Photometry
The WISE telescope was launched in December 2009 and completed its nominal mission of an all-sky survey at 3.4, 4.6, 12 and 23µm111We adopt the W4 calibration from Brown et al. (2014b), in which the W4 response is redder, with a central wavelength is 22.8m and the magnitude-to-flux conversion factor is 7.871 Jy. before depleting its cryogen in October 2010. WISE was placed in hibernation in February 2011, but was successfully reactivated in September 2013 and continues to observe at wavelengths of 3.4 and 4.6µm as part of the NEOWISE program (Mainzer et al., 2014).
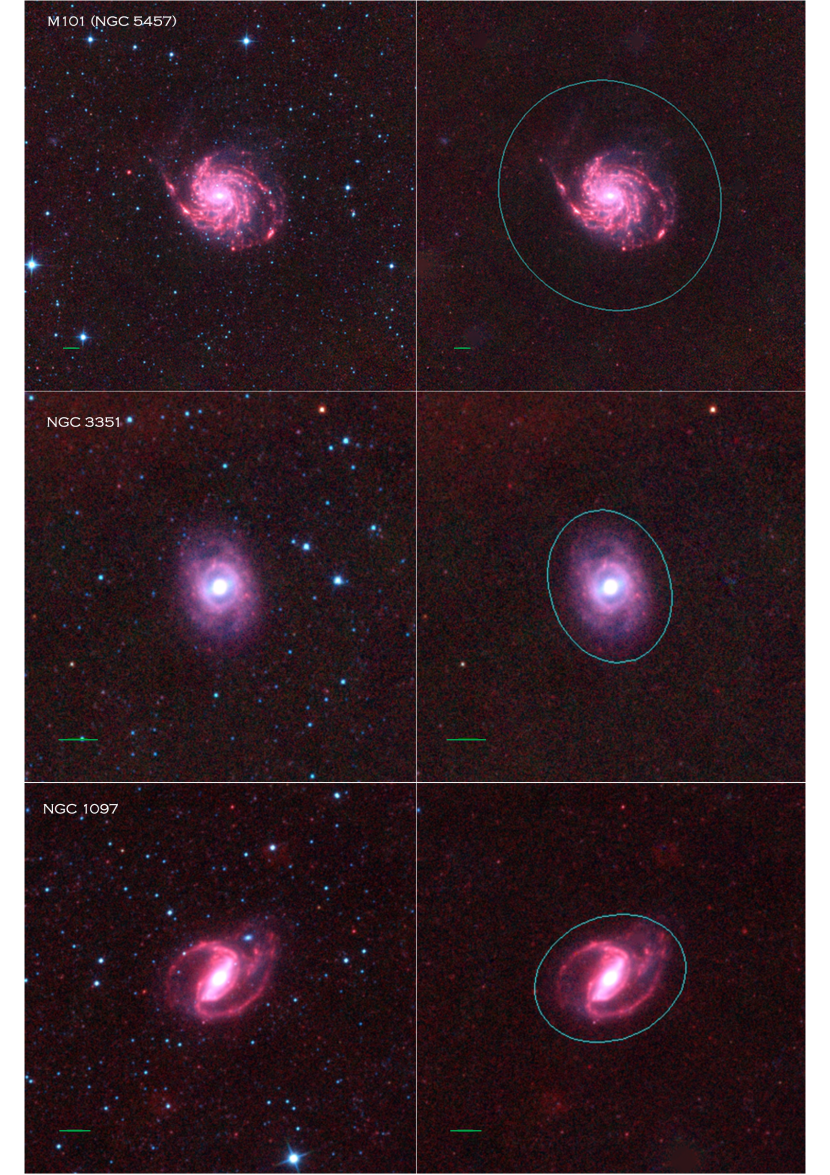
With a 40cm diameter primary mirror, the native image resolution of single exposure WISE frames is 6″ in W1 (3.4µm) and W2 (4.6µm). To preserve the native resolution and improve sensitivity by adding the latest NEOWISE imaging, we have constructed new mosaics employing the ICORE software package (Masci, 2013); resulting mosaics achieve a spatial resolution of 5.9″(W1), 6.5″(W2), 7.0″(W3), and 12.4″(W4) (Jarrett et al., 2012). Consideration of the mosaic size was also of primary importance because of the angular extent of the SINGS galaxies, capturing both the galaxy, as well as the local environment to properly assess the background levels.
Target galaxies are measured using custom software optimised for performing aperture photometry on resolved galaxies (Jarrett et al., 2013; Cluver et al., 2014; Jarrett et al., 2017). Standard WISE photometry consists of integrated fluxes down to a 1 of the sky surface brightness (typically 23 mag arcsec-2) for all four bands, which is referred to as the isophotal photometry (see Figure 1). Colors are determined using matched apertures – where apertures are all matched to the W1 isophote, except in cases where the emission is considerably less in the other bands; e.g., stellar-dominated cases, such as elliptical galaxies, with the Rayleigh-Jeans emission in W1, W2 and very little emission in W3 and W4. In those cases, we match to the smaller aperture (usually W2), and similarly for the W2W3 color. However, for the majority of the cases, because the SINGS sample is so bright in the mid-infrared, all four bands have matched apertures. For a few rare cases (notably the dwarf galaxies), the source is not resolved in the W3 or W4 apertures, in which case we use the standard point source photometry from the ALLWISE catalogue222http://irsa.ipac.caltech.edu/cgi-bin/Gator/nph-dd (Cutri et al., 2013).
The photometry pipeline also attempts to measure the total flux per band. This is carried out by modeling the axi-symmetric radial surface brightness using a Sérsic Function that fits the inner bulge light and the outer disk light. In this way, the model is integrated beyond the 1 isophote, extending to three disk scale lengths. The resulting total flux is typically within 5% of the isophotal flux for the W1 and W2 bands, but may be 10 to 25% larger for the W3 and W4 bands because of their relative insensitivity (Jarrett et al., 2017). Hence, when the galaxy surface brightness is well modeled, we use the total fluxes to represent the W3 and W4 integrated fluxes used for the star formation relations.
Both the W3 and W4 bands are excellent tracers of ISM emission, but they also have contributions from the evolved stellar populations. To estimate and remove this contribution, we use the method of Helou et al. (2004) in which the near-infrared band is used as a proxy for the stellar emission. Based on the SED template for a 13 Gyr galaxy (Silva et al., 1998) and the WISE filter transmission (Jarrett et al., 2011), we determine that 15.8% of the W1 light is contained in the W3 band, and 5.9% of the W1 light is in the W4 band. So, after scaling the W1 integrated flux densities by these factors and subtracting from the W3 and W4 total fluxes, respectively, we arrive at the ISM emission, accordingly: W3PAH and W4dust. Converting from flux density to luminosity then follows from 4d2 and scaling by the band center frequency, the so-called spectral luminosity, and , normalized by the solar luminosity ().
For the aggregate stellar mass, we use the GAMA-derived relations from (Cluver et al., 2014), which include a W1W2 color dependence. Here represents the luminosity relative to the Sun, in W1, also referred to as the “in-band” luminosity (Jarrett et al., 2013). It is important not to confuse the spectral luminosity, , used in the SFR relations, with the in-band luminosity which is the convention for stellar mass relations.
In Table 1, we present the WISE measurements of 76 galaxies in the combined SINGS/KINGFISH sample, i.e. all except HoI, HoII and HoIX. These dwarf, irregular galaxies are too faint and diffuse to measure reliably with WISE. The table features the W1 and W2 1 isophotal mags (indicated by a flag value 0) for most galaxies indicating that they are resolved, or in some isolated cases, the point-source mags (flag value 1); and for the W3 and W4 fluxes, the “total” mags (flag value 10) are shown when radial surface brightness solutions were possible. The brightest galaxy in the mid-infrared bands is the starburst galaxy, M82 (NGC3034), and the faintest detected is the dwarf, M81DwB.
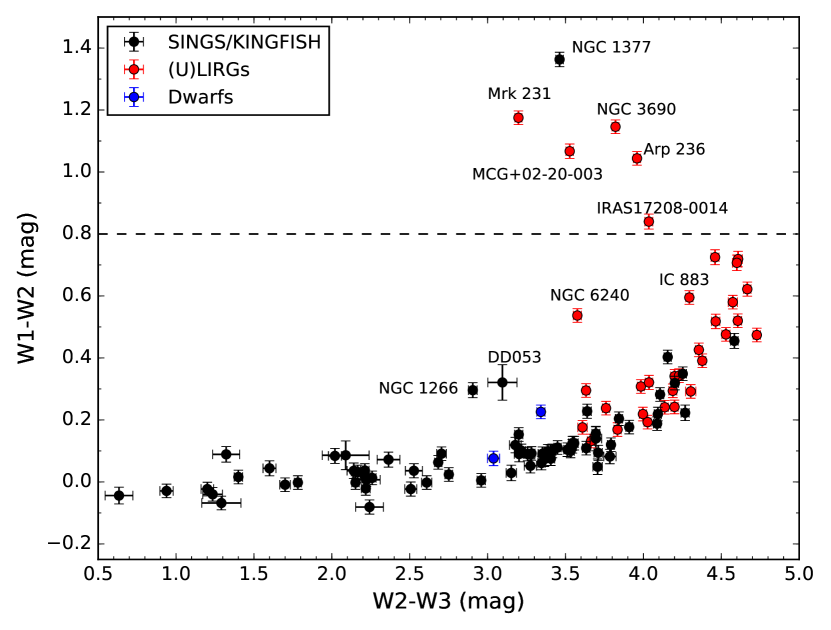
Table 2 contains the rest-frame derived properties of the SINGS/KINGFISH sample and includes determined using Equation 5 of Dale et al. (2014) i.e. combining 8µm, 24µm, 70µm, and 160µm, and the most recent SINGS/KINGFISH photometry (Dale et al., 2017). Here the rest frame fluxes are computed using a set of galaxy templates (Brown et al., 2014a) and SED fitting; see Jarrett et al. (2017) for more details. W3PAH and W4dust represent the ISM emission in the W3 and W4 bands (with the stellar emission subtracted). Spectral luminosities, used for SFRs, are indicated by ; and the W1 in-band luminosity, , is used for the stellar mass estimation. The most luminous galaxy in our SINGS/KINGFISH sample is the peculiar NGC 2146, which is indeed classified as a luminous infrared galaxy (LIRG).
2.3 Additional Galaxies
We supplement our sample with several dwarf galaxies and (Ultra) Luminous Infrared Galaxies, (U)LIRGs, drawn from IRAS studies (see Table 4 references), to better explore the behavior at the extremes of star-forming systems. Table 3 lists thirty-two (U)LIRGS and their WISE measurements. The values from the literature, restframe and derived properties are given in Table 4. A mix of star-forming, AGN, and hybrids thereof comprise this sample of (U)LIRGS. The requirement of dwarf galaxies to be well-measured in WISE , and have reliable from the literature, limits the sample to the two listed in Table 5, with their derived quantities given in Table 6.
3 Results
3.1 WISE colors
The WISE color-color diagram, shown in Figure 2, is a useful diagnostic tool for determining the underlying characteristics of a given sample (Wright et al. 2010; Jarrett et al. 2011). As in Figure 11 of Jarrett et al. (2017), the W2W3 color can be used as a broad proxy for morphology: galaxies with a color are typically spheroids (with little star formation), while star-forming disks usually have a color . On the other hand, the W1W2 color acts as a proxy for AGN activity; elevated W1W2 colors compared to the intrinsically tight trend typically indicate the presence of an AGN causing an excess of hot dust emission (Stern et al., 2012). In the case of our sample, the colors clearly define a star-forming sequence from dust-free (early types) to active star-formers (late-types).
Deviations arise from extreme activity, either star formation or AGN, or a combination of both (ULIRGs stand out in this way). For example, NGC 1266 is known to harbor an AGN (Alatalo et al., 2011) and this is likely why it sits slightly above the general trend in color space. Pointing to a separate issue, the elevated color of the dwarf galaxy DD053 is likely the result of contamination from a background source, located at 08h43m07.1s +66°10′57″, which has the characteristic color of an AGN. The source of its W1W2 color is therefore ambiguous.
An interesting case, the massive lenticular NGC 1377 is the only galaxy in the SINGS/KINGFISH sample with W1W2 indicating a global color dominated by emission from the dusty torus of an AGN. The W1W2 color is itself not a definitive discriminator of the presence or absence of an AGN (Gürkan et al., 2014), but elevated W1W2 colors indicate excess hot dust emission from an AGN with W1W2 implying global galaxy colors dominated by this emission. We would therefore expect the W3 and W4 luminosity, sensitive to star formation, to be contaminated by AGN emission.
NGC 1377 is an extreme far-infrared excess galaxy (Roussel et al., 2003) and has to date been considered to be a young, dusty starburst (Roussel et al., 2006) due to being an extreme (low) outlier in the radio-infrared correlation. However, recent ALMA, JVLA and Chandra observations suggest it is harbouring an extremely obscured AGN with a molecular jet (Aalto et al., 2016; Costagliola et al., 2016). Moreover, Spitzer IRS spectroscopy shows a steep, strong continuum with the largest silicate opacity of any SINGS source (Smith et al., 2007). In this instance, the WISE colors of the integrated emission supports the scenario of an obscured AGN.
The underlying heating source in cases such as these, where mid-infrared diagnostic emission lines are swamped by the continuum, will be ambiguous in the absence of other diagnostics – in this case WISE colors. For this reason, NGC 1377 is excluded from the star formation calibration determination in the next Section.
Unsurprisingly, several local (U)LIRGs show evidence of AGN-dominated (e.g. Mrk 231) or AGN-contaminated (e.g. NGC 6240) colors. For the remainder of this study we refer to the AGN-dominated WISE color (U)LIRG systems, i.e. with W1W2 colors above the Stern et al. (2012) line, as “AGN (U)LIRGs”, with the caveat that we cannot determine if extreme star-formation or AGN-heating is the dominant emission mechanism for these sources.
3.2 WISE Star Formation Rates: Relations and Performance
In this Section we explore the behavior of the WISE W3 (12µm) and W4 (23µm) luminosities as a measure of star formation for the SINGS/KINGFISH sample. Figure 3 shows the values plotted as a function of the and luminosities, respectively (here and throughout, and refer to and , respectively). The location of the (U)LIRG sample and additionally measured dwarf galaxies is also shown. For the vs diagram, a tight linear trend is observed, even down to low luminosities (). A best fit is given by:
| (1) |
with a 1- scatter of 0.15 dex.
At the high luminosity () end, however, the (U)LIRG sample tends towards higher values of , i.e. the W3 band is under-luminous. This suggests additional heating not being traced by the W3 band, or alternatively, the effect of strong silicate absorption in the W3 band. Curiously, the most luminous source in the entire ensemble, Mrk 231, a dusty and gas-rich broad-line QSO, falls exactly on the relation derived from star-forming galaxies several orders of magnitude less luminous.
In contrast to the W3 band, comparison of the luminosities to shows increased scatter, and the opposite behavior with extreme galaxies, i.e. the luminosity is over-luminous compared to the values for (U)LIRGs. This suggests that the W4 band has enhanced continuum emission relative to the far-infrared, likely boosted by dust-obscured AGN. The best fit relation for the SINGS/KINGFISH sample is:
| (2) |
with a 1- scatter of 0.18 dex.
Figure 4 examines the ratio of the WISE bands to as a function of increasing . In Figure 4a, NGC 4552 (Messier 89) is a clear outlier; it is an elliptical galaxy in the Virgo Cluster with little or no star formation (e.g. Shapiro et al., 2010), but with an infrared excess at 12µm relative to a dust-free elliptical (Brown et al., 2014a), detected by Herschel (di Serego Alighieri et al., 2013), and containing a “mini-AGN” (Cappellari et al., 1999). More distant galaxies of this type would not have a W3 detection.
Comparing Figure 4a and b, the W3 band shows a more constant response compared to W4, where higher produces correspondingly more 23µm emission. For W3, we see the (U)LIRG population turning over, unlike what is observed for W4 where the ratio appears to increase. This could be the result of silicate absorption in W3 preventing the continuum at 12µm from gaining power relative to .
Figure 4b suggests that for , the fractional power traced by W4 (the heating of small dust grains) compared to increases rapidly.
In the next step, we calibrate the W3 and W4 spectral luminosities of the SINGS/KINGFISH sample to star formation rates (SFRs) determined from the total infrared luminosity, . The SFR is determined using Equation 1.3 in Calzetti (2013), which uses the Starburst99 (Leitherer et al., 1999) models assuming solar metallicity, constant star formation over Myr, and a Kroupa IMF, as follows:
| (3) |
We note that this calibration assumes that the stellar emission, most notably the UV component, is entirely absorbed and re-radiated at infrared wavelengths, which constitutes an upper limit to what would occur in a real galaxy. Comparison of this relation to that of Murphy et al. (2011), who also use the Starburst99 models, yields a negligible difference.
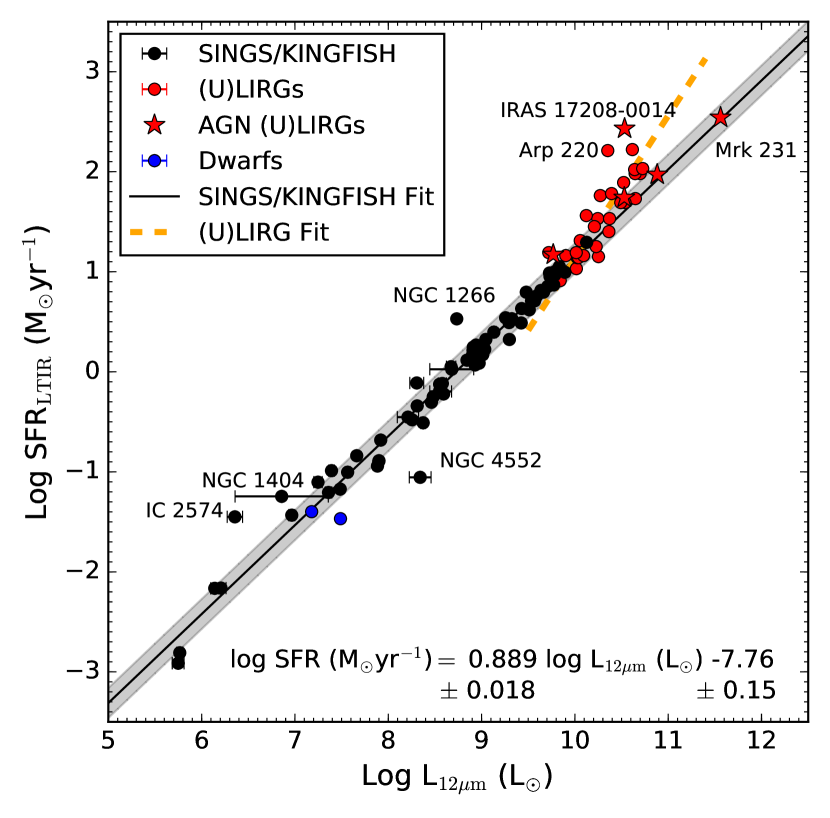
In Figure 5 we relate the SFR derived from (using Equation 1) to the luminosity and show the best fit to the SINGS/KINGFISH sample. The resulting fit is given by:
| (4) |
with a 1- scatter of 0.15 dex.
The overall trend is tight, with the exception of the outliers: NGC 1266, NGC 4552, and IC 2574. In the case of NGC 1266, the AGN activity is likely producing excess dust heating compared to what is traced in W3. The offset location of the dwarf irregular, IC 2574, could be due to the strong variations in dust temperature and characteristics found across the galaxy due to triggered star formation (Cannon et al., 2005).
The (U)LIRGs overplotted on Figure 5 show a trend to higher SFRs than what is seen for the fit to the SINGS/KINGFISH sample. A best fit to only the (U)LIRG sample is given by:
| (5) |
with a 1- scatter of 0.22 dex.
This suggests that the 12µm luminosity is underestimated compared to (see also Figure 3a) for the (U)LIRGs. The W3 band is sensitive to the silicate absorption feature expected to be common in the dusty, embedded starbursts powering the infrared emission of the (U)LIRGs and this likely diminishes the compared to .
Although the center of the W3 band is close to the 11.3µm PAH feature, the breadth of the band samples several features, as well as the continuum from warm, large grains and stochastically heated grains. On average, the total PAH emission in the band only accounts for of the 12µm flux (see Appendix A). Although associated with star formation, the strong radiation fields associated with nuclear starbursts and/or AGN would likely suppress PAH emission close in, where molecules are less shielded than they would be in a star-forming disk, however the hot dust would boost the continuum being traced by W3. Therefore the advantage of the 12µm WISE band as a SFR indicator appears to be its breadth thus sampling a mix of PAHs, nebular lines and continuum.
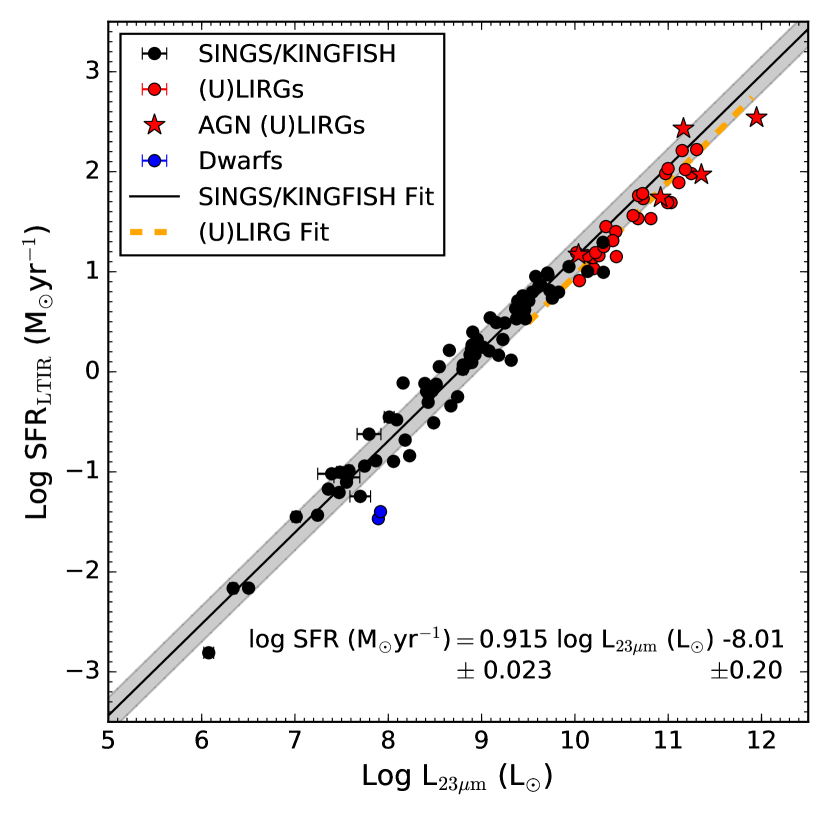
In Figure 6, a fit is derived between the -derived SFR and the luminosities of the SINGS/KINGFISH sample. The resulting fit is given by:
| (6) |
with a 1- scatter of 0.18 dex.
In the case of 23µm luminosity, a fit to the (U)LIRGs is given by:
| (7) |
with a 1- scatter of 0.13 dex. This indicates a marginal trend to lower SFRs than what is seen for the fit to the SINGS/KINGFISH sample, possibly due to increased 23µm emission due to obscured AGN activity or embedded star formation.
Comparing the fits of Figure 5 and 6, the 12µm relation appears to have less scatter and hold over 5 orders of magnitude of 12µm luminosity. The W4 band, which is dominated by the warm dust continuum, shows increased scatter and appears more curved (or at least, a strong break) at the extreme (LIRG) end, which agrees with Figure 4b.
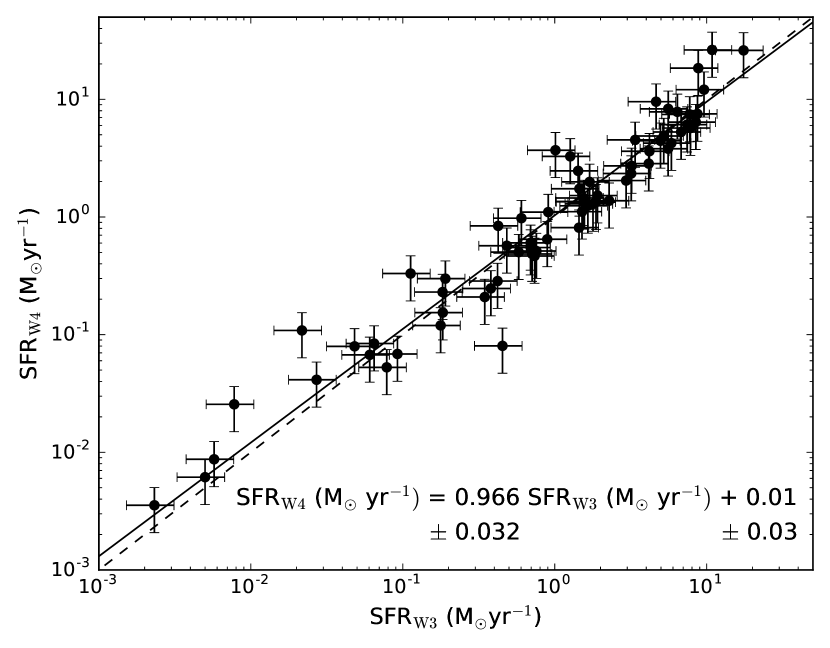
In Figure 7 we compare the SFRs for the SINGS/KINGFISH sample determined using Equations 2 and 3, respectively. Although the points show some scatter, overall they are consistent with respect to the one-to-one relation over several orders of magnitude of SFR. A fit to the points is given by:
| (8) |
with a 1- scatter of 0.0001 dex.
Finally, we explore the effect of metallicity on, in particular, the luminosity relation. Since PAH features can be affected by the strong radiation fields associated with low metallicity systems (Smith et al., 2007) and given the contribution of PAHs to the W3 band, we color code the galaxies in the SINGS/KINGFISH sample according to their oxygen [O/H] metallicities, as given by Moustakas et al. (2010). In Figure 8a the abundances are calculated (where possible) using the Kobulnicky & Kewley (2004) calibration, whereas in 12b, the metallicity is estimated from the B-band luminosity (and is therefore available for all galaxies in the SINGS/KINGFISH sample). From Figure 8 it is evident that for the metallicities probed in this sample, there does not appear to be a systematic effect on the SINGS/KINGFISH SFR relation. However, we do not expect this SFR calibration to hold for lower metallicity environments.
3.3 Comparison to other WISE SFR relations
In Figure 9 we compare the SFR relations derived in Section 3.2 to those in the literature that similarly make use of WISE resolved source photometry. We list in Table 7 and Table 8, the source of these relations for W3 and W4, respectively, the calibrators used and the adopted IMF. Apart from the Brown et al. (2017) relation where a conversion to a Kroupa (2002) IMF has been applied, we have made no attempt to take into account differences in IMF and calibrator in order to illustrate the breadth of uncertainty in any given SFR, depending on the chosen relation. See Brown et al. (2017) for a broader listing of SFR relations from the literature.
The differences due to using either the W3 or W4 band are also apparent. For W4, relations calibrated against Hα-derived SFRs (Cluver et al., 2014; Catalán-Torrecilla et al., 2015; Brown et al., 2017) appear to agree within the expected scatter. However, the W3 relations show little consistency, suggesting that the choice of sample and calibrator may cause significant variation.
| Reference | Calibrator | SFR Conversion | Adopted IMF |
|---|---|---|---|
| Jarrett et al. (2013) | 24µm | Rieke et al. (2009) | Rieke et al. (1993) |
| Cluver et al. (2014) | Hα | Wijesinghe et al. (2011) | Baldry & Glazebrook (2003)) |
| Davies et al. (2016) | Radiative Transfer | Grootes et al. (2017) | Chabrier (2003) |
| Brown et al. (2017) | Hα | Kennicutt et al. (2009) | Chabrier (2003) |
| Reference | Calibrator | SFR Conversion | Adopted IMF |
|---|---|---|---|
| Jarrett et al. (2013) | 24µm | Rieke et al. (2009) | Rieke et al. (1993) |
| Cluver et al. (2014) | Hα | Wijesinghe et al. (2011) | Baldry & Glazebrook (2003) |
| Catalán-Torrecilla et al. (2015)a | Hα | Kennicutt et al. (2009) | Kroupa (2002) |
| Davies et al. (2016) | Radiative Transfer | Grootes et al. (2017) | Chabrier (2003) |
| Brown et al. (2017) | Hα | Kennicutt et al. (2009) | Chabrier (2003) |
Note. — a The log-scale fit is used here for comparison.
3.4 Comparison to other wavelengths
In this Section we compare the 12µm- and 23µm-derived SFRs, using Equations 2 and 3, respectively, to SFRs derived using H24µm, radio continuum and UVIR measurements.
In Kennicutt et al. (2009) the authors provide a hybrid calibration that combines observed H and 24µm luminosities as a proxy for dust attenuation-corrected H. We use the H fluxes given in Kennicutt et al. (2009) for the SINGS galaxies and combine them with the Spitzer MIPS 24µm fluxes given by Dale et al. (2017). In addition, we use the H spectro-photometric fluxes for 15 SINGS galaxies included in Moustakas & Kennicutt (2006). Employing the mid-infrared Kennicutt et al. (2009) coefficient that corrects H for attenuation, in Figure 11a we compare the combined H and 24µm luminosities to the 12µm luminosities and find a linear fit for the H sample given by:
| (9) |
with a 1- scatter of 0.26 dex. We note that although there is considerable scatter, the W3 luminosity is proportional to the H luminosity over nearly 3 orders of magnitude. Comparison of this relation to that of Brown et al. (2017), which compares to that of Balmer Decrement extinction-corrected H, we find that our relation is marginally flatter, but broadly consistent.
Using the conversion to SFR, assuming a Kroupa IMF, given by Kennicutt et al. (2009), i.e.
| (10) |
allows us to compare SFR relations (Figure 10). The linear best-fit is given by:
| (11) |
with a 1- scatter of 0.23 dex.
The distribution of points and best-fit relation shows a systematic effect where the 12µm-derived SFRs (using Equation 2) are higher than those given by Hm for SFRs M⊙yr-1).
In Figure 11 we show the comparison with 23µm instead of 12µm. The Hm luminosities as a function of (Figure 11a) show a clear linear trend given by:
| (12) |
with a 1- scatter of 0.18 dex. Note the much tighter relation of W4 with Hm as compared to that with W3.
Using the same SFR conversion for as above, and the WISE 23µm relation given by Equation (4), we find that the SFRs are related by the equation:
| (13) |
with a 1- scatter of 0.10 dex.
The tightness in the relation is likely at least partially due to the similarities between the WISE 23µm and the MIPS 24µm band such that the x and y axes are not fully independent of each other. As in Figure 10b, Figure 11b shows that the -derived SFR is systematically higher than what the Hm predicts (for SFR M⊙yr-1). Since the luminosities agree so well, the SFR differences are therefore due to the scaling between luminosity (e.g., ) and SFR.
Next we explore how the -derived SFRs compare to those using 20cm radio continuum observations. For the SINGS/KINGFISH sample we use the 20cm fluxes from Dale et al. (2017), where available, except for NGC 584 whose flux is taken from Brown et al. (2011), NGC 1512 from Koribalski & López-Sánchez (2009), NGC 3077 from Condon et al. (1998), Mrk 33 from Bravo-Alfaro et al. (2004), and NGC 5195 from Condon et al. (2002). To convert to a radio continuum SFR, we employ the relation (Equation 17) of Murphy et al. (2011); this also assumes a Kroupa IMF. The comparison is shown in Figure 12, with the 12µm SFR comparison in panel (a) and the 23µm comparison in (b). The fit for the 12µm comparison is given by:
| (14) |
with a 1- scatter of 0.26 dex.
Although the distribution of points in Figure 12a and b appear different (with a clear outlier of NGC 4552 in Figure 12b), we obtain a very similar fit for the 23µm relation, given by:
| (15) |
with a 1- scatter of 0.26 dex.
In addition, both Figure 12a and b indicate a similar behavior compared to the one-to-one relation (dashed lines) where concordance appears closest for SFRs M⊙ yr-1 with increasing scatter towards lower SFR. However, with so few data points at low SFRs, comparisons in this regime are unadvisable.
Heesen et al. (2014) used 17 THINGS (The H i Nearby Galaxy Survey; Walter et al., 2008) galaxies, observed as part of the Westerbork Synthesis Radio Telescope (WRST) SINGS sample, (Braun et al., 2007) to investigate the spatially resolved radio continuum (22 cm) SFR compared to a “hybrid” combination of GALEX FUV and Spitzer 24µm maps, tracing unobscured and obscured star formation, respectively. We use their integrated star formation rates for galaxies in common to our SINGS/KINGFISH sample (14 galaxies) for comparison and plot the -derived SFRs versus radio continuum SFRs in Figure 13, and the comparison to the “hybrid” SFR in Figure 14.
The best fit SFR relation in Figure 13a is given by:
| (16) |
with a 1- scatter of 3.9e-5 dex,
and for Figure 13b:
| (17) |
with a 1- scatter of 1.5e-5 dex.
Comparing these to Equations (14) and (15), respectively, we note the similarity of the -radio continuum SFR relations, the only marked difference being the very small scatter reflected by Figure 13 a and b. In addition, we see a remarkably similar behavior when considering the one-to-one relation, with the 12µm- and 23µm-derived SFRs systematically tending towards higher values of SFR as the SFR decreases.
In Figure 14 we consider the “hybrid” SFR indicator of FUV24µm, which shows remarkably close correspondence to a one-to-one relation.
The best fit SFR relation in Figure 14a is given by:
| (18) |
with a 1- scatter of 0.19 dex,
and for Figure 14b:
| (19) |
with a 1- scatter of 0.11 dex.
Considering that in Figure 14a we are using entirely independent methods and tracers to compare SFRs, this result illustrates the utility of W3-derived SFRs, although additional data points would allow for a more substantive comparison.
3.5 Specific Star Formation in SINGS/KINGSFISH
Here we use the SFR, derived using the W3 luminosity and Equation (2), in combination with the stellar mass relation of Cluver et al. (2014) to explore star formation in relation to stellar mass in the SINGS/KINGFISH sample.
In Figure 15a we plot SFR as a function of stellar mass, color coding galaxies by their W2W3 color, and include the “Main Sequence” relations for local galaxies () from Elbaz et al. (2007) and Bauermeister et al. (2013), who choose their relation to be consistent with that of Bouché et al. (2010), Karim et al. (2011) and Elbaz et al. (2011). We also include the fit from the Spitzer Local Volume Legacy (LVL) study (Cook et al., 2014) and the GAMA-G12 study of Jarrett et al. (2017). As we have color-coded by W2W3 colour, the bluer colors represent low star-forming, spheroidal systems. As indicated by this figure, these systems occupy both the low mass and high mass regions of the diagram: dwarf spheroids lie at the low mass end experiencing relatively low star formation, while elliptical galaxies with high mass and low (quenched) to non-existent star formation, are at the other end. For intermediate W2W3 color, the LVL relation of Cook et al. (2014) matches the SINGS/KINGFISH most closely, while the other relations do better for the higher star-forming systems, where W2W3 .
An alternative view is presented in Figure 15b where we show specific SFR (sSFR; SFR divided by stellar mass) versus stellar mass, once again color-coded by W2W3 color. From this diagram we see a clear separation as a function of star formation, where systems with high specific star formation have W2W3 colors and stellar masses between 109 and 1011 M⊙. Systems with low specific star formation have W2W3 colors and typically have masses 1011 M⊙. An intermediate band appears between log sSFR of -10 and -11, exhibiting a broad range of stellar mass and W2W3 colors between 1.5 and 3.
4 Discussion
The Spitzer Space Telescope enabled detailed study of SFR indicators in the mid-infrared and extensively investigated the use of monochromatic tracers of star formation. The MIPS 24µm band measures the warm dust continuum and is relatively uncontaminated by emission line and aromatic features, similar to the WISE 23µm band, and can be related to , and therefore SFR as shown in Rujopakarn et al. (2013). However, this tracer is sensitive to the presence of an AGN, which produces an excess of continuum emission, as well as the dust geometry in relation to the heating source (Farrah et al., 2008).
As shown in Section 3.2, the WISE W3 band shows a tighter correlation with SFR in the absence of strong silicate absorption usually associated with embedded starbursts, i.e. coupled to a significant dust column (e.g. local ULIRGs; Desai et al., 2007). Although the center of this band is close to the 11.3µm PAH feature, as discussed in Appendix A, the fractional contribution of the 11.3µm PAH feature is relatively low – the largest contribution being 11.6% for NGC 4559. In terms of total PAH contribution to W3, this varies from 2.9% (NGC 584) to 52.6% (NGC 925).
Although PAH features do trace star formation (Förster Schreiber et al., 2004; Houck et al., 2007; Diamond-Stanic & Rieke, 2012; Alonso-Herrero et al., 2014; Shipley et al., 2016), hard radiation fields destroy PAHs, and as a result AGN and low metallicity environments significantly suppress PAH emission (Smith et al., 2007). PAH emission varies depending on the physical conditions of a given star-forming region, and is therefore not constant across a galaxy (Smith et al., 2007; Draine & Li, 2007).
Figure 4a shows the steady response of the W3 band as increases, yielding a tight correlation (Figure 5) extending to even relatively extreme star-forming systems. Although we do not probe very low metallicity environments in our sample, the lack of influence of metallicity on the W3 SFR relation is consistent with the fact that the 11.3µm PAH feature and combined PAH contribution to the band is ameliorated by the more substantial contributions from the continuum arising from warm, large grains (Appendix A).
The relation between W3 and suggests that W3 must be sampling a range of excitation sources to closely mimic the behaviour of the total infrared emission of the galaxy. The warm, large grains and stochastically heated grains, as well as the PAH features (Li & Draine, 2002), will be powered by contributions from both hot and cool stars, similar to . However, we would not expect this relation to hold for sub-regions of a galaxy where variations in dust composition, temperature and PAH characteristics would likely produce large fluctuations.
5 Conclusions
In this paper we have derived star formation relations that rely exclusively on the 12µm and 23µm bands of , calibrated to . The W3 relation in particular shows a tight correlation, that suggests it could be as reliable as as a SFR indicator, over nearly 5 orders of magnitude in star formation and 12µm luminosity, and similarly, stellar mass range, 107 M⊙ to 1011.5 M⊙. For the most extreme infrared-luminous galaxies, the WISE W3 and W4 relations may be, respectively, under-estimating and over-estimating the star formation activity.
The W3 band appears to be a reliable SFR measure in the absence of strong silicate absorption common in compact, dust-embedded starbursts, and powerful AGN. Taking these caveats into consideration, the benefit of using a SFR tracer unaffected by uncertainties due to dust extinction corrections may well be a key consideration for large area surveys in the future.
The tight relationship we have found between and , and the known correlation that exists between the mid-infrared 24µm and radio continuum (e.g. Appleton et al., 2004), suggests that the W3 band can be used in combination with upcoming sensitive, large-area radio surveys to disentangle star formation and AGN heating.
Appendix A WISE Spectral Bands
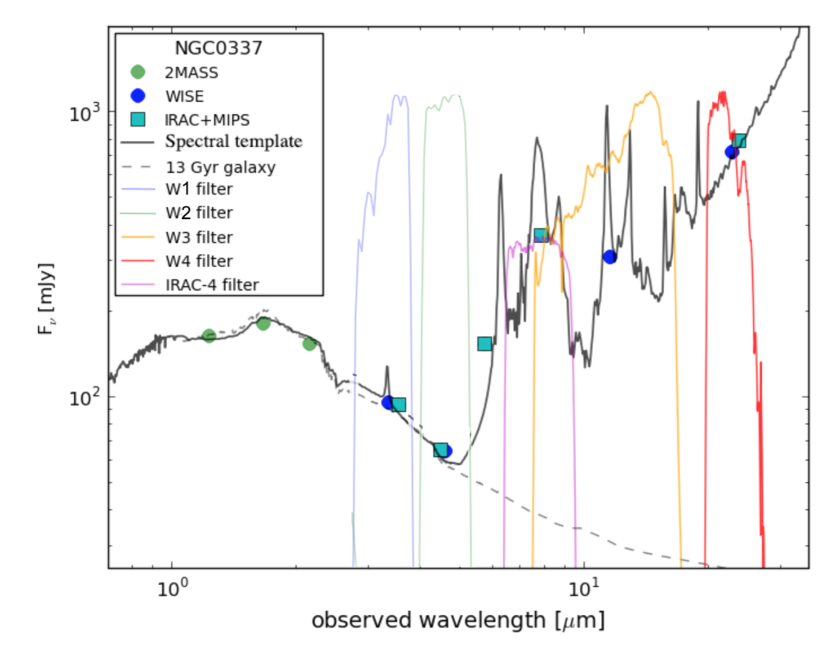
The WISE relative system response curves are given in Jarrett et al. (2011), comprising four bands centered on 3.4, 4.6, 12 and 23µm in the infrared window. The first two are essentially the near-infrared, sensitive to the evolved populations in galaxies, while the second two are mid-infrared ISM bands. W3 is notably broad in spectral coverage, as demonstrated in Fig.16, showing the spectral energy distribution (SED) of the SINGS galaxy, NGC 337. As a late-type barred spiral, NGC 337 has active star formation, exhibiting strong molecular (PAHs) and thermal (dust) continuum emission. The W3 band encompasses the 7.7µm and 8.5µm PAH features (typically traced by the IRAC-4 band), the 10µm silicate absorption, 11.3µm PAH band, 12.8m Ne ii and 15.7µm Ne iii nebular emission.
Convolving SINGS global spectra with the W3 response function and measuring the fractional contribution of the 11.3µm PAH indicates that it only contributes (on average) 7.5% to the W3 flux (J.D.T Smith, private communication). Taking into account all PAH features, this increases to 34%. The contribution from emission lines is 3.5% on average. The W3 band is therefore dominated by non-PAH continuum, coming from warm, large grains and stochastically heated grains.
For example, NGC 337 (Figure 16), has a fractional contribution of 45.3% from all PAH features, 10.4% from the 11.3µm PAH and 5.0% from the nebular emission lines. The most IR-luminous galaxy in the sample, NGC 7331, has a fractional contribution of 37.4% from all PAH features, 8.5% from the 11.3µm PAH and 2.4% from the nebular emission lines.
The dwarf galaxy NGC 1705 has, in comparison, a fractional contribution of 21.5% from all PAH features, 7.6% from the 11.3µm PAH and 13.3% from the nebular emission lines
References
- Aalto et al. (2016) Aalto, S., Costagliola, F., Muller, S., et al. 2016, A&A, 590, A73
- Alatalo et al. (2011) Alatalo, K., Blitz, L., Young, L. M., et al. 2011, ApJ, 735, 88
- Alonso-Herrero et al. (2014) Alonso-Herrero, A., Ramos Almeida, C., Esquej, P., et al. 2014, MNRAS, 443, 2766
- Appleton et al. (2004) Appleton, P. N., Fadda, D. T., Marleau, F. R., et al. 2004, ApJS, 154, 147
- Armus et al. (2009) Armus, L., Mazzarella, J. M., Evans, A. S., et al. 2009, PASP, 121, 559
- Baldry & Glazebrook (2003) Baldry, I. K., & Glazebrook, K. 2003, ApJ, 593, 258
- Bauermeister et al. (2013) Bauermeister, A., Blitz, L., Bolatto, A., et al. 2013, ApJ, 763, 64
- Bigiel et al. (2008) Bigiel, F., Leroy, A., Walter, F., et al. 2008, AJ, 136, 2846
- Boquien et al. (2016) Boquien, M., Kennicutt, R., Calzetti, D., et al. 2016, A&A, 591, A6
- Bouché et al. (2010) Bouché, N., Dekel, A., Genzel, R., et al. 2010, ApJ, 718, 1001
- Boselli et al. (2015) Boselli, A., Fossati, M., Gavazzi, G., et al. 2015, A&A, 579, A102
- Braun et al. (2007) Braun, R., Oosterloo, T. A., Morganti, R., Klein, U., & Beck, R. 2007, A&A, 461, 455
- Bravo-Alfaro et al. (2004) Bravo-Alfaro, H., Brinks, E., Baker, A. J., Walter, F., & Kunth, D. 2004, AJ, 127, 264
- Brown et al. (2017) Brown, M.J.I., Moustakas, J., Kennicutt, R., et al. 2017, ApJ, 847, 2
- Brown et al. (2014a) Brown, M. J. I., Moustakas, J., Smith, J.-D. T., et al. 2014, ApJS, 212, 18
- Brown et al. (2014b) Brown, M. J. I., Jarrett, T. H., & Cluver, M. E. 2014, PASA, 31, HASH
- Brown et al. (2011) Brown, M. J. I., Jannuzi, B. T., Floyd, D. J. E., & Mould, J. R. 2011, ApJ, 731, L41
- Buat et al. (1999) Buat, V., Donas, J., Milliard, B., & Xu, C. 1999, A&A, 352, 371
- Calzetti (2013) Calzetti, D. 2013, Secular Evolution of Galaxies, 419
- Calzetti et al. (2010) Calzetti, D., Wu, S.-Y., Hong, S., et al. 2010, ApJ, 714, 1256
- Calzetti et al. (2007) Calzetti, D., Kennicutt, R. C., Engelbracht, C. W., et al. 2007, ApJ, 666, 870
- Calzetti et al. (1995) Calzetti, D., Bohlin, R. C., Kinney, A. L., Storchi-Bergmann, T., & Heckman, T. M. 1995, ApJ, 443, 136
- Cannon et al. (2005) Cannon, J. M., Walter, F., Bendo, G. J., et al. 2005, ApJ, 630, L37
- Cappellari et al. (1999) Cappellari, M., Renzini, A., Greggio, L., et al. 1999, ApJ, 519, 117
- Casasola et al. (2017) Casasola, V., Cassarà, L. P., Bianchi, S., et al. 2017, A&A, 605, A18
- Casasola et al. (2015) Casasola, V., Hunt, L., Combes, F., & García-Burillo, S. 2015, A&A, 577, A135
- Catalán-Torrecilla et al. (2015) Catalán-Torrecilla, C., Gil de Paz, A., Castillo-Morales, A., et al. 2015, A&A, 584, A87
- Chabrier (2003) Chabrier, G. 2003, PASP, 115, 763
- Cluver et al. (2014) Cluver, M. E., Jarrett, T. H., Hopkins, A. M., et al. 2014, ApJ, 782, 90
- Condon et al. (2002) Condon, J. J., Cotton, W. D., & Broderick, J. J. 2002, AJ, 124, 675
- Condon et al. (1998) Condon, J. J., Cotton, W. D., Greisen, E. W., et al. 1998, AJ, 115, 1693
- Cook et al. (2014) Cook, D. O., Dale, D. A., Johnson, B. D., et al. 2014, MNRAS, 445, 899
- Cortese (2012) Cortese, L. 2012, A&A, 543, A132
- Costagliola et al. (2016) Costagliola, F., Herrero-Illana, R., Lohfink, A., et al. 2016, A&A, 594, A114
- Cutri et al. (2013) Cutri, R. M., et al. 2013, VizieR Online Data Catalog, 2328,
- da Cunha et al. (2008) da Cunha, E., Charlot, S., & Elbaz, D. 2008, MNRAS, 388, 1595
- di Serego Alighieri et al. (2013) di Serego Alighieri, S., Bianchi, S., Pappalardo, C., et al. 2013, A&A, 552, A8
- Dale et al. (2017) Dale, D. A., Cook, D. O., Roussel, H., et al. 2017, ApJ, 837, 90
- Dale et al. (2014) Dale, D. A., Helou, G., Magdis, G. E., et al. 2014, ApJ, 784, 83
- Dale & Helou (2002) Dale, D. A., & Helou, G. 2002, ApJ, 576, 159
- Davies et al. (2017) Davies, J. I., Baes, M., Bianchi, S., et al. 2017, PASP, 129, 044102
- Davies et al. (2016) Davies, L. J. M., Driver, S. P., Robotham, A. S. G., et al. 2016, MNRAS, 461, 458
- De Looze et al. (2011) De Looze, I., Baes, M., Bendo, G. J., Cortese, L., & Fritz, J. 2011, MNRAS, 416, 2712
- Desai et al. (2007) Desai, V., Armus, L., Spoon, H. W. W., et al. 2007, ApJ, 669, 810
- Diamond-Stanic & Rieke (2012) Diamond-Stanic, A. M., & Rieke, G. H. 2012, ApJ, 746, 168
- Draine & Li (2007) Draine, B. T., & Li, A. 2007, ApJ, 657, 810
- Elbaz et al. (2011) Elbaz, D., Dickinson, M., Hwang, H. S., et al. 2011, A&A, 533, A119
- Elbaz et al. (2007) Elbaz, D., Daddi, E., Le Borgne, D., et al. 2007, A&A, 468, 33
- Farrah et al. (2008) Farrah, D., Lonsdale, C. J., Weedman, D. W., et al. 2008, ApJ, 677, 957-969
- Fischer et al. (2010) Fischer, J., Sturm, E., González-Alfonso, E., et al. 2010, A&A, 518, L41
- Ford et al. (2013) Ford, G. P., Gear, W. K., Smith, M. W. L., et al. 2013, ApJ, 769, 55
- Förster Schreiber et al. (2004) Förster Schreiber, N. M., Roussel, H., Sauvage, M., & Charmandaris, V. 2004, A&A, 419, 501
- Gao et al. (2001) Gao, Y., Lo, K. Y., Lee, S.-W., & Lee, T.-H. 2001, ApJ, 548, 172
- Goldader et al. (1995) Goldader, J. D., Joseph, R. D., Doyon, R., & Sanders, D. B. 1995, ApJ, 444, 97
- Grootes et al. (2017) Grootes, M. W., Tuffs, R. J., Popescu, C. C., et al. 2017, AJ, 153, 111
- Gürkan et al. (2014) Gürkan, G., Hardcastle, M. J., & Jarvis, M. J. 2014, MNRAS, 438, 1149
- Hao et al. (2011) Hao, C.-N., Kennicutt, R. C., Johnson, B. D., et al. 2011, ApJ, 741, 124
- Heesen et al. (2014) Heesen, V., Brinks, E., Leroy, A. K., et al. 2014, AJ, 147, 103
- Helou et al. (2004) Helou, G., Roussel, H., Appleton, P., et al. 2004, ApJS, 154, 253
- Houck et al. (2007) Houck, J. R., Weedman, D. W., Le Floc’h, E., & Hao, L. 2007, ApJ, 671, 323
- Huang & Kauffmann (2015) Huang, M.-L., & Kauffmann, G. 2015, MNRAS, 450, 1375
- Iglesias-Páramo et al. (2013) Iglesias-Páramo, J., Vílchez, J. M., Galbany, L., et al. 2013, A&A, 553, L7
- Jarrett et al. (2017) Jarrett, T. H., Cluver, M.E., et al. 2017, ApJsubmitted
- Jarrett et al. (2013) Jarrett, T. H., Masci, F., Tsai, C. W., et al. 2013, AJ, 145, 6
- Jarrett et al. (2012) Jarrett, T. H., Masci, F., Tsai, C. W., et al. 2012, AJ, 144, 68
- Jarrett et al. (2011) Jarrett, T. H., Cohen, M., Masci, F., et al. 2011, ApJ, 735, 112
- Karim et al. (2011) Karim, A., Schinnerer, E., Martínez-Sansigre, A., et al. 2011, ApJ, 730, 61
- Kennicutt et al. (2011) Kennicutt, R. C., Calzetti, D., Aniano, G., et al. 2011, PASP, 123, 1347
- Kennicutt et al. (2009) Kennicutt, R. C., Jr., Hao, C.-N., Calzetti, D., et al. 2009, ApJ, 703, 1672-1695
- Kennicutt et al. (2007) Kennicutt, R. C., Jr., Calzetti, D., Walter, F., et al. 2007, ApJ, 671, 333
- Kennicutt et al. (2003) Kennicutt, R. C., Jr., Armus, L., Bendo, G., et al. 2003, PASP, 115, 928
- Kennicutt (1998) Kennicutt, R. C., Jr. 1998, ARA&A, 36, 189
- Kessler et al. (2003) Kessler, M. F., Mueller, T. G., Leech, K., et al. 2003, ‘The ISO Handbook’, Volume I - Mission & Satellite Overview. Version 2.0 (July, 2003). Series edited by T.G. Mueller, J.A.D.L. Blommaert, and P. Garcia-Lario. ESA SP-1262, ISBN No. 92-9092-968-5, ISSN No. 0379-6566. European Space Agency, 2003.
- Kobulnicky & Kewley (2004) Kobulnicky, H. A., & Kewley, L. J. 2004, ApJ, 617, 240
- Koribalski & López-Sánchez (2009) Koribalski, B. S., & López-Sánchez, Á. R. 2009, MNRAS, 400, 1749
- Kroupa (2002) Kroupa, P. 2002, Science, 295, 82
- Lee et al. (2013) Lee, J. C., Hwang, H. S., & Ko, J. 2013, ApJ, 774, 62
- Leitherer et al. (1999) Leitherer, C., Schaerer, D., Goldader, J. D., et al. 1999, ApJS, 123, 3
- Leroy et al. (2008) Leroy, A. K., Walter, F., Brinks, E., et al. 2008, AJ, 136, 2782
- Li & Draine (2002) Li, A., & Draine, B. T. 2002, ApJ, 572, 232
- Mainzer et al. (2014) Mainzer, A., Bauer, J., Cutri, R. M., et al. 2014, ApJ, 792, 30
- Martin et al. (2005) Martin, D. C., Fanson, J., Schiminovich, D., et al. 2005, ApJ, 619, L1
- Masci (2013) Masci, F. 2013, Astrophysics Source Code Library, ascl:1302.010
- Momose et al. (2013) Momose, R., Koda, J., Kennicutt, R. C., Jr., et al. 2013, ApJ, 772, L13
- Moustakas et al. (2010) Moustakas, J., Kennicutt, R. C., Jr., Tremonti, C. A., et al. 2010, ApJS, 190, 233-266
- Moustakas & Kennicutt (2006) Moustakas, J., & Kennicutt, R. C., Jr. 2006, ApJS, 164, 81
- Murphy et al. (2011) Murphy, E. J., Condon, J. J., Schinnerer, E., et al. 2011, ApJ, 737, 67
- Natale et al. (2014) Natale, G., Popescu, C. C., Tuffs, R. J., & Semionov, D. 2014, MNRAS, 438, 3137
- Neugebauer et al. (1984) Neugebauer, G., Habing, H. J., van Duinen, R., et al. 1984, ApJ, 278, L1
- Noll et al. (2009) Noll, S., Burgarella, D., Giovannoli, E., et al. 2009, A&A, 507, 1793
- Pilbratt et al. (2010) Pilbratt, G. L., Riedinger, J. R., Passvogel, T., et al. 2010, A&A, 518, L1
- Planck Collaboration et al. (2016) Planck Collaboration, Adam, R., Ade, P. A. R., et al. 2016, A&A, 594, A1
- Popescu et al. (2000) Popescu, C. C., Misiriotis, A., Kylafis, N. D., Tuffs, R. J., & Fischera, J. 2000, A&A, 362, 138
- Rahman et al. (2011) Rahman, N., Bolatto, A. D., Wong, T., et al. 2011, ApJ, 730, 72
- Richards et al. (2016) Richards, S. N., Bryant, J. J., Croom, S. M., et al. 2016, MNRAS, 455, 2826
- Rieke et al. (2009) Rieke, G. H., Alonso-Herrero, A., Weiner, B. J., et al. 2009, ApJ, 692, 556
- Rieke et al. (1993) Rieke, G. H., Loken, K., Rieke, M. J., & Tamblyn, P. 1993, ApJ, 412, 99
- Robotham & Obreschkow (2015) Robotham, A. S. G., & Obreschkow, D. 2015, PASA, 32, e033
- Roussel et al. (2006) Roussel, H., Helou, G., Smith, J. D., et al. 2006, ApJ, 646, 841
- Roussel et al. (2003) Roussel, H., Helou, G., Beck, R., et al. 2003, ApJ, 593, 733
- Rujopakarn et al. (2013) Rujopakarn, W., Rieke, G. H., Weiner, B. J., et al. 2013, ApJ, 767, 73
- Sanders et al. (2003) Sanders, D. B., Mazzarella, J. M., Kim, D.-C., Surace, J. A., & Soifer, B. T. 2003, AJ, 126, 1607
- Sandstrom et al. (2010) Sandstrom, K. M., Bolatto, A. D., Draine, B. T., Bot, C., & Stanimirović, S. 2010, ApJ, 715, 701
- Shapiro et al. (2010) Shapiro, K. L., Falcón-Barroso, J., van de Ven, G., et al. 2010, MNRAS, 402, 2140
- Shipley et al. (2016) Shipley, H. V., Papovich, C., Rieke, G. H., Brown, M. J. I., & Moustakas, J. 2016, ApJ, 818, 60
- Silva et al. (1998) Silva, L., Granato, G. L., Bressan, A., & Danese, L. 1998, ApJ, 509, 103
- Smith et al. (2007) Smith, J. D. T., Draine, B. T., Dale, D. A., et al. 2007, ApJ, 656, 770
- Stern et al. (2012) Stern, D., Assef, R. J., Benford, D. J., et al. 2012, ApJ, 753, 30
- Takeuchi et al. (2005) Takeuchi, T. T., Buat, V., Iglesias-Páramo, J., Boselli, A., & Burgarella, D. 2005, A&A, 432, 423
- Walter et al. (2008) Walter, F., Brinks, E., de Blok, W. J. G., et al. 2008, AJ, 136, 2563-2647
- Werner et al. (2004) Werner, M. W., Roellig, T. L., Low, F. J., et al. 2004, ApJS, 154, 1
- Wijesinghe et al. (2011) Wijesinghe, D. B., da Cunha, E., Hopkins, A. M., et al. 2011, MNRAS, 415, 1002
- Wright et al. (2010) Wright, E. L., Eisenhardt, P. R. M., Mainzer, A. K., et al. 2010, AJ, 140, 1868-1881
- Wu et al. (2005) Wu, H., Cao, C., Hao, C.-N., et al. 2005, ApJ, 632, L79
- Zhu et al. (2008) Zhu, Y.-N., Wu, H., Cao, C., & Li, H.-N. 2008, ApJ, 686, 155-171
| Galaxy | W1 | W1f | W2 | W2f | W3 | W3f | W4 | W4f | Radius | b/a | P.A. |
|---|---|---|---|---|---|---|---|---|---|---|---|
| (mag) | (mag) | (mag) | (mag) | (arcsec) | (deg.) | ||||||
| NGC0024 | 8.66 0.011 | 0 | 8.682 0.02 | 0 | 6.176 0.033 | 10 | 4.49 0.06 | 10 | 187.97 | 0.296 | 45.1 |
| NGC0337 | 8.777 0.011 | 0 | 8.552 0.02 | 0 | 4.912 0.017 | 10 | 2.549 0.02 | 10 | 101.98 | 0.622 | 131.8 |
| NGC0584 | 7.19 0.011 | 0 | 7.247 0.019 | 0 | 6.781 0.05 | 10 | 5.757 0.107 | 10 | 190.32 | 0.784 | 70.6 |
| NGC0628 | 6.442 0.011 | 0 | 6.332 0.019 | 0 | 2.701 0.015 | 10 | 0.882 0.018 | 10 | 324.47 | 0.819 | 86.4 |
| NGC0855 | 9.665 0.012 | 0 | 9.592 0.021 | 0 | 7.229 0.07 | 10 | 4.976 0.048 | 10 | 106.47 | 0.446 | 65.0 |
| NGC0925 | 7.57 0.011 | 0 | 7.517 0.02 | 0 | 4.243 0.034 | 10 | 2.252 0.058 | 10 | 311.71 | 0.501 | 110.1 |
| NGC1097 | 5.983 0.011 | 0 | 5.882 0.019 | 0 | 2.469 0.013 | 10 | 0.131 0.014 | 10 | 322.65 | 0.792 | 112.9 |
| NGC1266 | 9.385 0.012 | 0 | 9.091 0.021 | 0 | 6.199 0.018 | 10 | 2.557 0.016 | 10 | 65.89 | 0.733 | 115.4 |
| NGC1291 | 5.35 0.011 | 0 | 5.391 0.019 | 0 | 4.156 0.06 | 10 | 3.043 0.102 | 10 | 431.86 | 0.987 | 55.1 |
| NGC1316 | 5.079 0.011 | 0 | 5.102 0.019 | 0 | 4.17 0.038 | 10 | 2.783 0.047 | 10 | 768.93 | 0.645 | 34.7 |
| NGC1377 | 9.507 0.012 | 0 | 8.153 0.02 | 0 | 4.682 0.014 | 10 | 1.712 0.013 | 10 | 72.06 | 0.636 | 92.0 |
| NGC1404 | 6.611 0.014 | 0 | 6.651 0.023 | 0 | 6.021 0.086 | 10 | 5.049 0.067 | 10 | 216.32 | 0.88 | 160.0 |
| NGC1482 | 7.938 0.011 | 0 | 7.629 0.019 | 0 | 3.418 0.014 | 10 | 0.825 0.014 | 10 | 135.91 | 0.799 | 112.7 |
| NGC1512 | 7.245 0.011 | 0 | 7.246 0.019 | 0 | 4.639 0.027 | 10 | 3.005 0.036 | 10 | 291.06 | 0.644 | 45.3 |
| NGC1566 | 6.568 0.011 | 0 | 6.465 0.019 | 0 | 2.956 0.013 | 10 | 1.048 0.015 | 10 | 333.13 | 0.735 | 27.1 |
| NGC1705 | 10.085 0.012 | 0 | 10.001 0.021 | 0 | 7.983 0.036 | 10 | 5.407 0.064 | 10 | 94.69 | 0.595 | 44.2 |
| M81DwA | 16.989 0.138 | 1 | 16.543 0.329 | 1 | – – | 0 | 11.362 2.735 | 0 | 6.01 | 1.0 | 98.8 |
| DDO053 | 12.598 0.022 | 0 | 12.277 0.053 | 0 | 9.182 0.077 | 0 | 6.324 0.13 | 10 | 49.3 | 0.789 | 138.5 |
| NGC2403 | 5.689 0.011 | 0 | 5.59 0.019 | 0 | 2.203 0.016 | 10 | 0.195 0.023 | 10 | 656.59 | 0.528 | 124.1 |
| NGC2798 | 8.658 0.011 | 0 | 8.384 0.019 | 0 | 4.278 0.014 | 10 | 1.302 0.013 | 10 | 94.13 | 0.522 | 158.4 |
| NGC2841 | 5.89 0.011 | 0 | 5.892 0.019 | 0 | 3.742 0.014 | 10 | 2.038 0.04 | 10 | 384.35 | 0.47 | 151.4 |
| NGC2915 | 9.427 0.012 | 0 | 9.383 0.021 | 0 | 7.783 0.036 | 10 | 5.331 0.052 | 10 | 123.78 | 0.493 | 129.7 |
| NGC2976 | 7.155 0.011 | 0 | 7.055 0.019 | 0 | 3.837 0.017 | 10 | 1.838 0.017 | 10 | 237.09 | 0.589 | 144.3 |
| NGC3031 | 3.606 0.011 | 0 | 3.608 0.019 | 0 | 1.826 0.012 | 10 | 0.426 0.021 | 10 | 868.41 | 0.557 | 155.9 |
| NGC3049 | 9.774 0.012 | 0 | 9.727 0.022 | 0 | 6.027 0.02 | 10 | 3.237 0.021 | 10 | 78.19 | 0.624 | 26.0 |
| M81DwB | 12.046 0.017 | 0 | 11.96 0.043 | 0 | 9.873 0.144 | 0 | 7.615 0.405 | 0 | 66.28 | 0.501 | 139.9 |
| NGC3190 | 7.298 0.011 | 0 | 7.258 0.019 | 0 | 5.054 0.019 | 10 | 3.64 0.029 | 10 | 178.48 | 0.45 | 121.1 |
| NGC3184 | 6.987 0.011 | 0 | 6.911 0.019 | 0 | 3.508 0.015 | 10 | 1.769 0.021 | 10 | 227.06 | 0.934 | 106.7 |
| NGC3198 | 7.609 0.011 | 0 | 7.52 0.019 | 0 | 4.171 0.02 | 10 | 2.116 0.025 | 10 | 279.97 | 0.349 | 35.3 |
| IC2574 | 8.681 0.012 | 0 | 8.592 0.022 | 0 | 7.27 0.084 | 10 | 4.1 0.108 | 0 | 326.09 | 0.49 | 39.6 |
| NGC3265 | 10.216 0.012 | 0 | 10.125 0.021 | 0 | 6.415 0.016 | 10 | 3.67 0.022 | 10 | 36.53 | 0.898 | 68.9 |
| Mrk33 | 10.23 0.012 | 0 | 10.006 0.022 | 0 | 5.74 0.013 | 10 | 2.471 0.014 | 10 | 56.68 | 0.784 | 125.4 |
| NGC3351 | 6.464 0.011 | 0 | 6.459 0.019 | 0 | 3.502 0.018 | 10 | 1.226 0.016 | 10 | 245.14 | 0.78 | 17.2 |
| NGC3521 | 5.439 0.011 | 0 | 5.342 0.019 | 0 | 1.938 0.014 | 10 | 0.276 0.018 | 10 | 427.58 | 0.621 | 165.4 |
| NGC3621 | 6.38 0.02 | 0 | 6.241 0.034 | 0 | 2.546 0.014 | 10 | 0.775 0.023 | 10 | 349.92 | 0.478 | 162.4 |
| NGC3627 | 5.556 0.011 | 0 | 5.446 0.019 | 0 | 1.997 0.013 | 10 | -0.025 0.015 | 10 | 395.56 | 0.532 | 177.3 |
| NGC3773 | 10.464 0.012 | 0 | 10.346 0.022 | 0 | 7.171 0.03 | 10 | 4.45 0.029 | 10 | 55.96 | 0.834 | 173.7 |
| NGC3938 | 7.496 0.011 | 0 | 7.371 0.019 | 0 | 3.816 0.016 | 10 | 2.057 0.019 | 10 | 182.74 | 0.823 | 49.5 |
| NGC4125 | 6.501 0.011 | 0 | 6.535 0.019 | 0 | 6.089 0.052 | 10 | 5.014 0.067 | 10 | 336.66 | 0.71 | 83.9 |
| NGC4236 | 7.91 0.011 | 0 | 7.99 0.02 | 0 | 5.749 0.087 | 10 | 3.091 0.047 | 0 | 519.32 | 0.299 | 158.0 |
| NGC4254 | 6.65 0.011 | 0 | 6.464 0.019 | 0 | 2.375 0.013 | 10 | 0.6 0.014 | 10 | 174.03 | 0.926 | 58.3 |
| NGC4321 | 6.247 0.011 | 0 | 6.122 0.019 | 0 | 2.578 0.015 | 10 | 0.722 0.02 | 10 | 322.35 | 0.889 | 55.2 |
| NGC4450 | 6.883 0.011 | 0 | 6.892 0.019 | 0 | 5.198 0.028 | 10 | 3.693 0.063 | 10 | 216.86 | 0.674 | 172.3 |
| NGC4536 | 7.183 0.011 | 0 | 7.027 0.019 | 0 | 3.332 0.016 | 10 | 0.866 0.016 | 10 | 262.54 | 0.388 | 122.9 |
| NGC4552 | 6.359 0.011 | 0 | 6.425 0.019 | 0 | 5.134 0.124 | 10 | 4.856 0.166 | 10 | 321.51 | 0.882 | 134.4 |
| NGC4559 | 7.389 0.011 | 0 | 7.235 0.019 | 0 | 4.037 0.018 | 10 | 2.063 0.034 | 10 | 297.59 | 0.379 | 149.5 |
| NGC4569 | 6.49 0.011 | 0 | 6.427 0.019 | 0 | 3.746 0.014 | 10 | 1.845 0.015 | 10 | 323.95 | 0.404 | 25.3 |
| NGC4579 | 6.325 0.011 | 0 | 6.29 0.019 | 0 | 4.133 0.014 | 10 | 2.584 0.021 | 10 | 242.89 | 0.794 | 97.4 |
| NGC4594 | 4.617 0.011 | 0 | 4.639 0.019 | 0 | 3.439 0.036 | 10 | 2.248 0.04 | 10 | 660.83 | 0.455 | 90.7 |
| NGC4625 | 9.592 0.012 | 0 | 9.517 0.021 | 0 | 6.152 0.024 | 10 | 4.404 0.061 | 10 | 64.37 | 0.9 | 177.5 |
| NGC4631 | 6.005 0.011 | 0 | 5.802 0.019 | 0 | 1.959 0.013 | 10 | -0.1 0.014 | 10 | 496.31 | 0.272 | 83.2 |
| NGC4725 | 6.086 0.011 | 0 | 6.106 0.019 | 0 | 3.891 0.021 | 10 | 2.54 0.026 | 10 | 386.33 | 0.634 | 40.0 |
| NGC4736 | 4.767 0.011 | 0 | 4.742 0.019 | 0 | 1.992 0.015 | 10 | 0.27 0.02 | 10 | 579.39 | 0.89 | 105.6 |
| DDO154 | 12.334 0.022 | 0 | 12.533 0.077 | 0 | 11.19 0.591 | 0 | – – | 0 | 60.6 | 0.575 | 39.5 |
| NGC4826 | 5.183 0.011 | 0 | 5.169 0.019 | 0 | 2.911 0.016 | 10 | 1.15 0.018 | 10 | 369.88 | 0.535 | 114.7 |
| DDO165 | 11.125 0.014 | 0 | 11.143 0.035 | 0 | – – | 0 | 8.729 1.558 | 0 | 114.65 | 0.521 | 98.2 |
| NGC5033 | 6.719 0.011 | 0 | 6.618 0.019 | 0 | 3.086 0.014 | 10 | 1.365 0.028 | 10 | 283.42 | 0.574 | 172.5 |
| NGC5055 | 5.257 0.011 | 0 | 5.195 0.019 | 0 | 1.85 0.013 | 10 | 0.204 0.016 | 10 | 523.49 | 0.601 | 103.4 |
| NGC5194 | 5.087 0.011 | 0 | 4.968 0.019 | 0 | 1.176 0.012 | 10 | -0.638 0.014 | 10 | 463.09 | 0.666 | 17.6 |
| NGC5195 | 6.451 0.011 | 0 | 6.432 0.019 | 0 | 4.223 0.012 | 10 | 2.009 0.013 | 10 | 174.12 | 0.776 | 106.9 |
| NGC5408 | 10.006 0.012 | 0 | 9.915 0.022 | 0 | 6.714 0.022 | 0 | 3.233 0.021 | 10 | 83.72 | 0.601 | 60.5 |
| NGC5474 | 8.646 0.011 | 0 | 8.609 0.02 | 0 | 6.083 0.051 | 10 | 4.28 0.086 | 10 | 155.1 | 0.85 | 1.1 |
| NGC5713 | 7.966 0.011 | 0 | 7.75 0.019 | 0 | 3.656 0.013 | 10 | 1.31 0.013 | 10 | 112.14 | 0.883 | 9.2 |
| NGC5866 | 6.62 0.011 | 0 | 6.603 0.019 | 0 | 5.205 0.019 | 10 | 3.864 0.036 | 10 | 283.19 | 0.555 | 122.3 |
| IC4710 | 9.369 0.012 | 0 | 9.333 0.022 | 0 | 7.194 0.037 | 0 | 4.815 0.083 | 0 | 130.61 | 0.75 | 115.1 |
| NGC6822 | 5.85 0.011 | 0 | 5.843 0.019 | 0 | 3.621 0.086 | 10 | 1.203 0.092 | 10 | 545.48 | 0.789 | 136.9 |
| NGC6946 | 5.015 0.011 | 0 | 4.839 0.019 | 0 | 0.928 0.011 | 10 | -1.066 0.012 | 10 | 446.82 | 0.909 | 51.5 |
| NGC7331 | 5.702 0.011 | 0 | 5.61 0.019 | 0 | 2.329 0.012 | 10 | 0.627 0.015 | 10 | 373.35 | 0.426 | 172.0 |
| NGC7552 | 7.132 0.011 | 0 | 6.733 0.019 | 0 | 2.577 0.013 | 10 | -0.408 0.012 | 10 | 152.04 | 0.8 | 104.8 |
| NGC7793 | 6.518 0.011 | 0 | 6.428 0.019 | 0 | 3.171 0.014 | 10 | 1.492 0.018 | 10 | 336.27 | 0.617 | 97.9 |
| IC0342 | 3.974 0.012 | 0 | 3.892 0.02 | 0 | 0.107 0.034 | 10 | -1.833 0.012 | 10 | 778.51 | 0.946 | 75.5 |
| M101 | 5.215 0.011 | 0 | 5.1 0.019 | 0 | 1.557 0.017 | 10 | -0.384 0.024 | 10 | 870.2 | 0.924 | 33.3 |
| NGC5398 | 9.772 0.012 | 0 | 9.744 0.022 | 0 | 6.598 0.025 | 10 | 3.644 0.031 | 10 | 101.89 | 0.642 | 178.4 |
| NGC3077 | 6.797 0.011 | 0 | 6.706 0.019 | 0 | 4.002 0.024 | 10 | 1.58 0.02 | 10 | 351.94 | 0.734 | 38.5 |
| NGC2146 | 6.383 0.011 | 0 | 6.041 0.019 | 0 | 1.781 0.014 | 10 | -0.778 0.011 | 10 | 250.61 | 0.552 | 126.2 |
| NGC3034 | 4.066 0.012 | 0 | 3.611 0.021 | 0 | -0.973 0.011 | 10 | -4.142 0.011 | 10 | 363.32 | 0.787 | 54.1 |
Note. — Integrated fluxes. The flag for each band indicates if the measurement was from: (0) isophotal aperture of semi-major axis ”Radius”, axis ratio and position angle, or (10) the total flux combining the isophotal with the radial SB extrapolation, or (1) the point source measurement from the ALLWISE catalogue.
| Galaxy | Dlum | W3PAH | W4dust | W1W2 | W2W3 | log | log | log | log | log | |
|---|---|---|---|---|---|---|---|---|---|---|---|
| (Wm-2) | (Mpc) | (mJy) | (mJy) | (mag) | (mag) | ||||||
| NGC0024 | -12.5666 | 6.9 | 79.4136 | 116.7656 | -0.023 | 2.507 | 8.1386 0.010 | 7.7329 0.012 | 7.4851 0.024 | 7.3575 0.026 | 9.4979 0.014 |
| NGC0337 | -12.0051 | 18.52 | 293.9644 | 738.5792 | 0.228 | 3.639 | 8.9513 0.010 | 8.6461 0.012 | 8.9112 0.012 | 9.0164 0.012 | 10.3106 0.014 |
| NGC0584 | -13.3539 | 20.37 | – | 14.5342 | -0.059 | 0.469 | 9.6692 0.010 | 9.2491 0.012 | – – | 7.3931 0.149 | 11.0286 0.014 |
| NGC0628 | -11.3481 | 7.23 | 2227.4197 | 3362.2595 | 0.109 | 3.633 | 9.0668 0.010 | 8.7139 0.012 | 8.9741 0.012 | 8.8579 0.011 | 10.4262 0.014 |
| NGC0855 | -12.8997 | 9.74 | 29.8283 | 76.437 | 0.072 | 2.364 | 8.0365 0.010 | 7.6688 0.012 | 7.3598 0.035 | 7.4735 0.021 | 9.3959 0.014 |
| NGC0925 | -11.7646 | 9.16 | 523.5233 | 949.6427 | 0.052 | 3.275 | 8.8208 0.010 | 8.445 0.012 | 8.5503 0.018 | 8.514 0.025 | 10.1801 0.014 |
| NGC1097 | -11.1533 | 17.55 | 2738.437 | 6841.18 | 0.1 | 3.415 | 10.0233 0.010 | 9.6667 0.012 | 9.8339 0.012 | 9.9366 0.010 | 11.3826 0.014 |
| NGC1266 | -12.0784 | 27.91 | 86.0285 | 741.4937 | 0.296 | 2.905 | 9.059 0.010 | 8.781 0.012 | 8.7339 0.014 | 9.3744 0.011 | 10.4183 0.014 |
| NGC1291 | -12.0395 | 8.61 | 270.7171 | 336.6199 | -0.04 | 1.235 | 9.6552 0.010 | 9.2428 0.012 | 8.2108 0.114 | 8.0104 0.053 | 11.0145 0.014 |
| NGC1316 | -12.2435 | 18.89 | 166.0631 | 430.4736 | -0.029 | 0.939 | 10.4484 0.010 | 10.0405 0.012 | 8.6807 0.235 | 8.7994 0.040 | 11.8077 0.014 |
| NGC1377 | -12.1891 | 23.35 | 374.3989 | 1610.5756 | 1.363 | 3.462 | 8.8622 0.010 | 9.0109 0.012 | 9.2179 0.010 | 9.5565 0.010 | 10.2215 0.014 |
| NGC1404 | -13.5278 | 19.19 | 2.4194 | 33.2088 | -0.044 | 0.634 | 9.8486 0.010 | 9.4344 0.013 | 6.8576 0.500 | 7.7001 0.100 | 11.208 0.014 |
| NGC1482 | -11.5645 | 19.61 | 1191.4984 | 3640.1294 | 0.319 | 4.202 | 9.3376 0.010 | 9.0686 0.012 | 9.5688 0.011 | 9.7588 0.010 | 10.6969 0.014 |
| NGC1512 | -12.0965 | 12.01 | 336.0567 | 463.3411 | -0.002 | 2.609 | 9.188 0.010 | 8.7906 0.012 | 8.5932 0.021 | 8.4377 0.017 | 10.5473 0.014 |
| NGC1566 | -11.3787 | 20.7 | 1759.6826 | 2928.889 | 0.104 | 3.512 | 9.9314 0.010 | 9.5766 0.012 | 9.7853 0.012 | 9.7116 0.011 | 11.2907 0.014 |
| NGC1705 | -13.0695 | 9.12 | 13.7508 | 51.2158 | 0.084 | 2.02 | 7.8104 0.010 | 7.4475 0.012 | 6.9658 0.033 | 7.2419 0.027 | 9.1697 0.014 |
| M81DwA | -13.9309 | 3.55 | – | – | – | – | 4.241 0.056 | 4.0229 0.132 | – – | – – | 5.6004 0.057 |
| DDO053 | -13.6254 | 3.55 | 5.7238 | 23.0834 | 0.321 | 3.095 | 5.9974 0.012 | 5.7294 0.023 | 5.7655 0.033 | 6.0761 0.053 | 7.3568 0.016 |
| NGC2403 | -11.0229 | 3.17 | 3559.5686 | 6480.167 | 0.099 | 3.387 | 8.6642 0.010 | 8.3073 0.012 | 8.4624 0.013 | 8.4276 0.013 | 10.0236 0.014 |
| NGC2798 | -11.7634 | 26.39 | 535.0079 | 2340.4434 | 0.282 | 4.107 | 9.3021 0.010 | 9.0184 0.012 | 9.479 0.011 | 9.825 0.010 | 10.6615 0.014 |
| NGC2841 | -11.689 | 14.06 | 694.688 | 1106.7286 | -0.002 | 2.152 | 9.8663 0.010 | 9.469 0.012 | 9.0458 0.028 | 8.9531 0.019 | 11.2256 0.014 |
| NGC2915 | -13.0286 | 3.76 | 14.0903 | 54.9298 | 0.044 | 1.6 | 7.3165 0.010 | 6.9376 0.012 | 6.2074 0.054 | 6.5033 0.023 | 8.6758 0.014 |
| NGC2976 | -11.7055 | 3.55 | 780.672 | 1423.0991 | 0.1 | 3.218 | 8.1747 0.010 | 7.8182 0.012 | 7.9003 0.013 | 7.8661 0.011 | 9.534 0.014 |
| NGC3031 | -10.9432 | 3.59 | 3637.6533 | 4656.822 | -0.002 | 1.782 | 9.6053 0.010 | 9.208 0.012 | 8.5797 0.044 | 8.392 0.017 | 10.9646 0.014 |
| NGC3049 | -12.5271 | 30.77 | 104.157 | 391.8682 | 0.049 | 3.706 | 8.9893 0.010 | 8.6125 0.012 | 8.9019 0.013 | 9.1824 0.012 | 10.3487 0.014 |
| M81DwB | -14.0797 | 5.31 | 2.4606 | -99.0 | 0.086 | 2.089 | 6.556 0.011 | 6.1939 0.019 | 5.7485 0.064 | – – | 7.9153 0.015 |
| NGC3190 | -12.2179 | 28.12 | 211.8346 | 248.0571 | 0.037 | 2.212 | 9.9017 0.010 | 9.5198 0.012 | 9.1317 0.026 | 8.9053 0.016 | 11.261 0.014 |
| NGC3184 | -11.5971 | 11.29 | 1048.2959 | 1489.8738 | 0.075 | 3.406 | 9.2379 0.010 | 8.8714 0.012 | 9.034 0.012 | 8.8917 0.012 | 10.5972 0.014 |
| NGC3198 | -11.8235 | 13.81 | 568.9117 | 1088.1012 | 0.091 | 3.352 | 9.1635 0.010 | 8.8035 0.012 | 8.9434 0.014 | 8.93 0.013 | 10.5228 0.014 |
| IC2574 | -12.3258 | 3.8 | 19.4162 | 174.1573 | 0.089 | 1.322 | 7.6244 0.010 | 7.2635 0.012 | 6.3561 0.082 | 7.0139 0.044 | 8.9837 0.014 |
| NGC3265 | -12.6741 | 22.6 | 73.4912 | 264.3272 | 0.094 | 3.71 | 8.5486 0.010 | 8.1899 0.012 | 8.4821 0.012 | 8.743 0.012 | 9.908 0.014 |
| Mark33 | -12.3931 | 24.91 | 138.9836 | 815.8638 | 0.223 | 4.268 | 8.6247 0.010 | 8.3174 0.012 | 8.8436 0.010 | 9.3173 0.010 | 9.984 0.014 |
| NGC3351 | -11.5837 | 10.92 | 1007.0319 | 2460.0928 | 0.005 | 2.959 | 9.4176 0.010 | 9.0231 0.012 | 8.9871 0.016 | 9.08 0.011 | 10.777 0.014 |
| NGC3521 | -11.0981 | 8.61 | 4429.864 | 5838.9404 | 0.097 | 3.404 | 9.6201 0.010 | 9.2624 0.012 | 9.4247 0.012 | 9.2496 0.011 | 10.9794 0.014 |
| NGC3621 | -11.2383 | 7.02 | 2578.5344 | 3712.6533 | 0.14 | 3.695 | 9.0657 0.012 | 8.7252 0.016 | 9.0121 0.011 | 8.8755 0.013 | 10.425 0.015 |
| NGC3627 | -11.0106 | 10.04 | 4211.5283 | 7762.558 | 0.111 | 3.449 | 9.7056 0.010 | 9.3536 0.012 | 9.5355 0.012 | 9.5061 0.011 | 11.0649 0.014 |
| NGC3773 | -12.8598 | 17.0 | 35.5029 | 128.0237 | 0.119 | 3.178 | 8.2024 0.010 | 7.8535 0.012 | 7.9191 0.017 | 8.1811 0.014 | 9.5617 0.014 |
| NGC3938 | -11.7086 | 17.46 | 799.0945 | 1150.3269 | 0.125 | 3.556 | 9.4134 0.010 | 9.0669 0.012 | 9.2948 0.012 | 9.158 0.012 | 10.7727 0.014 |
| NGC4125 | -13.0226 | 21.96 | -99.0 | 31.459 | -0.037 | 0.452 | 10.01 0.010 | 9.5986 0.012 | – – | 7.794 0.128 | 11.3693 0.014 |
| NGC4236 | -12.1201 | 4.47 | 109.2715 | 435.3659 | -0.081 | 2.242 | 8.062 0.010 | 7.6331 0.012 | 7.2471 0.044 | 7.5525 0.021 | 9.4213 0.014 |
| NGC4254 | -11.2238 | 15.41 | 3089.4766 | 4435.8027 | 0.188 | 4.088 | 9.6428 0.010 | 9.3216 0.012 | 9.7731 0.010 | 9.6352 0.010 | 11.0022 0.014 |
| NGC4321 | -11.2668 | 15.91 | 2497.652 | 3942.605 | 0.125 | 3.545 | 9.8321 0.010 | 9.4856 0.012 | 9.7088 0.012 | 9.6121 0.012 | 11.1914 0.014 |
| NGC4450 | -12.2443 | 19.48 | 153.4864 | 226.3166 | -0.009 | 1.7 | 9.7531 0.010 | 9.353 0.012 | 8.6732 0.050 | 8.5468 0.029 | 11.1124 0.014 |
| NGC4536 | -11.5026 | 14.4 | 1257.544 | 3471.5278 | 0.156 | 3.695 | 9.371 0.010 | 9.0369 0.012 | 9.3241 0.012 | 9.4701 0.011 | 10.7303 0.014 |
| NGC4552 | -13.1491 | 15.45 | 113.8553 | 36.8238 | -0.068 | 1.291 | 9.7616 0.010 | 9.3378 0.012 | 8.342 0.116 | 7.5568 0.139 | 11.1209 0.014 |
| NGC4559 | -11.6776 | 13.01 | 637.4404 | 1138.5181 | 0.153 | 3.2 | 9.2003 0.010 | 8.8649 0.012 | 8.9411 0.013 | 8.8981 0.016 | 10.5596 0.014 |
| NGC4569 | -11.77 | 11.84 | 782.2782 | 1367.6968 | 0.063 | 2.683 | 9.4776 0.010 | 9.1063 0.012 | 8.9478 0.017 | 8.8955 0.011 | 10.837 0.014 |
| NGC4579 | -11.8328 | 21.29 | 493.3753 | 665.5659 | 0.032 | 2.166 | 10.0534 0.010 | 9.6695 0.012 | 9.2574 0.027 | 9.0924 0.014 | 11.4127 0.014 |
| NGC4594 | -11.8567 | 9.37 | 513.3752 | 714.6739 | -0.023 | 1.201 | 10.0217 0.010 | 9.616 0.012 | 8.5616 0.117 | 8.4103 0.036 | 11.381 0.014 |
| NGC4625 | -12.6767 | 10.21 | 90.8875 | 130.5536 | 0.074 | 3.365 | 8.1063 0.010 | 7.7393 0.012 | 7.8842 0.015 | 7.7465 0.026 | 9.4656 0.014 |
| NGC4631 | -10.8964 | 12.13 | 4491.2637 | 8430.112 | 0.204 | 3.843 | 9.693 0.010 | 9.3781 0.012 | 9.7282 0.011 | 9.7067 0.010 | 11.0523 0.014 |
| NGC4725 | -11.7135 | 12.76 | 614.6294 | 676.2189 | -0.021 | 2.218 | 9.7045 0.010 | 9.2995 0.012 | 8.9083 0.028 | 8.6548 0.016 | 11.0638 0.014 |
| NGC4736 | -11.0764 | 5.18 | 3926.9233 | 5776.309 | 0.024 | 2.751 | 9.4472 0.010 | 9.0603 0.012 | 8.9307 0.017 | 8.8033 0.012 | 10.8066 0.014 |
| DDO154 | -14.0824 | 4.09 | – | – | -0.199 | – | 6.2274 0.012 | 5.7513 0.032 | – – | – – | 7.5868 0.016 |
| NGC4826 | -11.3643 | 5.35 | 1535.1316 | 2516.038 | 0.013 | 2.259 | 9.3085 0.010 | 8.9172 0.012 | 8.5505 0.025 | 8.4701 0.012 | 10.6678 0.014 |
| DDO165 | -13.9786 | 1.55 | – | – | -0.018 | – | 5.865 0.010 | 5.4613 0.016 | – – | – – | 7.2243 0.014 |
| NGC5033 | -11.448 | 17.59 | 1561.0349 | 2173.0088 | 0.1 | 3.533 | 9.7308 0.010 | 9.3743 0.012 | 9.5918 0.012 | 9.4405 0.014 | 11.0902 0.014 |
| NGC5055 | -10.9888 | 9.79 | 4772.666 | 6225.7417 | 0.061 | 3.346 | 9.8037 0.010 | 9.4315 0.012 | 9.5679 0.012 | 9.3883 0.011 | 11.163 0.014 |
| NGC5194 | -10.7154 | 7.9 | 9139.244 | 13661.376 | 0.12 | 3.792 | 9.6852 0.010 | 9.3368 0.012 | 9.664 0.011 | 9.5436 0.010 | 11.0445 0.014 |
| NGC5195 | -12.0357 | 8.03 | 454.2555 | 1161.9993 | 0.019 | 2.211 | 9.1533 0.010 | 8.7644 0.012 | 8.3741 0.026 | 8.487 0.011 | 10.5126 0.014 |
| NGC5408 | -12.5801 | 10.29 | 53.6192 | 390.1243 | 0.09 | 3.202 | 7.9475 0.010 | 7.5869 0.012 | 7.6618 0.015 | 8.2287 0.012 | 9.3068 0.014 |
| NGC5474 | -12.4337 | 7.19 | 87.7675 | 143.0601 | 0.036 | 2.527 | 8.1801 0.010 | 7.798 0.012 | 7.5645 0.028 | 7.4817 0.036 | 9.5395 0.014 |
| NGC5713 | -11.657 | 23.82 | 943.7425 | 2313.0437 | 0.219 | 4.093 | 9.4912 0.010 | 9.1825 0.012 | 9.6364 0.010 | 9.7308 0.010 | 10.8505 0.014 |
| NGC5866 | -12.1189 | 13.98 | 127.8423 | 179.8714 | 0.016 | 1.4 | 9.57 0.010 | 9.1798 0.012 | 8.3055 0.074 | 8.1588 0.026 | 10.9293 0.014 |
| IC4710 | -12.7262 | 10.25 | 29.0319 | 88.0063 | 0.036 | 2.141 | 8.1982 0.010 | 7.8162 0.012 | 7.3918 0.031 | 7.5784 0.034 | 9.5576 0.014 |
| NGC6822 | -11.2063 | 0.46 | 810.8865 | 2515.6265 | 0.007 | 2.222 | 6.9202 0.010 | 6.5265 0.012 | 6.1404 0.043 | 6.3371 0.038 | 8.2796 0.014 |
| NGC6946 | -10.637 | 5.89 | 11566.118 | 20351.254 | 0.177 | 3.909 | 9.4601 0.010 | 9.1344 0.012 | 9.5114 0.010 | 9.4619 0.010 | 10.8194 0.014 |
| NGC7331 | -11.0996 | 14.73 | 3081.586 | 4271.3247 | 0.092 | 3.282 | 9.9833 0.010 | 9.6236 0.012 | 9.7333 0.012 | 9.5801 0.011 | 11.3426 0.014 |
| NGC7552 | -11.1823 | 17.17 | 2592.8818 | 11332.939 | 0.403 | 4.156 | 9.5443 0.010 | 9.3091 0.012 | 9.7912 0.010 | 10.1368 0.010 | 10.9036 0.014 |
| NGC7793 | -11.3849 | 3.93 | 1444.9513 | 1946.5873 | 0.09 | 3.257 | 8.5175 0.010 | 8.157 0.012 | 8.2557 0.013 | 8.0902 0.012 | 9.8768 0.014 |
| IC0342 | -10.3843 | 3.13 | 25064.812 | 42112.3 | 0.082 | 3.785 | 9.3383 0.010 | 8.9746 0.012 | 9.2982 0.017 | 9.2285 0.010 | 10.6976 0.014 |
| M101 | -10.8026 | 7.23 | 6359.7734 | 10806.792 | 0.115 | 3.544 | 9.5576 0.010 | 9.2071 0.012 | 9.4297 0.012 | 9.365 0.013 | 10.917 0.014 |
| NGC5398 | -12.6836 | 20.57 | 59.6415 | 270.3057 | 0.029 | 3.152 | 8.6444 0.010 | 8.2596 0.012 | 8.3101 0.016 | 8.6714 0.015 | 10.0038 0.014 |
| NGC3077 | -11.8005 | 3.93 | 634.8691 | 1801.7534 | 0.091 | 2.704 | 8.4059 0.010 | 8.0458 0.012 | 7.8986 0.018 | 8.0566 0.012 | 9.7652 0.014 |
| NGC2146 | -10.9088 | 17.51 | 5397.2617 | 15935.869 | 0.349 | 4.253 | 9.862 0.010 | 9.6049 0.012 | 10.1264 0.011 | 10.3016 0.010 | 11.2213 0.014 |
| NGC3034 | -9.8625 | 3.72 | 70021.49 | 356701.1 | 0.455 | 4.584 | 9.4509 0.010 | 9.2364 0.012 | 9.8937 0.010 | 10.3058 0.010 | 10.8102 0.014 |
| Galaxy | W1 | W1f | W2 | W2f | W3 | W3f | W4 | W4f | Radius | b/a | P.A. |
|---|---|---|---|---|---|---|---|---|---|---|---|
| (mag) | (–) | (mag) | – | (mag) | – | (mag) | – | ||||
| Mrk231 | 7.498 0.011 | 0 | 6.341 0.019 | 0 | 3.131 0.012 | 10 | 0.04 0.012 | 10 | 87.57 | 1.0 | 0.6 |
| IRAS17208-0014 | 10.647 0.012 | 0 | 10.011 0.021 | 0 | 5.785 0.014 | 10 | 2.366 0.027 | 0 | 34.31 | 1.0 | 174.4 |
| Arp220 | 9.39 0.011 | 0 | 8.941 0.019 | 0 | 4.411 0.018 | 10 | 0.367 0.013 | 10 | 85.48 | 1.0 | 5.4 |
| NGC6240 | 8.721 0.011 | 0 | 8.231 0.019 | 0 | 4.652 0.018 | 10 | 1.125 0.013 | 10 | 88.24 | 0.678 | 20.9 |
| NGC0695 | 9.669 0.011 | 0 | 9.305 0.019 | 0 | 4.899 0.013 | 10 | 2.664 0.013 | 10 | 45.05 | 0.861 | 14.2 |
| Mrk331 | 9.503 0.011 | 0 | 9.103 0.019 | 0 | 4.74 0.012 | 10 | 1.595 0.012 | 10 | 43.66 | 0.775 | 150.2 |
| UGC12815 | 8.004 0.011 | 0 | 7.828 0.019 | 0 | 4.233 0.023 | 10 | 1.856 0.019 | 10 | 221.62 | 0.35 | 65.7 |
| HIPASSJ1004-06 | 9.017 0.011 | 0 | 8.74 0.019 | 0 | 4.435 0.027 | 10 | 2.175 0.016 | 10 | 73.77 | 0.77 | 165.5 |
| NGC2388 | 9.211 0.011 | 0 | 8.893 0.019 | 0 | 4.68 0.015 | 10 | 1.719 0.013 | 10 | 50.18 | 0.871 | 47.7 |
| NGC2146 | 6.383 0.011 | 0 | 6.041 0.019 | 0 | 1.814 0.014 | 10 | -0.779 0.011 | 10 | 250.61 | 0.552 | 126.2 |
| NGC1365 | 6.034 0.011 | 0 | 5.74 0.019 | 0 | 2.112 0.011 | 10 | -0.457 0.011 | 10 | 393.3 | 0.602 | 39.4 |
| NGC4039 | 6.915 0.011 | 0 | 6.749 0.019 | 0 | 2.921 0.014 | 10 | 0.299 0.014 | 10 | 159.24 | 0.899 | 168.3 |
| UGC89 | 8.568 0.011 | 0 | 8.436 0.019 | 0 | 4.786 0.015 | 10 | 2.347 0.014 | 10 | 100.03 | 0.647 | 169.3 |
| NGC6701 | 8.87 0.011 | 0 | 8.68 0.019 | 0 | 4.667 0.012 | 10 | 2.179 0.013 | 10 | 70.72 | 0.978 | 118.7 |
| UGC1845 | 9.476 0.011 | 0 | 9.173 0.019 | 0 | 5.203 0.013 | 10 | 2.541 0.013 | 10 | 53.24 | 0.653 | 129.1 |
| NGC5936 | 9.04 0.011 | 0 | 8.823 0.019 | 0 | 4.68 0.012 | 10 | 2.188 0.013 | 10 | 71.02 | 0.95 | 76.5 |
| MCG02-20-003 | 10.347 0.012 | 0 | 9.294 0.02 | 0 | 5.757 0.013 | 10 | 2.948 0.014 | 10 | 40.16 | 0.657 | 152.6 |
| HIPASSJ0716-62 | 8.157 0.011 | 0 | 7.925 0.019 | 0 | 4.18 0.012 | 10 | 1.569 0.012 | 10 | 130.24 | 0.489 | 177.5 |
| ESO320-G030 | 8.796 0.011 | 0 | 8.581 0.019 | 0 | 4.6 0.013 | 10 | 1.74 0.012 | 10 | 95.43 | 0.668 | 126.9 |
| IC5179 | 8.193 0.011 | 0 | 7.948 0.019 | 0 | 3.75 0.012 | 10 | 1.477 0.015 | 10 | 101.56 | 0.605 | 51.9 |
| MCG12-02-001 | 9.336 0.011 | 0 | 8.84 0.019 | 0 | 4.24 0.015 | 10 | 1.028 0.012 | 10 | 51.24 | 0.89 | 173.9 |
| F033591523 | 11.827 0.012 | 0 | 11.144 0.022 | 0 | 6.563 0.016 | 10 | 3.356 0.016 | 10 | 20.61 | 1.0 | 5.9 |
| NGC1614 | 8.847 0.011 | 0 | 8.378 0.019 | 0 | 3.681 0.013 | 10 | 0.317 0.026 | 0 | 62.29 | 0.822 | 163.9 |
| UGC2369 | 9.762 0.011 | 0 | 9.457 0.019 | 0 | 5.288 0.017 | 10 | 2.163 0.012 | 10 | 55.05 | 0.89 | 18.5 |
| Arp236 | 9.223 0.011 | 0 | 8.208 0.019 | 0 | 4.224 0.012 | 10 | 1.159 0.012 | 10 | 65.34 | 0.867 | 6.9 |
| IC883 | 10.207 0.011 | 0 | 9.639 0.019 | 0 | 5.324 0.013 | 10 | 2.285 0.012 | 10 | 58.29 | 0.855 | 178.4 |
| UGC4881 | 10.379 0.011 | 0 | 10.051 0.02 | 0 | 6.043 0.013 | 10 | 3.255 0.015 | 10 | 50.12 | 0.888 | 21.9 |
| NGC3690 | 7.198 0.011 | 0 | 6.05 0.019 | 0 | 2.227 0.011 | 10 | -1.064 0.011 | 10 | 127.09 | 0.85 | 21.1 |
| F171325313 | 11.007 0.011 | 0 | 10.464 0.019 | 0 | 5.886 0.022 | 10 | 3.202 0.012 | 10 | 31.03 | 0.916 | 173.8 |
| MK848 | 10.775 0.011 | 0 | 10.186 0.02 | 0 | 5.556 0.013 | 10 | 2.123 0.012 | 10 | 34.25 | 0.799 | 150.5 |
| IRAS105652448W | 10.772 0.012 | 0 | 10.085 0.021 | 0 | 5.666 0.014 | 10 | 2.388 0.017 | 10 | 33.03 | 1.0 | 174.8 |
| VIIZw31 | 10.735 0.012 | 0 | 10.239 0.02 | 0 | 5.793 0.018 | 10 | 3.163 0.012 | 10 | 28.24 | 1.0 | 12.6 |
| IRAS233653604 | 11.693 0.012 | 0 | 11.026 0.022 | 0 | 6.51 0.017 | 10 | 2.946 0.012 | 10 | 30.84 | 0.779 | 20.4 |
| Galaxy | Dlum | W3PAH | W4dust | W1W2 | W2W3 | log | log | log | log | log | |
|---|---|---|---|---|---|---|---|---|---|---|---|
| (Wm-2) | (Mpc) | (mJy) | (mJy) | (mag) | (mag) | ||||||
| Mrk231 | 12.51aaFischer et al. (2010) | 171.98 | 1522.2544 | 7303.187 | 1.175 | 3.198 | 11.3912 0.010 | 11.4646 0.012 | 11.5613 0.010 | 11.9473 0.010 | 12.7505 0.014 |
| IRAS17208-0014 | 12.4bbGoldader et al. (1995) | 183.01 | 125.8645 | 1061.4515 | 0.84 | 4.035 | 10.1566 0.010 | 10.0962 0.012 | 10.5327 0.010 | 11.1637 0.014 | 11.5159 0.014 |
| Arp220 | 12.18ccDale & Helou (2002) | 75.99 | 482.0348 | 5964.031 | 0.476 | 4.53 | 9.9231 0.010 | 9.717 0.012 | 10.3525 0.011 | 11.1499 0.010 | 11.2824 0.014 |
| NGC6240 | 11.86ddDe Looze et al. (2011) | 104.98 | 373.4446 | 2882.1587 | 0.537 | 3.576 | 10.4599 0.010 | 10.2781 0.012 | 10.5223 0.012 | 11.1148 0.010 | 11.8192 0.014 |
| NGC695 | 11.7ddDe Looze et al. (2011) | 139.11 | 284.3924 | 679.9062 | 0.391 | 4.378 | 10.3158 0.010 | 10.0757 0.012 | 10.6485 0.010 | 10.732 0.010 | 11.6751 0.014 |
| Mrk331 | 11.5eeArmus et al. (2009) | 79.3 | 345.9611 | 1839.5452 | 0.426 | 4.356 | 9.9072 0.010 | 9.6812 0.012 | 10.2454 0.010 | 10.6761 0.010 | 11.2665 0.014 |
| UGC12815 | 11.42ddDe Looze et al. (2011) | 61.12 | 535.5026 | 1404.9697 | 0.176 | 3.609 | 10.2838 0.010 | 9.9577 0.012 | 10.209 0.014 | 10.3329 0.012 | 11.6431 0.014 |
| HIPASSJ1004-06 | 11.37eeArmus et al. (2009) | 79.52 | 452.5499 | 1057.5352 | 0.292 | 4.304 | 10.1026 0.010 | 9.8229 0.012 | 10.3645 0.014 | 10.4382 0.011 | 11.4619 0.014 |
| NGC2388 | 11.28eeArmus et al. (2009) | 62.09 | 365.9762 | 1613.9646 | 0.341 | 4.2 | 9.8183 0.010 | 9.558 0.012 | 10.0573 0.011 | 10.4068 0.010 | 11.1776 0.014 |
| NGC2146 | 11.12eeArmus et al. (2009) | 20.56 | 5237.3984 | 16063.61 | 0.343 | 4.229 | 10.0006 0.010 | 9.7413 0.012 | 10.2528 0.011 | 10.4446 0.010 | 11.3599 0.014 |
| NGC1365 | 11.0eeArmus et al. (2009) | 18.14 | 3901.5818 | 11801.377 | 0.295 | 3.632 | 10.0309 0.010 | 9.7525 0.012 | 10.0161 0.011 | 10.2019 0.010 | 11.3902 0.014 |
| NGC4039 | 10.88ffGao et al. (2001) | 21.51 | 1859.7667 | 5897.8604 | 0.169 | 3.834 | 9.8258 0.010 | 9.4971 0.012 | 9.8426 0.011 | 10.0488 0.010 | 11.1851 0.014 |
| UGC89 | 11.11ggSanders et al. (2003) | 63.89 | 320.6163 | 893.426 | 0.132 | 3.664 | 10.0948 0.010 | 9.7511 0.012 | 10.0247 0.012 | 10.1748 0.010 | 11.4541 0.014 |
| NGC6701 | 11.11ggSanders et al. (2003) | 60.6 | 367.7937 | 1043.429 | 0.193 | 4.027 | 9.9313 0.010 | 9.6122 0.012 | 10.0383 0.010 | 10.1962 0.010 | 11.2906 0.014 |
| UGC1845 | 11.13ggSanders et al. (2003) | 66.39 | 224.3041 | 746.7936 | 0.308 | 3.984 | 9.7664 0.010 | 9.493 0.012 | 9.9029 0.010 | 10.1303 0.010 | 11.1257 0.014 |
| NGC5936 | 11.13ggSanders et al. (2003) | 65.12 | 361.3966 | 1041.8303 | 0.241 | 4.137 | 9.9207 0.010 | 9.6207 0.012 | 10.0932 0.010 | 10.2581 0.010 | 11.2801 0.014 |
| MCG02-20-003 | 11.14ggSanders et al. (2003) | 72.42 | 138.1558 | 508.2348 | 1.067 | 3.527 | 9.5066 0.010 | 9.5371 0.012 | 9.768 0.010 | 10.0387 0.010 | 10.8659 0.014 |
| HIPASSJ0716-62 | 11.16ggSanders et al. (2003) | 47.11 | 576.0187 | 1830.9971 | 0.238 | 3.76 | 10.0002 0.010 | 9.6987 0.012 | 10.0146 0.011 | 10.2219 0.010 | 11.3595 0.014 |
| ESO320-G030 | 11.16ggSanders et al. (2003) | 40.4 | 397.64 | 1557.4791 | 0.219 | 3.997 | 9.6146 0.010 | 9.3059 0.012 | 9.72 0.011 | 10.018 0.010 | 10.9739 0.014 |
| IC5179 | 11.22ggSanders et al. (2003) | 49.38 | 857.0593 | 2040.4521 | 0.242 | 4.2 | 10.0294 0.010 | 9.7295 0.012 | 10.228 0.010 | 10.3098 0.011 | 11.3887 0.014 |
| MCG12-02-001 | 11.5ggSanders et al. (2003) | 72.07 | 560.0752 | 3065.8076 | 0.52 | 4.606 | 9.8937 0.010 | 9.7051 0.012 | 10.3716 0.011 | 10.8149 0.010 | 11.253 0.014 |
| F033591523 | 11.53ggSanders et al. (2003) | 157.18 | 66.3665 | 415.0831 | 0.719 | 4.608 | 9.5629 0.010 | 9.454 0.012 | 10.1226 0.011 | 10.6238 0.011 | 10.9222 0.014 |
| NGC1614 | 11.66ggSanders et al. (2003) | 67.1 | 946.8895 | 5814.2104 | 0.474 | 4.728 | 10.0285 0.010 | 9.8215 0.012 | 10.5376 0.010 | 11.0308 0.014 | 11.3879 0.014 |
| UGC2369 | 11.66ggSanders et al. (2003) | 138.75 | 199.2178 | 1247.5616 | 0.294 | 4.189 | 10.2759 0.010 | 9.997 0.012 | 10.4916 0.011 | 10.9934 0.010 | 11.6352 0.014 |
| Arp236 | 11.71ggSanders et al. (2003) | 85.76 | 569.1014 | 2746.3096 | 1.044 | 3.959 | 10.1017 0.010 | 10.1226 0.012 | 10.5296 0.010 | 10.9181 0.010 | 11.461 0.014 |
| IC883 | 11.73ggSanders et al. (2003) | 107.12 | 201.8004 | 1022.3195 | 0.595 | 4.295 | 9.8904 0.010 | 9.732 0.012 | 10.2725 0.010 | 10.6822 0.010 | 11.2497 0.014 |
| UGC4881 | 11.75ggSanders et al. (2003) | 176.17 | 98.5039 | 418.2176 | 0.321 | 4.036 | 10.2297 0.010 | 9.9615 0.012 | 10.3932 0.010 | 10.7262 0.011 | 11.5891 0.014 |
| NGC3690 | 11.94ggSanders et al. (2003) | 51.22 | 3593.5107 | 21073.629 | 1.146 | 3.821 | 10.4689 0.010 | 10.5307 0.012 | 10.8823 0.010 | 11.3555 0.010 | 11.8282 0.014 |
| F171325313 | 11.95ggSanders et al. (2003) | 231.0 | 115.9448 | 428.5789 | 0.58 | 4.574 | 10.2095 0.010 | 10.0451 0.012 | 10.6993 0.012 | 10.9721 0.010 | 11.5688 0.014 |
| Mrk848 | 11.95ggSanders et al. (2003) | 180.69 | 167.5365 | 1321.332 | 0.622 | 4.667 | 10.1015 0.010 | 9.9537 0.012 | 10.6458 0.010 | 11.2477 0.010 | 11.4608 0.014 |
| IRAS105652448W | 11.99ggSanders et al. (2003) | 188.91 | 151.349 | 1045.468 | 0.725 | 4.46 | 10.1385 0.010 | 10.0318 0.012 | 10.6404 0.010 | 11.1847 0.011 | 11.4978 0.014 |
| VIIZw31 | 12.0ggSanders et al. (2003) | 230.22 | 124.3413 | 458.6414 | 0.518 | 4.464 | 10.307 0.010 | 10.1178 0.012 | 10.7267 0.011 | 10.9986 0.010 | 11.6663 0.014 |
| IRAS233653604 | 12.19ggSanders et al. (2003) | 269.83 | 70.1698 | 676.6337 | 0.707 | 4.6 | 10.0647 0.010 | 9.951 0.012 | 10.6162 0.011 | 11.3054 0.010 | 11.424 0.014 |
| Galaxy | W1 | W1f | W2 | W2f | W3 | W3f | W4 | W4f | Radius | b/a | P.A. |
|---|---|---|---|---|---|---|---|---|---|---|---|
| (mag) | (–) | (mag) | – | (mag) | – | (mag) | – | ||||
| NGC0625 | 8.536 0.012 | 0 | 8.46 0.02 | 0 | 5.423 0.033 | 10 | 2.357 0.024 | 10 | 227.06 | 0.406 | 93.7 |
| NGC1569 | 7.484 0.011 | 0 | 7.258 0.019 | 0 | 3.916 0.018 | 10 | -0.016 0.011 | 10 | 208.06 | 0.532 | 119.9 |
| Galaxy | Dlum | W3PAH | W4dust | W1W2 | W2W3 | log | log | log | log | log | |
|---|---|---|---|---|---|---|---|---|---|---|---|
| (Wm-2) | (Mpc) | (mJy) | (mJy) | (mag) | (mag) | ||||||
| NGC0625 | 8.50aaDe Looze et al. (2011) | 4.68 | 173.3133 | 870.4055 | 0.076 | 3.038 | 7.8515 0.010 | 7.4854 0.012 | 7.4878 0.018 | 7.8937 0.013 | 9.2108 0.014 |
| NGC1569 | 8.57aaDe Looze et al. (2011) | 1.59 | 738.7435 | 7969.3071 | 0.226 | 3.342 | 7.3458 0.010 | 7.0397 0.012 | 7.1791 0.013 | 7.9171 0.010 | 8.7052 0.014 |