Primary authors: e.a.kozyrev@inp.nsk.su
To be submitted to PLB.
Study of the process in the center-of-mass energy range 1010–1060 MeV with the CMD-3 detector
Abstract
The process has been studied using events from a data sample corresponding to an integrated luminosity of 5.7 pb-1 collected with the CMD-3 detector in the center-of-mass energy range 1010–1060 MeV. The cross section measured with an about 2% systematic uncertainty and it is used to calculate the contribution to the anomalous magnetic moment of the muon , and to obtain the meson parameters. We consider the relationship between the and cross sections and compare it to the theoretical expectations.
I Introduction
Investigation of annihilation into hadrons at low energies provides unique information about interactions of light quarks. A precise measurement of the cross section in the center-of-mass energy range =1010–1060 MeV allows to obtain the meson parameters and to estimate a contribution of other light vector mesons, , to the process studied. The cross section, particularly in the meson energy region, is also required for a precise calculation of the hadronic contribution to the muon anomalous magnetic moment, , and the value of the running fine structure constant at the boson peak, (MZ) Davier_g_2 .
The most precise cross section measurements performed by the CMD-2 cmdc and BaBar babarc experiments have tension at the level of more than 5% (about 2.6 standard deviations) in the meson energy region.
Another motivation for the study arises from the comparison of the charged and neutral final states. A significant deviation of the ratio of the coupling constants from a theoretical prediction based on previous experiments (see the discussion in Ref. Bramon ) requires a new precision measurement of the cross sections.
II CMD-3 detector and data set
The Cryogenic Magnetic Detector (CMD-3) is a general purpose detector installed in one of the two interaction regions of the VEPP-2000 collider vepp2000000 and is described elsewhere cmd3 . A detector tracking system consists of a cylindrical drift chamber (DC) and a double-layer cylindrical multiwire proportional chamber (Z-chamber), both installed inside a thin (0.2 ) superconducting solenoid with a 1.3 T field. The DC comprises of 1218 hexagonal cells and allows to measure charged particle momentum with a 1.5–4.5% accuracy in the 100–1000 momentum range, it also provides a measurement of the polar () and azimuthal () angles with a 20 mrad and 3.5-8.0 mrad accuracy, respectively. Amplitude information from the DC wires is used to measure the ionization losses of charged particles with a 11–14% accuracy for minimum ionization particles (m.i.p.). The Z-chamber with cathode strip readout is used to calibrate a DC longitudinal scale.
An electromagnetic calorimeter comprised of a liquid xenon volume of a 5.4 radiation length () thickness followed by CsI crystals (8.1 ) outside of the solenoid in the barrel part and BGO crystals (14.4 ) in the endcap parts calorim1 ; calorim2 . A flux return yoke of the detector is surrounded by scintillation counters to veto cosmic events.
The beam energy is monitored by using the back-scattering-laser-light system compton ; compton1 , which determines at each energy point with an about 0.06 MeV systematic accuracy.
Candidate events are recorded using signals from two independent trigger systems. One, a charged trigger, uses information only from DC cells indicating presence of at least one charged track, while another, a neutral trigger, requires an energy deposition in the calorimeter above /2 or presence of more than two clusters above 25 MeV threshold.
To study a detector response for the investigated processes and to obtain a detection efficiency, we have developed a Monte Carlo (MC) simulation of the detector based on the GEANT4 GEANT4 package. Simulated events are subject to all reconstruction and selection procedures. MC includes photon jet radiation by initial electron or positron (ISR) calculated according to Ref. PJGen_sibid .
The measurement of the cross section presented here is based on a data sample collected at 24 energy points with a 5.7 pb-1 integrated luminosity (IL) in the energy range = 1010–1060 MeV in 2012 and 2013.
III Event selection
Selection of candidates is based on the detection of two collinear tracks satisfying the following criteria:
-
The tracks originate from the beam interaction region within 20 cm along the beam axis (Z-coordinate) and within 1 cm in the transverse direction.
-
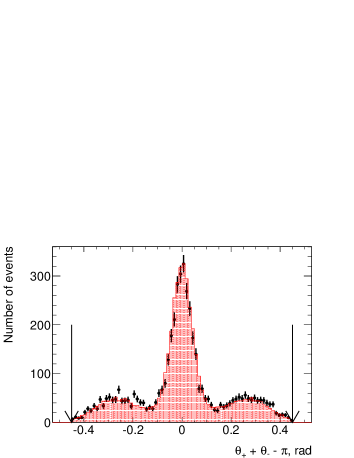
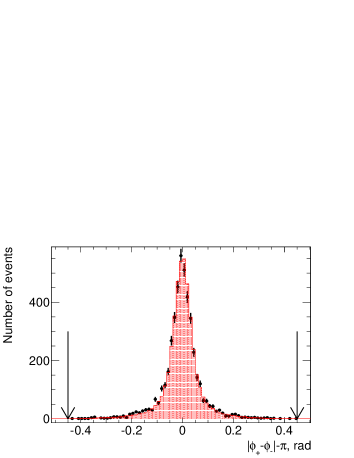
The polar and azimuthal collinearity are required to have 0.45 radians. The distributions of these parameters for data and MC at = 530 MeV are shown in Figs. 1,2, where the MC sample is normalized to data, and arrows demonstrate the applied requirement. Two additional bumps in the distribution are caused by a significant contribution of events, where is emitted from the initial state (radiative return to the resonance).
-
The tracks are required to have an average polar angle in the range 1 - 1 radians. The polar angle distribution is shown in Fig. 3 (a) where arrows demonstrate the applied restriction. Tracks out of the selected range do not pass all DC layers and are detected less efficiently (see the discussion in Sec. VI).
-
Momenta of both tracks are required to be close to each other: 0.3.
-
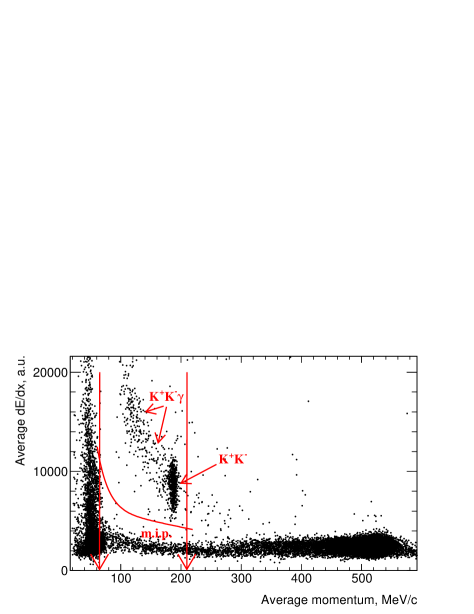
The average momentum of two tracks is required to be in a range depending on to minimize the background-to-signal ratio. An example of this restriction for =530 MeV is shown in Fig. 4 by arrows: the loss of signal events is less than 0.2% according to MC.
-
In our energy range kaon ionization losses in DC are significantly larger than those for m.i.p. due to a low momentum of kaons, = 100200 MeV/. We require both tracks to have ionization losses above a value, which is calculated by taking into account the average value of dE/dx at the measured kaon momentum and dE/dx resolution. The line in Fig. 4 shows an example of the applied selection. As seen in the figure, among selected events there are those with ISR photons, which have smaller momentum and therefore larger dE/dx. Such events are also retained for the further analysis.
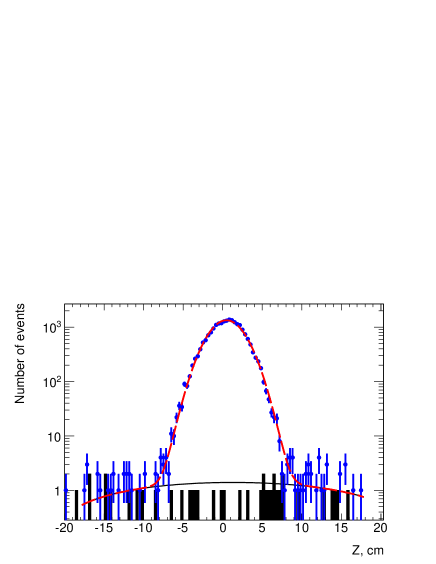
The number of signal events is obtained using a fit of the average Z-coordinate distribution of two selected tracks with signal and background functions shown in Fig. 5. The shape of the signal function is described by a sum of two Gaussian distributions with parameters fixed from the simulation, and with additional Gaussian smearing to account for the difference in data-MC detector responses. For the background profile we use a second-order polynomial function, which describes well a distribution obtained at the energy = 984 MeV below the threshold of the production shown in Fig. 5 by a shaded histogram. The level of background is estimated as less than 0.5% for all energy points, except for the lowest energy = 1010.46 MeV, where the background is about 1.1%. The background is predominantly caused by the beam-gas interaction and interaction of particles lost from the beam at the vacuum pipe walls.
As a result, we obtain (by fit) events of the process .
IV Detection efficiency
The detection efficiency, , is determined from MC by dividing the number of MC simulated events, after reconstruction and selection described above, to the total number of generated pairs. The obtained is presented in Table 1 and increases from 44% to 55%, and is primarily determined by the restriction on the kaon polar angles and its decays in flight. Simulation of the ISR spectrum depends on the cross section under study and this effect is taken into account by iterations. Influence of final-state radiation of real photons (FSR) on is examined by including into the MC generator the FSR amplitude calculated according to scalar electrodynamics with pointlike K mesons PJGen_sibid . The observed change of is less than 0.1%.
Because of some data-MC inconsistency in the tracking efficiency, we introduce a correction equal to the ratio of a single-kaon-track efficiency in data and MC, . A detection efficiency corrected for detector effects is defined as
| (1) |
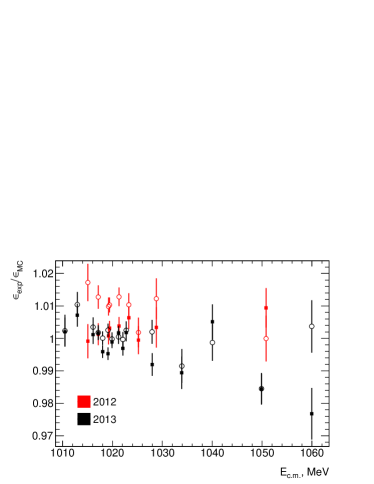
The collinear configuration of the process and large ionization losses allow estimation of the single-kaon-track efficiency in data and MC to be performed by selecting a pure class of “test” events with a detected positive or negative kaon, and checking how often we reconstruct the opposite track. The detection efficiencies for single positive and negative kaons increase from 80% to 90% in our energy range. The data-MC ratios and of the efficiencies are shown in Fig. 6 for single positive (squares) and negative (circles) kaons vs c.m. energy, and are used in Eq. (1) to calculate the detection efficiency at each energy point.
V Cross section of
The experimental Born cross section of the process has been calculated for each energy point according to the expression:
| (2) |
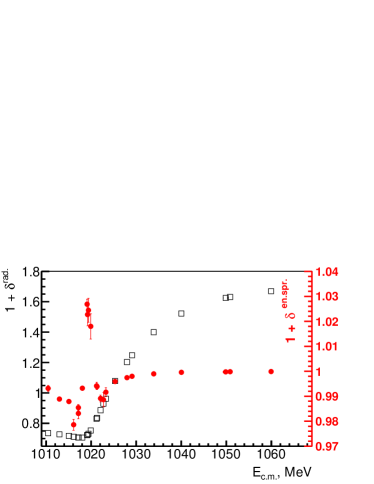
where is a trigger efficiency, is the integrated luminosity, represents a correction due to the energy spread of the electron-positron beams, and is an initial-state radiative correction. The integrated luminosity is determined by the processes and with an about 1% lum ; lum1 accuracy. The correction , shown by squares in Fig. 7, is calculated using the radiative structure function, known with an accuracy better than 0.1% radcorFadin .
The electron-positron c.m. energy spread, , typically about 300 keV, changes the visible cross section, and to take into account this effect we apply the following correction:
| (3) | |||
which depends on the cross section , radiative correction , and is calculated by iterations in the same way as and . The calculated () value for each energy point is shown in Fig. 7 by circles (right scale), and has the maximum value of 1.0260.006 at the peak of the resonance.
The trigger efficiency, , is studied using responses of two independent triggers, charged and neutral, for selected signal events, and is found to be close to unity for applied selections.
The resulting cross section is listed in Table 1 at each energy point and shown in Fig. 8. The statistical error includes fluctuations of signal and Bhabha events, used for the luminosity calculation, and fluctuations of the uncertainty on the c.m. energy measurement, , calculated as .
| , MeV | events | 1 + | , nb-1 | , nb | |||
|---|---|---|---|---|---|---|---|
| 1010.47 0.01 | 21351 145 | 0.439 | 0.441 | 0.735 | 0.993 | 936.05 1.44 | 69.87 0.50 |
| 1012.96 0.01 | 26882 164 | 0.485 | 0.493 | 0.728 | 0.988 | 485.36 1.04 | 152.45 1.01 |
| 1015.07 0.02 | 6031 78 | 0.502 | 0.510 | 0.718 | 0.987 | 47.91 0.33 | 341.10 5.11 |
| 1016.11 0.01 | 41260 201 | 0.510 | 0.513 | 0.712 | 0.978 | 192.11 0.66 | 575.08 3.84 |
| 1017.15 0.02 | 176768 421 | 0.515 | 0.517 | 0.706 | 0.983 | 478.99 1.04 | 993.19 5.02 |
| 1017.16 0.02 | 22243 149 | 0.517 | 0.524 | 0.706 | 0.985 | 60.15 0.30 | 984.71 8.89 |
| 1018.05 0.03 | 279733 529 | 0.521 | 0.519 | 0.706 | 0.993 | 478.34 1.04 | 1584.27 11.00 |
| 1019.12 0.02 | 270045 520 | 0.525 | 0.524 | 0.721 | 1.026 | 328.62 0.86 | 2228.59 8.13 |
| 1019.21 0.03 | 44051 209 | 0.525 | 0.531 | 0.724 | 1.022 | 52.75 0.34 | 2230.81 18.14 |
| 1019.40 0.04 | 30539 174 | 0.526 | 0.533 | 0.730 | 1.024 | 36.05 0.29 | 2233.66 22.07 |
| 1019.90 0.02 | 391083 626 | 0.527 | 0.527 | 0.752 | 1.017 | 472.34 1.04 | 2127.07 6.46 |
| 1021.22 0.03 | 134598 365 | 0.532 | 0.533 | 0.829 | 0.994 | 228.34 0.72 | 1325.01 9.01 |
| 1021.31 0.01 | 27717 165 | 0.531 | 0.540 | 0.835 | 0.993 | 46.85 0.33 | 1308.31 12.50 |
| 1022.08 0.03 | 89487 299 | 0.532 | 0.530 | 0.885 | 0.989 | 201.62 0.68 | 933.95 6.81 |
| 1022.74 0.03 | 41756 204 | 0.534 | 0.536 | 0.928 | 0.988 | 116.71 0.52 | 710.23 5.86 |
| 1023.26 0.04 | 19718 140 | 0.536 | 0.545 | 0.961 | 0.991 | 62.91 0.38 | 595.03 6.56 |
| 1025.32 0.04 | 7023 84 | 0.537 | 0.538 | 1.077 | 0.995 | 36.32 0.29 | 334.77 5.55 |
| 1027.96 0.02 | 24236 156 | 0.540 | 0.536 | 1.200 | 0.997 | 195.83 0.67 | 191.64 1.74 |
| 1029.09 0.02 | 5786 76 | 0.542 | 0.550 | 1.244 | 0.997 | 52.94 0.35 | 159.94 2.95 |
| 1033.91 0.02 | 11752 108 | 0.546 | 0.535 | 1.392 | 0.998 | 175.55 0.64 | 89.65 1.24 |
| 1040.03 0.05 | 9143 95 | 0.551 | 0.553 | 1.509 | 0.999 | 195.91 0.68 | 55.87 0.94 |
| 1049.86 0.02 | 14818 122 | 0.553 | 0.536 | 1.604 | 0.999 | 499.59 1.09 | 34.47 0.47 |
| 1050.86 0.04 | 4441 67 | 0.554 | 0.559 | 1.609 | 0.999 | 146.31 0.59 | 33.89 0.84 |
| 1059.95 0.02 | 4594 68 | 0.553 | 0.543 | 1.640 | 0.999 | 198.86 0.69 | 25.93 0.64 |
VI Systematic uncertainties
The uncertainty on the cross section is dominated by the accuracy of the detection efficiency calculation.
The systematic uncertainty of the data-MC ratios in Eq. (1) is estimated by applying different selection requirements on the “test” events and does not exceed 1%, however, for five energy points with MeV we increase the uncertainty to 2%.
The data-MC difference in the polar angle distributions of kaons is shown in Fig. 3(b) by circles. The observed difference is due to incorrect simulation of detector resolution, angular dependence of the track reconstruction and trigger efficiency, and uncertainty on the calibration of the DC longitudinal scale. We tune our simulation to match the detector angular and momentum resolutions (see Fig. 1), study angular dependence of the track reconstruction efficiency using a single-track “test” sample, and study response of two independent triggers as a function of the track polar angle. The data-MC ratio of the polar angle distributions after applied corrections is shown in Fig. 3(b) by squares.
To estimate influence of the remaining angular uncertainty on the measured cross section we divide all data into three independent samples with [0.95 : 1.35], [1.35 : 1.35] and [1.35 : 0.95] radians. By separately calculating all parameters in Eq. (2) for three regions and comparing the obtained cross sections we estimate the corresponding uncertainty as the average difference of the samples to be 1%.
To check the quality of the DC chamber scale calibration we extrapolate the reconstructed kaon tracks from DC to ZC and compare it with the position of the ZC response: a possible sytematic uncertainty is less than 0.3%.
The total systematic uncertainty in the reconstruction efficiency is estimated as 1.6%, but increased to 2.5% for five energy points for 1030 MeV.
To estimate uncertainty on the background subtraction procedure we use the data accumulated at the energy point = 984 MeV below the reaction threshold. Applying our selection criteria we obtain the number of background events, , and then estimate the number of background events for each energy point using the integrated luminosities IL(s) as:
| (4) |
The difference in the calculated number of background events and events obtained by the approximation of the Z-coordinate distribution (see Sec. III) gives less than 0.3% uncertainty of the cross section: this value is used as an estimate of the corresponding systematic uncertainty.
A significant part of selected signal events include ISR photons, which should be taken into account in and . The photon spectrum is calculated by a convolution of the radiator function radcorFadin and Born cross section () which is known with uncertainties discussed above. By varying , IL, , and in Eq. (2) according to their uncertainties and repeating the calculation of () and we estimate the uncertainty on the cross section as 0.1% (0.8% for energy points with MeV). These values are quadratically summed with the 0.1% theoretical uncertainty of the radiator function.
The systematic uncertainties contributing to the measured cross section are listed in Table 2, and the quadratic sum gives 2.0% (2.8% for MeV) as the total systematic uncertainty.
| Source | Uncertainty, % |
|---|---|
| Signal selection | 0.3 |
| Detection efficiency | 1.6(2.5) |
| Radiative correction | 0.15(0.80) |
| Energy spread correction | 0.3 |
| Trigger efficiency | 0.1 |
| Luminosity | 1.0 |
| Total | 2.0(2.8) |
VII Approximation of the cross section
The measured cross section defined by Eq. (2) includes a vacuum polarization factor, Coulomb interaction between , and final-state radiation of real photons . We approximate the energy dependence of the cross section according to the vector meson dominance (VMD) model as a squared sum of the -like amplitudes Kuhn :
| (5) |
where , is a kaon momentum,
| (6) |
is the Sommerfeld-Gamov-Sakharov factor that can be obtained by solving the Schrdinger equation in a Coulomb potential for a P-wave final state with velocity , is the inverse propagator of the vector state V:
| (7) |
Here and are mass and width of the major intermediate resonances: . For the energy dependence of the meson width we use
where , and for the calculation the model assuming the decay is used NNAchasov . The magnitudes of and are calculated in the same way using the corresponding branching fractions PDG . The coupling constants of the intermediate vector meson with initial and final states can be presented as:
where and are electronic width and decay branching fraction to a kaon pair. In our approximation we use the table values of mass, total width, and electronic width of the and : PDG . For the a priori unknown couplings of the and to the pair of kaons we use the relation
| (8) |
based on the quark model with “ideal” mixing and exact SU(3) symmetry of u-, d-, and s-quarks Kuhn . In order to take into account a possible breaking of these assumptions, both and are multiplied by the common complex constant .
The amplitude denotes a contribution of the higher vector mesons , , and to the mass region. Using BaBar babarc and SND SND2016 data above 1.06 GeV for the process we extract a contribution of these states.
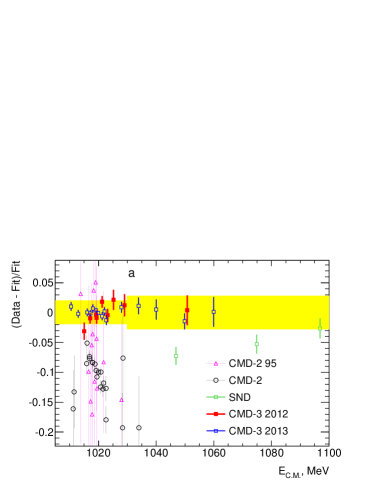
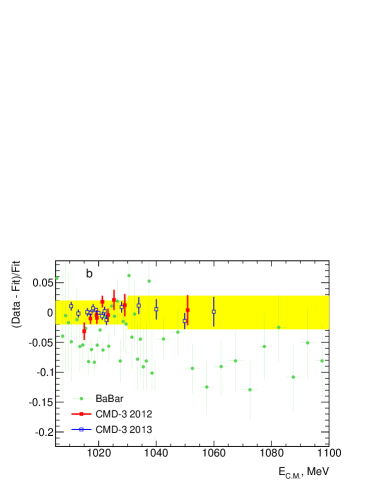
We perform a fit to the cross section with floating , (or alternatively ) and parameters: the fit yields (. The fit result is shown in Fig. 8. Figures 9 show the relative difference between the obtained data and the fit curve. Only statistical errors are shown and the width of the band corresponds to the systematic uncertainty of the cross section. In Fig. 9 (a) we compare our result with the previous Novosibirsk measurements cmdc ; cmd_old ; SND2016 while Fig. 9 (b) shows a comparison with the recent BaBar experiment babarc . The obtained parameters of the meson in comparison with the values of other measurements are presented in Table 3. The first uncertainties are statistical and the second are systematic, resulting from the 60 keV accuracy in the measurements and errors listed in Table 2. From the fit we obtain while an imaginary part is compatible with zero. The contributions of the and intermediate states () and higher excitations () are demonstrated in Fig. 8 as an inset.
To study model dependence of the results, we perform alternative fits with the =0 amplitude in Eq. (5), or with an additional floating phase of the meson amplitude, or with the form of the inverse propogator instead of Eq. (7). The variations of the meson parameters in these fits are used as an estimate of the model-dependent uncertainty presented as third errors in Table 3.
As shown in Fig. 9, the obtained results have comparable accuracy but are not consistent, in general, with the previous data.
The difference with the CMD-2 cmdc measurement can be explained by the overestimation of the value of the trigger efficiency for slow kaons in the previous experiment. The positive trigger decision of the CMD-2 required the presence of one charged track in DC in coincidence with the corresponding hits in the Z-chamber, and with at least one cluster in the CsI calorimeter with the energy deposition greater than 20 MeV. But slow kaons stop in the first wall of the Z-chamber and only decay or their nuclear interaction products can make hits in the Z-chamber or leave energy in the calorimeter. The trigger efficiency about 90% was obtained actually by simulation, using recorded information from detector cells.
In contrast to the CMD-2 experiment, the new CMD-3 detector has two independent trigger systems, the Z-chamber is excluded from the decision, and a charged (total) trigger efficiency is close to 100%. The CMD-3 detector has the same Z-chamber and much more detailed information, and by including to our selection requirements of hits in the Z-chamber and presence of energy deposition greater than 20 MeV in the barrel calorimeter, we obtain a significantly larger trigger efficiency correction than the value obtained in the CMD-2 analysis cmdc . A reanalysis of CMD-2 data is expected.
Our value of is larger than the BaBar result by 1.8 standard deviations while the obtained value of is larger than the PDG one, predominantly based on the CMD-2 measurement, by 2.7 standard deviations. The obtained values of the meson mass and width agree with the results of other experiments including our recent study of the process ksklcmd3 .
| Parameter | CMD-3 | Other measurements |
|---|---|---|
| , MeV | 1019.469 0.006 0.060 0.010 | 1019.461 0.019 (PDG2016) |
| , MeV | 4.249 0.010 0.005 0.010 | 4.266 0.031 (PDG2016) |
| , keV | 0.669 0.001 0.022 0.005 | 0.634 0.008 (BaBar) |
| 15.789 0.033 0.527 0.120 | 14.24 0.30 (PDG2016) |
VIII Contribution to
Using the result for the cross section we compute the contribution of this channel to the anomalous magnetic moment of the muon via a dispersion relation in the energy region 1.06 GeV. According to Ref. Davier_g_2 , for the leading-order approximation we obtain:
| (9) |
where is the kernel function, the factor excludes the effect of leptonic and hadronic vacuum polarization (VP), and the Born cross section . The first uncertainty is statistical, the second one corresponds to the systematic uncertainty of and the third is the uncertainty of the VP factor (0.2% Vacuumpolar ). We integrate Eq. (VIII) using the model for the cross section obtained in the previous section. Then, in order to avoid a model uncertainty, the difference between the experimental cross section values and used model is integrated using the trapezoidal method.
The value should be compared with the recent result of the BaBar collaboration babarc calculated in the same energy range. The difference between the calculation of based on our data and on the most precise previous measurement by BaBar is .
IX Comparison of and processes.
There is a strong relationship between the processes of electron-positron annihilation into and final states. The difference between them comes from the kinematic effect of the and mass difference and the Coulomb interaction between and mesons (6). At the peak the Coulomb factor, , contributes 4.2% to the total cross section. We correct the cross section for the above two effects and calculate the difference with the cross section:
| (10) | |||
where the factor is introduced to account for a possible remaining systematic uncertainty in two measurements: most of the common uncertainties cancel in the difference. The experimental value of is shown in Fig. 10 by points with error bars, where the cross section of the production of neutral kaons is taken from our recent measurement ksklcmd3 . The shaded area in the figure corresponds to the systematic uncertainties.
The deviation of from zero mostly comes from the different structure of the amplitudes of non-resonant isovector states, dominated by the meson, for the processes with charged and neutral kaons. Indeed, instead of relations in Eq. (8) for the charged final state the coupling constants of the and with the final state are:
| (11) |
where the -meson term has a different sign. So, the magnitude of in Eq. (10) is proportional to , that allows to see experimentally the meson contribution to K-meson production.
We fit using Eq. (5,10) with two floating parameters, and , discussed above. The mass, width of the meson and are fixed at the values obtained in Sec. VII, also is fixed at 0.428 keV according to Ref. ksklcmd3 . The fit result is shown by a solid line in Fig. 10(a) and, in more detail, in insets to Fig. 10 (b, c) and yields:
We obtain good description of data by the fit. A small deviation of from unity demonstrates the precision ( 5%) of relations (8,11) and confirms that the contribution from the meson to dominates in the energy range under study. The deviation of from unity (0.36%) shows the level of a possible remaining systematic uncertainty of the cross section measurements.
Additionally, from the comparison of the charged and neutral cross sections we can obtain the ratio of the coupling constants:
where the common parts of systematic uncertainties originating from those on the luminosity, radiative and energy spread corrections, are also reduced. As expected from isospin symmetry of u- and d-quarks, the value of is consistent with unity.
Additionally to the Coulomb interaction taken into account by the factor , the final-state radiation of real photons, according to Ref. Hoefer , decreases the total cross section by about 0.4% at the meson mass. This effect partially explains the deviation of from unity.
X Conclusion
Using CMD-3 data in the =1010–1060 MeV energy range we select 1.7106 events of the process , and measure the cross section with an about 2% systematic error. Using the fit in the VMD model the following values of the meson parameters have been obtained:
We calculate the contribution of the obtained cross section to the anomalous magnetic moment of the muon in the energy range from threshold to 1.06 GeV.
The observed deviation of the and amplitudes, , from a naive theoretical prediction allows to estimate the precision of the used VMD-based phenomenological model as better than 5%. The obtained ratio is consistent with isospin symmetry.
Acknowledgements
We thank the VEPP-2000 personnel for the excellent machine operation. This work is supported in part by the Russian Education and Science Ministry, by the Russian Foundation for Basic Research grants RFBR 15-02-05674, 17-02-00897, 17-52-50064.
References
- (1) S. Eidelman and F. Jegerlehner, Z. Phys. C 67, 585 (1995).
- (2) R.R. Akhmetshin et al., Phys. Lett. B 669, 217 (2008).
- (3) J. P. Lees et al., Phys. Rev. D 88, 032013 (2013).
- (4) A. Bramon et al., Phys. Lett. B 486, 406 (2000).
- (5) P.Yu. Shatunov et al., Phys. Part. Nucl. Lett. 13, 7 (2016).
- (6) B.I. Khazin et al., Nucl. Phys. B (Proc. Suppl.) 181, 376 (2008).
- (7) V. E. Shebalin et al., Nucl. Instr. Meth. A 824, 710 (2016). (2016).
- (8) V.M. Aulchenko et al., JINST 10, P10006 (2015).
- (9) E. V. Abakumova et al., Phys. Rev. Lett. 110, 140402 (2013).
- (10) E.V. Abakumova et al., JINST 10, T09001 (2015).
- (11) S. Agostinelli et al. (GEANT4 Collaboration), Nucl. Instr. and Meth. A 506, 250 (2003).
- (12) . A.B. Arbuzov et al., Eur. Phys. J. C 46, 689 (2006) (hep-ph/0504233).
- (13) E.A. Kuraev and V.S. Fadin, Sov. J. Nucl. Phys. 41, 466 (1985) [Yad. Fiz. 41, 733 (1985)].
- (14) I.A.Koop, BINP, Novosibirsk , https://cmd.inp.nsk.su/wiki/bin/view/CMD3/VEPPInfo
- (15) R.R. Akhmetshin et al., JINST 9, C09003 (2014).
- (16) A.E. Ryzhenenkov et al., JINST 12 C07040 (2017).
- (17) M.N. Achasov et al., Phys. Rev. D 94, 112006 (2016).
- (18) R.R. Akhmetshin et al., Phys. Lett. B 364, 199 (1995).
- (19) C. Bruch, A. Khodjamirian and J. Kuhn, Eur. Phys. J. C39, 41 (2005).
- (20) N.N. Achasov et al., Sov. J. Nucl. Phys. 54, 664 (1991) [Yad. Fiz. 54, 1097 (1991)]; N.N. Achasov et. al., Int. J. Mod. Phys. A 7, 3187 (1992).
- (21) C. Patrignani et al. (Particle Data Group), Chin. Phys. C 40, 100001 (2016).
- (22) E.A. Kozyrev et al., Phys. Lett. B 760, 314 (2016).
- (23) A. Hoefer, J. Gluza, F. Jegerlehner, Eur. Phys. J. C 24, 51 (2002).
- (24) S. Actis et al., Eur. Phys. J. C 66, 585 (2010).