Recent measurements of branching fractions and asymmetries of charmless hadronic meson decays at Belle
Abstract:
Hadronic decays without a charm quark constitute a powerful probe to search for physics beyond the standard model as well as to provide constraints on violation parameters. We report final measurements from Belle of the branching fractions and asymmetries for the decays and . The measurements enable us to improve constraints on the angle of the CKM unitarity triangle. For we measure asymmetry as a function of the invariant mass of the system, where we find a strong evidence for large violation and a large increase in yield at low mass region. This result challenges conventional theoretical approaches as it requires a large enhancement in both tree and loop level diagrams in the same small region of phase-space.
1 Introduction
Charmless decays of mesons to hadronic final states are suppressed in the standard model (SM), hence they constitute a powerful probe to search for new physics as well as to provide constraints on violation parameters. Any significant deviation from SM expectations of the branching fraction or asymmetry will be a hint towards new physics. In this paper, we present measurements of branching fractions and asymmetries for the charmless hadronic decays and based on the full data collected with the Belle detector at the KEKB asymmetric energy collider [1].
2 decay
meson decays to three-body charmless hadronic final states of [2] are dominated by the Cabbibo-suppressed tree and loop transitions. Large asymmetries can occur in these decays, due to interference between SM tree and loop level diagrams with similar amplitudes. An unidentified structure has been measured by BaBar [3] and LHCb [4, 5] in the low invariant mass spectrum of the decay. Also, LHCb reported a non-zero inclusive asymmetry of (where, the first uncertainty is statistical, the second is the systematic, and the third is due to the asymmetry of the reference mode) and a large unquantified local asymmetry in the same mass region. These results suggest that final-state interactions can be a contributing factor to violation [6, 7]. With this study, we attempt to quantify the asymmetry and branching fraction as a function of the invariant mass based on a data sample collected at the resonance by the Belle detector comprising of , which corresponds to an integrated luminosity of 711 fb-1, and an additional 89.4 fb-1 of off-resonance sample recorded at a center-of-mass energy around 60 MeV below the resonance.
We combine two oppositely-charged kaons with a charged pion to reconstruct . Charged kaons and pions are identified based on a likelihood ratio obtained by combining information from the aerogel Cherenkov counters, time-of-flight counters, and central drift chamber, , where and are the likelihoods for the kaon and pion hypothesis, respectively. Tracks with are chosen as kaons and those with as pions. Signal events are identified with two kinematic variables: the beam-energy constrained mass, and the energy difference, , where is the beam energy and and are the energy and momentum of the candidate in the center-of-mass frame, respectively. The fit region is defined as and , while the signal-enhanced region is defined as and . When multiple candidates are present in an event, we choose the candidate with the best fit quality from the vertex fit. This is done for 19% of events and the selection efficiency is 92%.
The dominant backgrounds are from continuum process. The events are spherical in shape whereas the particles from continuum events are collimated into two back-to-back jets. We make use of this difference in event topology by using a neural network [8] to combine several shape variables along with other properties of the event that distinguish from events. A requirement on the neural network output ( ) is applied to suppress continuum background. This selection requirement is optimized by maximizing a figure of merit defined as , where () denotes the expected number of signal (background) events in the signal-enhanced region. Background contributions from decays mediated by the dominant transition are investigated with an MC sample of such decays. To suppress these backgrounds, candidates for which the invariant mass of the or system lies in the range 185–188 MeV/ are removed. This selection window corresponds to around the nominal mass [9], where is the mass resolution. Backgrounds from charmless decays are studied with a large MC sample, where one of the mesons decays via a process with a known branching fraction. The study reveals that a few modes contribute in the signal region with a corresponding peak, denoted collectively as the “rare peaking” background. These peaking backgrounds are due to misidentification, which consist of , , and their intermediate resonant modes. Events that remain after removing the peaking components are called the “rare combinatorial” background.
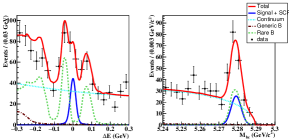
The signal yield is extracted by performing a two-dimensional unbinned extended maximum likelihood fit in and with the likelihood defined as
| (1) |
where denotes the event index, is the yield for the component , is the charge of candidates ( for ), and is the probability density function (PDF) corresponding to the component . Figure 1 shows the fit results of first two bins in the signal-enhanced region. The resulting branching fraction and asymmetry are [10]
| (2) |
and
| (3) |
where the quoted uncertainties are statistical and systematic, respectively.
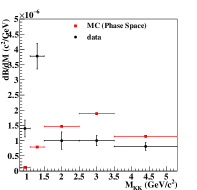
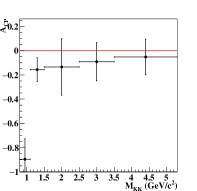
To investigate the localized asymmetry in the low region, we determine the signal yield and in bins of . The fitted results are shown in Table 1 and Fig. 2, where an excess of signal yield as well as a large are seen in , confirming the observations by BaBar and LHCb. We find strong evidence for a large asymmetry of with a significance of for .
| Eff. (%) | ||||
|---|---|---|---|---|
| 0.8–1.1 | 19.7 | |||
| 1.1–1.5 | 19.3 | |||
| 1.5–2.5 | 15.6 | |||
| 2.5–3.5 | 15.1 | |||
| 3.5–5.3 | 16.3 |
3 decay
One of the proposed techniques to measure is to perform an isospin analysis of the entire system [11]. This requires measurements of and for and decays, along with that of and time-dependent asymmetry for the decay. One needs all these observables in order to determine as electroweak tree and loop processes contribute with different phases to decays. The and for are the least well determined among the decays. This decay is also important to probe the disagreement between quantum-chromodynamics-based factorization, which predicts below [12, 13], and previous measurements from Belle and BaBar of [14,15]. Our study is based on a data sample recorded at the resonance with the Belle detector comprising of pairs, which corresponds to an integrated luminosity of 693 fb-1, and an additional 83.35 fb-1 recorded 60 MeV below the resonance.
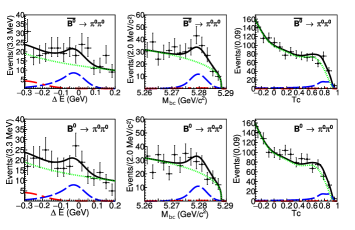
We reconstruct the signal candidate from a pair of candidates, each subsequently decaying to two photons. In addition to photons reconstructed from clusters in the electromagnetic calorimeter (ECL) that do not match any charged track, photons that convert to pairs in the silicon vertex detector (SVD) are recovered and reconstructed as . This provides a 5.3% increase in detection efficiency. These photons must have an energy greater than 50 (100) MeV in the barrel (endcap) region of the ECL. The invariant mass of the two-photon combination must lie in the range , corresponding to around the nominal mass [9]. As in the case of , two kinematic variables and are used to select the signal candidates. All candidates satisfying and are retained for further analysis. For 7.2% of the events, there are multiple candidates in which case we choose the one that minimizes the deviation of the two ’s reconstructed invariant masses from the world average [9]. This criterion selects the true candidate in 90% of MC events.
The dominant background is from continuum process. To suppress this, we develop a Fisher discriminant () out of 16 modified Fox-Wolfram moments [16] combined with the cosine of the polar angle of the candidate with respect to the z-axis and the cosine of the angle between the thrust axis of the candidate and rest of event in the center-of-mass frame. All candidates with values below 0.3 are discarded, removing 72% of the continuum background while retaining 98% of signal events. Background events that arise from transitions are mostly due to out-of-time ECL events originating from interactions, which leave large energy deposits in the ECL. This leads to a “pileup” event resembling a hadronic event with high energy back-to-back photons in the center-of-mass frame, and thus passes the first-level trigger. When combined with random photons from the hadronic interaction, they appear as two ’s with a large invariant mass. These events peak near the nominal mass [9] in . Since the events are recorded in coincidence with hadronic interactions, they also mimic -like events in the continuum suppression variable . A criterion on the trigger time of the ECL crystals, which selects ECL interactions in-time with the rest of the event, is employed to suppress this background removing 99% of pileup at the cost of only 1% of signal. The dominant background from the rare decays ( transitions) is due to , where the charged pion from the subsequent decay is lost. This background peaks at similar values of and as signal, but has shifted to negative values due to energy loss from the missing .
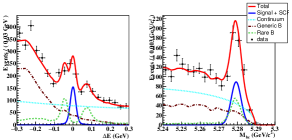
The flavor of the reconstructed candidate is determined via a tagging procedure described in Ref. [17]. The tagging information is given by two parameters: the -flavor charge q [+1 (1) tagging a ] and purity . For the signal extraction, separate PDFs are constructed for the SVD1 (S1) and SVD2 (S2) data sets. We divide the data into seven bins, each for positive and negative tagged -values, for both S1 and S2. The signal yield and are extracted by performing a three-dimensional simultaneous unbinned extended maximum likelihood fit to the subsequent 28 data sets with , and . Figure 3 shows the signal-enhanced projections of the fits to data in the three variables. We obtain a signal yield of events. The results are [18]
| (4) |
and
| (5) |
where the quoted uncertainties are statistical and systematic, respectively.
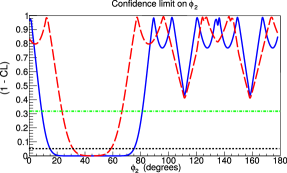
Combining our results for and for with Belle’s previous measurements of and time-dependent asymmetry for [19] and and for [20] allows us to employ the isopsin analysis of Ref. [11] to constrain . The result of the fit is shown in Fig. 4. Our results exclude at 95% confidence level.
4 Conclusion
We have reported the recent measurements from Belle of the branching fractions and asymmetries for and decays using a data sample collected with the Belle detector. For the decay , we confirm the observations by BaBar and LHCb, and find strong evidence for a large asymmetry at the low region. Measurements of and in enable improved constraints on the angle of the CKM unitarity triangle. Although the result is closer to theory predictions than the earlier Belle [14] and BaBar [15] measurements, it is still larger than expectations. The upcoming Belle II experiment [21], with its projected 50 times increased luminosity, will enable precision measurements of and of and other decays to strongly constrain .
Acknowledgement
We thank the KEKB group and all collaborating institutes and funding agencies that support the work of the members of the Belle collaboration. We also extend our gratitude to Indian Institute of Technology Madras for the financial support to attend the conference.
References
- [1] S. Kurokawa and E. Kikutani, Nucl. Instr. Methods Phys. Res., Sect. A 499, 1 (2003); T.Abe et al., Prog. Theor. Exp. Phys. 2013, 03A001 (2013).
- [2] Throughout this paper, the inclusion of the charge-conjugate decay modes is implied unless otherwise stated.
- [3] B. Aubert et al. (BaBar Collaboration), Phys. Rev. Lett. 99, 221801 (2007).
- [4] R. Aaij et al. (LHCb Collaboration), Phys. Rev. Lett. 112, 011801 (2014).
- [5] R. Aaij et al. (LHCb Collaboration), Phys. Rev. D 90, 112004 (2014).
- [6] B. Bhattacharya, M. Gronau, and J. L. Rosner, Phys. Lett. B 726, 337 (2013).
- [7] I. Bediaga, O. Lourenco, and T. Frederico, Phys. Rev. D 89, 094013 (2014).
- [8] M. Feindt and U. Kerzel, Nucl. Instr. Methods Phys. Res., Sect. A 559, 190 (2006).
- [9] C. Patrignani et al. (Particle Data Group), Chin. Phys.C 40, 100001 (2016).
- [10] C.-L. Hsu et al. (Belle Collaboration), Phys. Rev. D 96, 031101 (2017)
- [11] M. Gronau and D. London, Phys. Rev. Lett. 65, 33813384 (1990).
- [12] H. Li and S. Mishima, Phys. Rev. D 73, 114014 (2006).
- [13] H. Li and S. Mishima, Phys. Rev. D 83, 034023 (2011).
- [14] Y. Chao et al. (Belle Collaboration), Phys. Rev. Lett. 94, 181803 (2005).
- [15] J. Lees et al. (BaBar Collaboration), Phys. Rev. D 87, 052009 (2013).
- [16] G. C. Fox and S. Wolfram, Phys. Rev. Lett. 41, 1581 (1978); K. Abe et al. (Belle Collaboration), Phys. Rev. Lett. 87, 101801 (2001); K. Abe et al. (Belle Collaboration), Phys. Lett. B 511, 151 (2001).
- [17] H. Kakuno et al., Nucl. Instrum. Methods Phys. Res., Sect. A 533, 516 (2004).
- [18] T. Julius et al. (Belle Collaboration), Phys. Rev. D 96, 032007 (2017)
- [19] J. Dalseno et al. (Belle Collaboration), Phys. Rev. D 88, 092003 (2013).
- [20] Y.-T. Duh et al. (Belle Collaboration), Phys. Rev. D 87, 031103(R) (2012).
- [21] T. Abe et al., arXiv:1011.0352 [physics.ins-det].