Observing the Next Galactic Supernova with the NOvA Detectors
Abstract
The next galactic core-collapse supernova will deliver a wealth of neutrinos which for the first time we are well-situated to measure. These explosions produce neutrinos with energies between 10 and over a period of tens of seconds. Galactic supernovae are relatively rare events, occurring with a frequency of just a few per century. It is therefore essential that all neutrino detectors capable of detecting these neutrinos are ready to trigger on this signal when it occurs. This poster describes a data-driven trigger which is designed to detect the neutrino signal from a galactic core-collapse supernova with the NOvA detectors. The trigger analyzes blocks of detector activity and applies background rejection algorithms to detect the signal time structure over the background. This background reduction is an essential part of the process, as the NOvA detectors are designed to detect neutrinos from Fermilab’s NuMI beam which have an average energy of –well above the average energy of supernova neutrinos.
on behalf of the NOvA Collaboration
Talk presented at the APS Division of Particles and Fields Meeting (DPF 2017), July 31-August 4, 2017, Fermilab. C170731
I Motivation
During a core-collapse supernova, only 1% of the released gravitational binding energy is in the form of light and kinetic energy of ejecta. The other 99% is released in the form of neutrinos. The next galactic core-collapse supernova therefore represents an incredible opportunity for learning in several arenas of physics. The astrophysical implications include the ability to probe the conditions within the progenitor core throughout the explosion process. One aspect of the explosion that is of particular interest is the evolution of the shock front as it passes through the core before eventually blowing away the outer layers of the stellar envelope. Current simulations show that neutrinos play a vital role in driving the explosion by depositing heat behind the shock[1]. Without this mechanism, the shock eventually stalls before crossing the boundary of the core and the explosion ultimately fails to proceed.
Supernova neutrinos also carry with them valuable information regarding the neutrinos themselves. Comparing the neutrino and photon arrival times can allow further constraints on the absolute neutrino mass, for example. Furthermore the spectral shape of the neutrino energy is dependent on the neutrino mass ordering and oscillation physics[2]. In this way, supernova neutrinos will make a great compliment to the data provided by current accelerator- and reactor-based neutrino oscillation experiments, but they have the potential to provide us with insight that cannot be acquired with experiments on Earth. For example, the densities in the core are sufficiently dense that – scattering interactions become relevant, a phenomenon that has yet to be observed.
The insight provided by supernova neutrinos combined with the rarity of core-collapse supernovae in a galaxy like ours ( per century[3]) underscores the importance of being prepared to record the data so that the opportunity is not missed. The NOvA experiment is making preparations to that end and will be well-situated to make a substantive measurement of the supernova neutrino flux when it arrives.
II The NOvA Detectors
NOvA is a long-baseline neutrino oscillation experiment which makes precision measurements of the and oscillation probabilities. Through these measurements, NOvA is setting competitive limits on mass ordering, the CP-violating phase , and a determination of the octant.
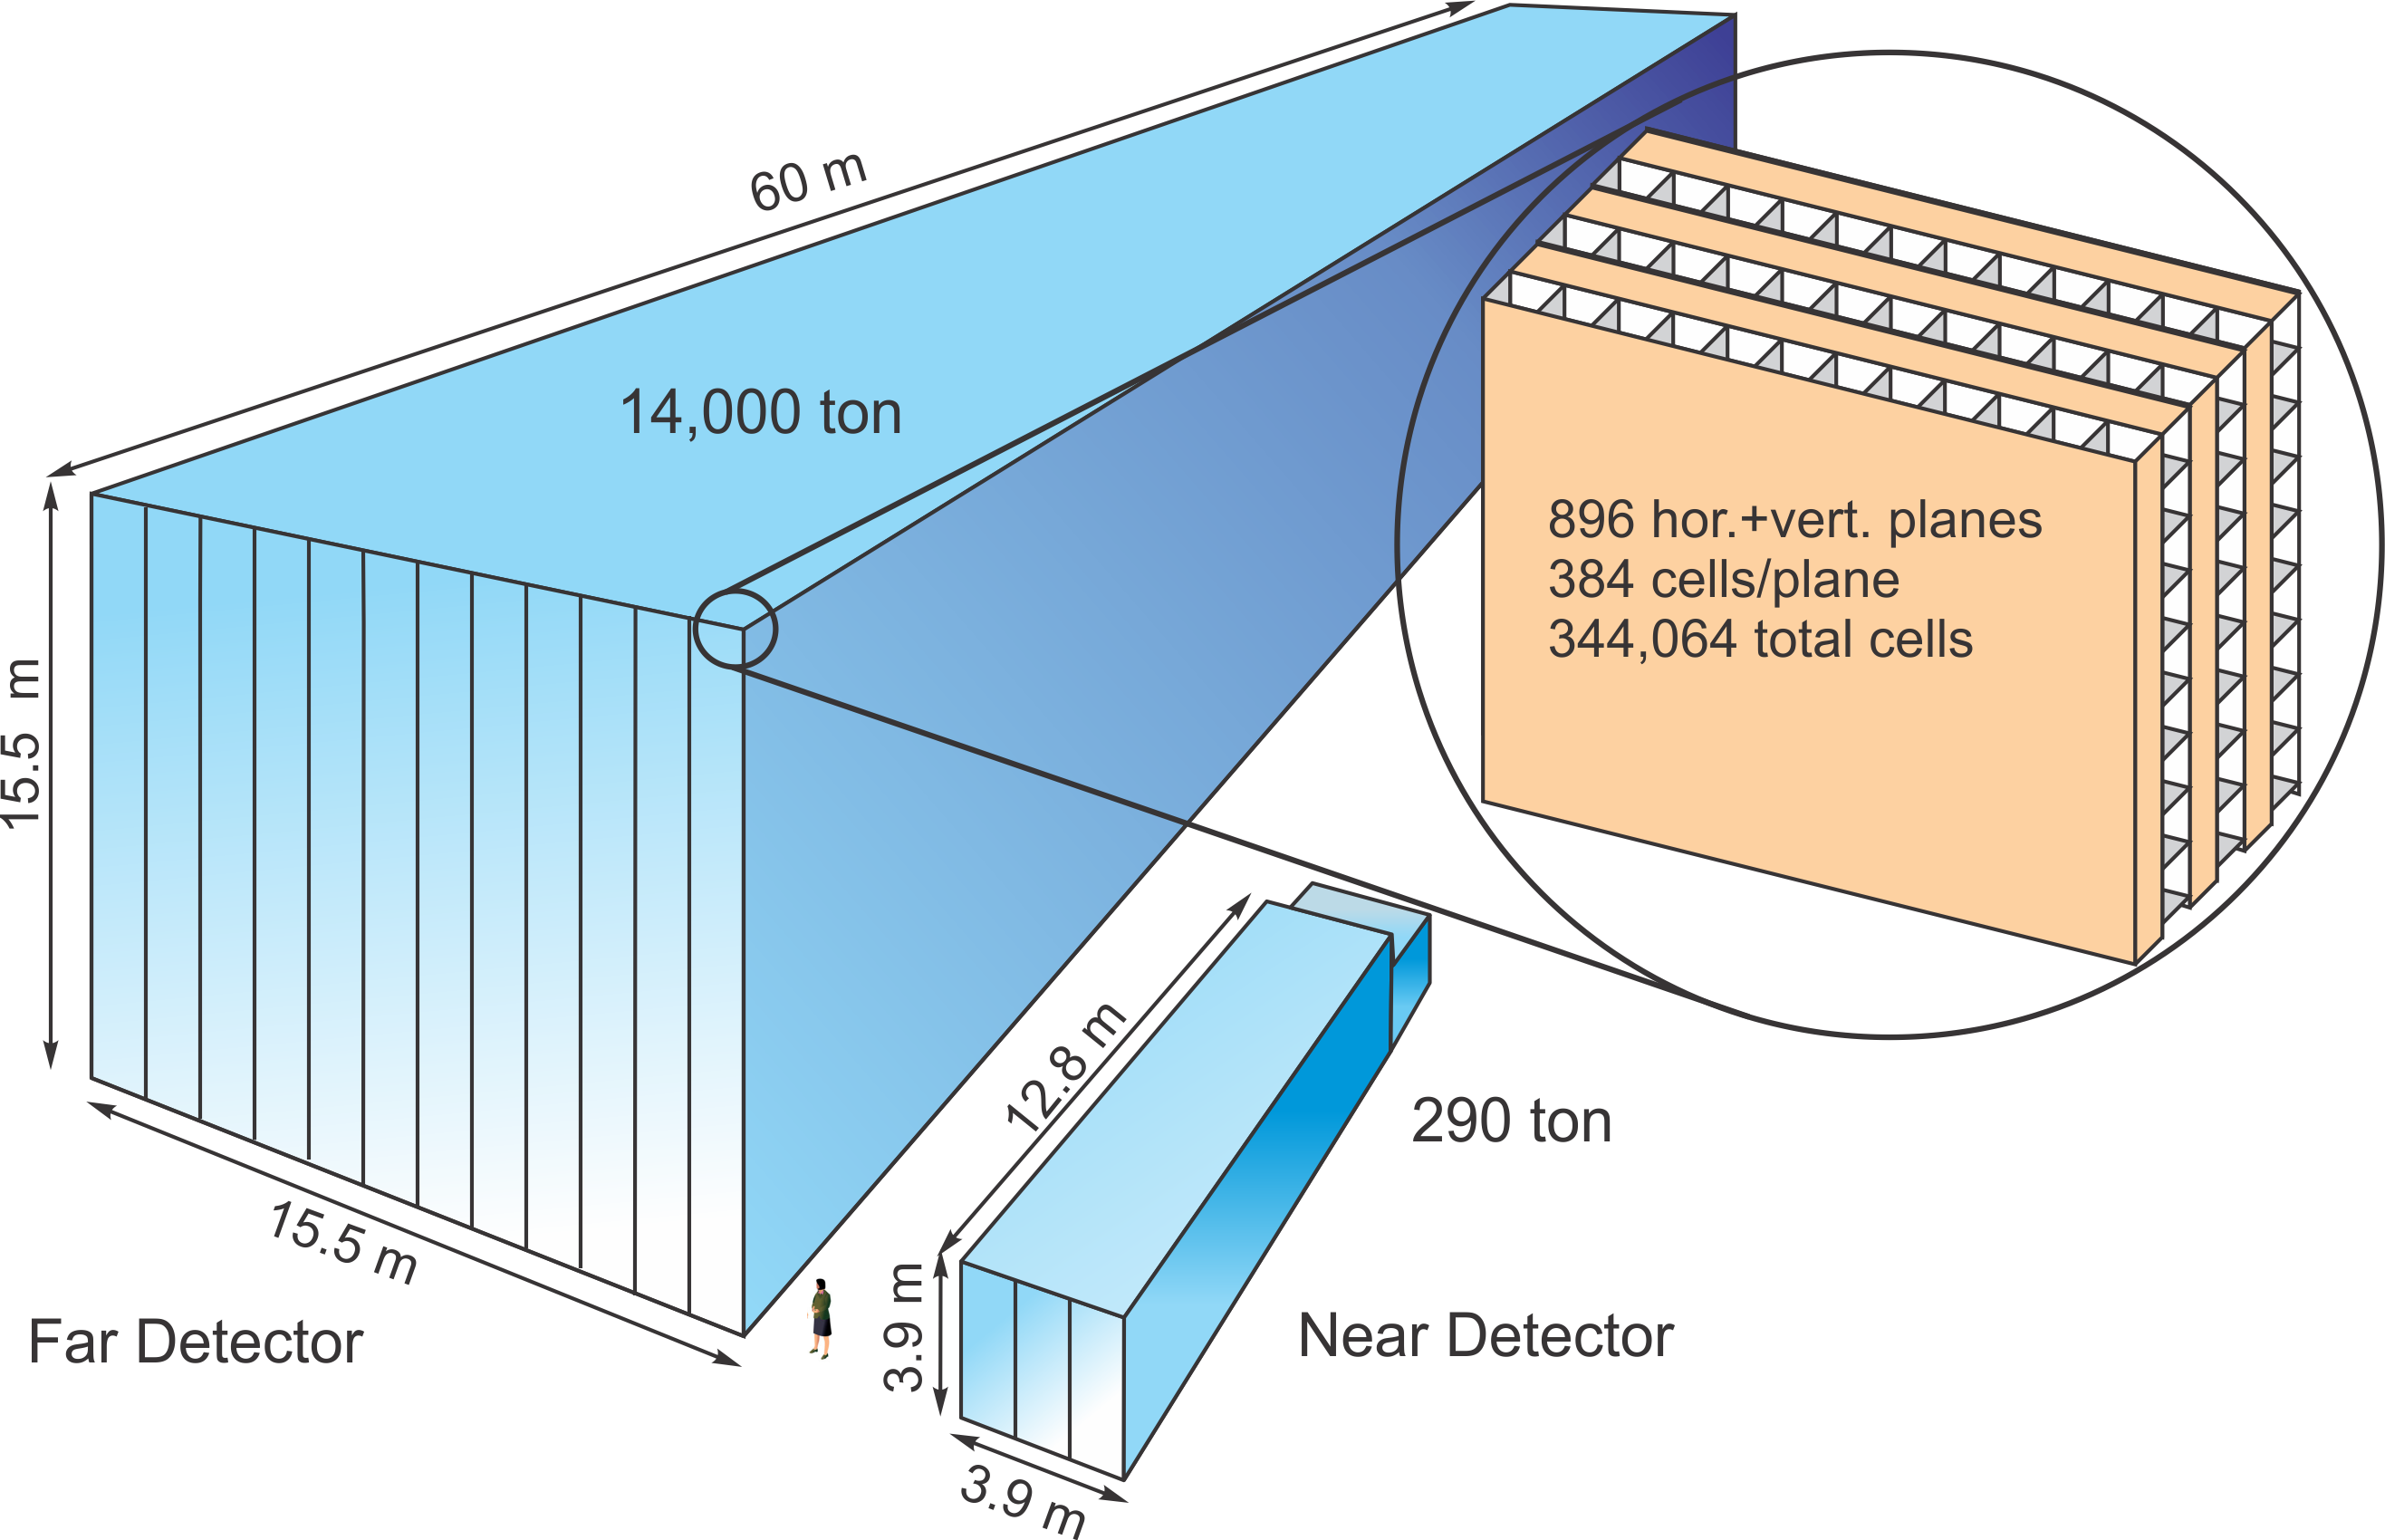
The NOvA detectors are composed of extruded PVC cells which are filled with liquid scintillator. A wavelength-shifting fiber is looped through each cell and connected to an avalanche photo diode which serves to collect the light produced by particle interactions in the scintillator. The near detector at Fermilab is and is situated underground. The far detector weighs and sits away from Fermilab in Ash River, MN at the Earth’s surface. There is a modest barite overburden at the far detector to provide some shielding from cosmic rays.
III Supernova Neutrinos
The supernova explosion process plays out in four stages: collapse, bounce, accretion, and cooling. In the collapse phase, nuclear fusion has ceased in the iron core and it begins to collapse under its own weight. As the collapse proceeds, the flux increases sharply due to electron capture on nuclei and free protons, a process known as “neutronizaton”.
| (1) |
As the collapse proceeds, the density grows. Eventually, densities become large enough that the neutrino diffusion time becomes significant and the neutrinos become trapped. The result is the formation of a “neutrinosphere”, a surface analogous to a the photosphere of a star. At this point, the neutrino luminosity begins to decrease.
When the collapsing core reaches nuclear densities ( ), the strong nuclear force becomes repulsive and the core becomes incompressible, causing the in-falling matter to rebound. This is the bounce phase of the supernova. The result of this bounce is a shock wave that propagates out towards the surface of the iron core. Once the shock front passes the neutrinosphere, the neutrinos are free to escape the star. This burst of neutrinos is observable in the flux and at this time the neutrino luminosity is the largest it will be at any point during the explosion.
The shock wave pushes against in-falling matter as it travels outward. Additionally, photons produced in the shock region are sufficiently energetic to dissociate iron nuclei, an endothermic interaction which robs energy from the shock front. Modern simulations show that the shock front stalls before breaking out of the core and is destined to eventually fall back inward; the explosion fails. But we know from observation that stars successfully explode all the time. One promising solution to this discrepancy is that neutrinos flowing outward and passing the shock front deposit a fraction of their energy into it and eventually revive the stalled shock, allowing the explosion to proceed. This is the accretion phase and is characterized by turbulent motions within the shock front which manifest as correspondingly complex features in the flux profile.
After the shock front has reached the edge of iron core, blowing apart the stellar envelope, only a neutron star remains. This is the Kelvin-Hemholtz cooling phase, wherein the proto-neutron star releases its remaining gravitational binding energy in the form of and of all flavors.
This entire processes plays out in and instant as far as the late star is concerned. The neutronization burst during the collapse and bounce phases occurs within the first of the supernova. The accretion phase lasts for the next . The final stage, cooling, starts nearly after the bounce and lasts for 10s of seconds.
IV Detector Simulation
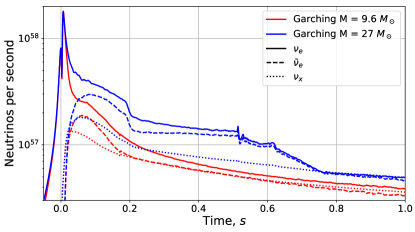
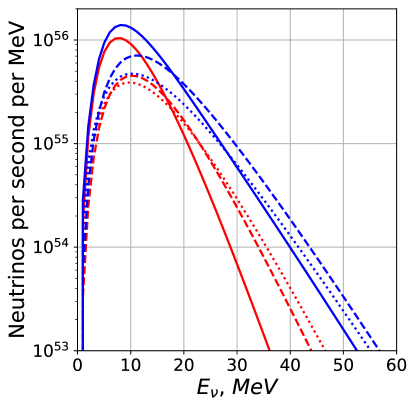
To simulate the supernova signal, the existing simulation framework at NOvA is used with some modifications. This framework uses GENIE[4, 5] for particle generation and GEANT4[6] for particle propagation within the detector geometries. To simulate supernovae, two modifications are needed: neutrino cross sections for energies in the MeV regime must be included in place of those in the GeV typical of our accelerator-based neutrinos, and neutrino fluxes for a simulated supernova. The fluxes we use are from the Garching group[7] and include several progenitor masses (Fig. 2).
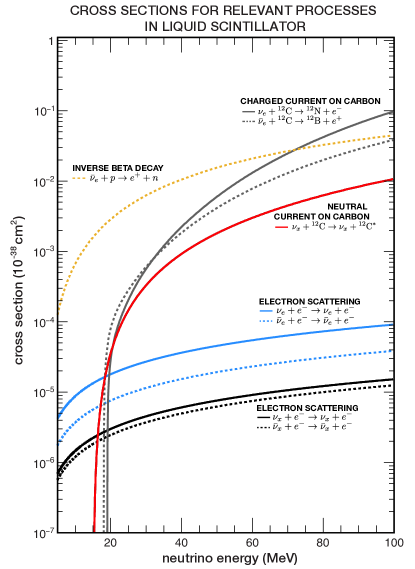
The NOvA detectors consist mainly of plastic PVC extrusions and liquid scintillator. Hydrogen and carbon are the most abundant nuclei in the detector. The most common neutrino interactions in the supernova energy regime are inverse beta decay (IBD) on free protons, charged and neutral current exchanges on 12C, and – scattering (Fig. 3).
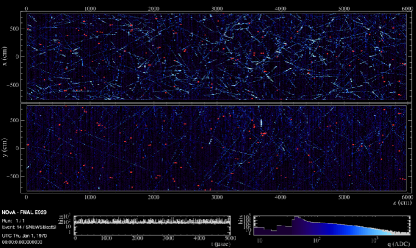
After the simulated particles have been generated and propagated, the detector readout chain is simulated to produce an observed signal which accounts for detector thresholding effects, smearing, and efficiencies. The final step in this simulation chain involves overlaying the simulated signal with real minimum-bias data. The result is a realistic representation of what we might expect to see in the event of a real galactic supernova. Fig. 4 is an example event display in the NOvA far detector of the overlaid signal and minimum-bias data.
V Triggering on Supernovae
The NOvA experiment subscribes to the Supernova Early Warning System (SNEWS)[9], a global network for existing neutrino detectors to disseminate news of a supernova neutrino signal when it arrives. To keep their false alarm rate low, SNEWS requires two independent experiments to report a supernova candidate within a coincidence window. When the alert arrives, both detectors at NOvA will automatically trigger a long readout, writing a continuous stream of data to disk for as long as the DAQ can handle it. Currently NOvA’s DAQ is capable of reading out of continuous data to disk. While NOvA subscribes to alerts from SNEWS, it does not yet contribute to the network itself, but an internal trigger has been developed and is undergoing testing. NOvA expects to join the SNEWS community in the near future.
The current iteration of our developmental internal trigger relies on tagging interaction candidates from the dominant IBD channel. The occurrence rate of these candidates is monitored in real time. If this rate exceeds a chosen threshold, then the trigger fires and a long readout of both NOvA detectors is executed.
The background rate at the far detector is much larger than that of the signal, so some selection is necessary to identify supernova signal candidates. The selection algorithm currently in use is the following:
-
1.
Remove hits from other identified physics
For instance, cosmic tracks and associated activity like Michel electrons. -
2.
Cluster hits in space and time
Reduce the chance we will accidentally tag noise activity, which registers an ADC value similar to our signal. Detector noise is not spatially or temporally correlated. -
3.
Require clusters to have both an – and –component
Having both views enables us to infer a 3D position in the detector and allows for more accurate calibration. This further aids in reducing the noise rate. -
4.
Cut on fiducial volume
-
5.
Cut on total cluster ADC
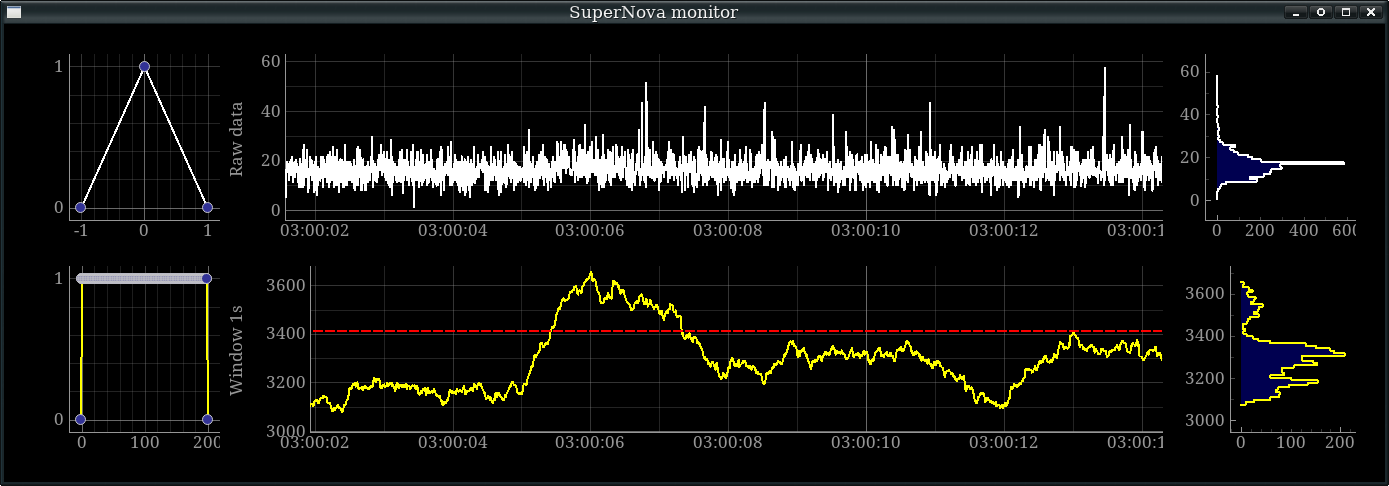
Any hits that remain after applying these selection cuts are considered supernova hit candidates. Fig. 5 shows two time series of the number of supernova hit candidates. A kernel is applied to the raw time series which sums the number of candidates over a sliding window, producing a much cleaner signal. If this enhanced signal exceeds a predetermined threshold, then the trigger will execute. When this occurs, both detectors begin to write continuous chunks of data to disk from their data buffers. They do this until the requested data in the buffer is exhausted to capture as much of the supernova signal as possible.
In addition to capturing this data, once the trigger is fully tested and deployed it will also send an alert to SNEWS. In order to keep the overall false-alarm rate low, SNEWS requires participating experiments to limit their own false-positive rate to less than one per week. This requirement motivates our determination of the triggering threshold.
VI Sensitivity and Outlook
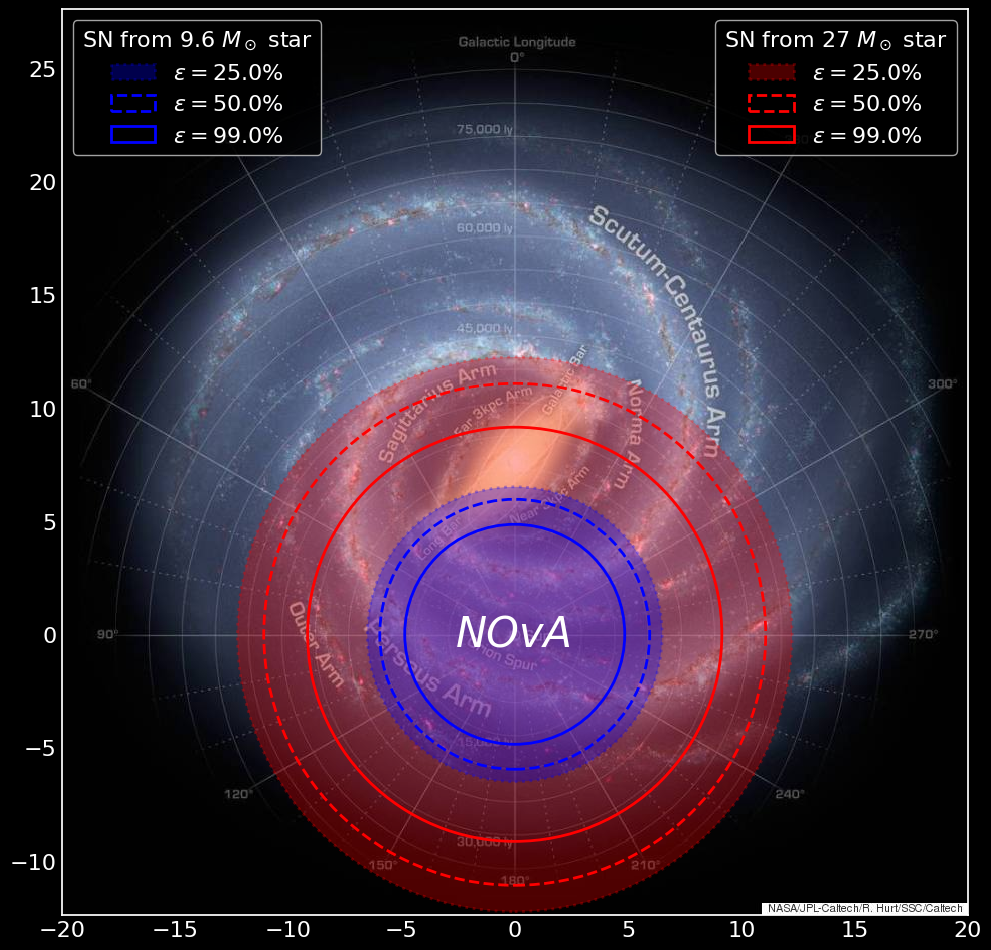
Based on the selection algorithm used to identify supernova hit candidates and the triggering thresholds we’ve chosen, our triggering efficiency for a supernova from a 27 progenitor is around 99% for supernova between Earth and galactic center. Fig. 6 shows efficiency contours overlaid on a map of the Milky Way. Ideally we would want to be sensitive to supernovae from anywhere in our galaxy and efforts are currently underway to achieve that. Improving the candidate selection efficiency and applying more sophisticated kernels on the time series data are being explored, as well as utilizing new technologies like machine learning and computer vision.
References
- [1] H.-T. Janka, “Neutrino-Driven Explosions,” in Handbook of Supernovae, pp. 1–56. Springer International Publishing, 2017. arXiv:1702.08825 [astro-ph.HE].
- [2] K. Scholberg, “Supernova Signatures of Neutrino Mass Ordering,” arXiv:1707.06384 [hep-ex].
- [3] E. Cappellaro and M. Turatto, “Supernova Types and Rates,” in The Influence of Binaries on Stellar Population Studies, pp. 199–214. Dec, 2001. arXiv:0012455 [astro-ph].
- [4] C. Andreopoulos et al., “The GENIE Neutrino Monte Carlo Generator,” Nucl. Instrum. Meth. A614 (2010) 87–104, arXiv:0905.2517 [hep-ph].
- [5] C. Andreopoulos et al., “The GENIE Neutrino Monte Carlo Generator: Physics and User Manual,” arXiv:1510.05494 [hep-ph].
- [6] S. Agostinelli et al., “Geant4—a simulation toolkit,” Nuclear Instruments and Methods in Physics Research Section A: Accelerators, Spectrometers, Detectors and Associated Equipment 506 no. 3, (2003) 250 – 303.
- [7] A. Mirizzi, I. Tamborra, H.-T. Janka, N. Saviano, K. Scholberg, R. Bollig, L. Hüdepohl, and S. Chakraborty, “Supernova neutrinos: production, oscillations and detection,” Nuovo Cimento Rivista Serie 39 (2016) 1–112, arXiv:1508.00785 [astro-ph.HE].
- [8] K. Scholberg, “SNOwGLoBES: SuperNova Observatories with GLoBES.” http://webhome.phy.duke.edu/~schol/snowglobes/.
- [9] P. Antonioli et al., “SNEWS: the SuperNova Early Warning System,” New Journal of Physics 6 no. 1, (2004) 114.