ALMA 1.3 Millimeter Map of the HD 95086 System
Abstract
Planets and minor bodies such as asteroids, Kuiper-belt objects and comets are integral components of a planetary system. Interactions among them leave clues about the formation process of a planetary system. The signature of such interactions is most prominent through observations of its debris disk at millimeter wavelengths where emission is dominated by the population of large grains that stay close to their parent bodies. Here we present ALMA 1.3 mm observations of HD 95086, a young early-type star that hosts a directly imaged giant planet b and a massive debris disk with both asteroid- and Kuiper-belt analogs. The location of the Kuiper-belt analog is resolved for the first time. The system can be depicted as a broad (0.84), inclined (30°3°) ring with millimeter emission peaked at 2006 au from the star. The 1.3 mm disk emission is consistent with a broad disk with sharp boundaries from 1066 to 32020 au with a surface density distribution described by a power law with an index of –0.50.2. Our deep ALMA map also reveals a bright source located near the edge of the ring, whose brightness at 1.3 mm and potential spectral energy distribution are consistent with it being a luminous star-forming galaxy at high redshift. We set constraints on the orbital properties of planet b assuming co-planarity with the observed disk.
Subject headings:
circumstellar matter – stars: individual (HD 95086) – millimeter: stars, planetary systems1. Introduction
Debris disks were discovered by IRAS (Aumann et al., 1984) as infrared excess emission from dust orbiting stars and sustained by collisions of leftover planetesimals and cometary activity. They often have a structure analogous to that of minor body belts in the solar system, with asteroid- or Kuiper-belt components. The majority of the known debris disks are massive, Kuiper-belt analogs not only because the collisional evolution proceeds more slowly at large orbital distances but also stars are faint in the far-infrared, making positive identifications of excess from cold debris much easier. It is interesting to note that the first Kuiper Belt Objects in our own solar system were not discovered until 1992 (Jewitt & Luu, 1993), eight years later than the IRAS discovery.
Planets, minor bodies, and leftover planetesimals all form as a consequence of agglomeration processes that occur within the protoplanetary disk. Interactions between them during the formation and subsequent evolution leave signs in the disk that can be used to study the current state and past history of a planetary system. Therefore, these faint dusty disks are excellent tools to understand the outer zones of exoplanetary systems including our own.
With sensitive infrared surveys, hundreds of debris disks are known (Matthews et al., 2014), providing a rich resource to study planetary system evolution and architecture. Although thousands of exoplanets and candidates have been discovered through radial velocity and transit measurements, this breakthrough is currently biased toward the inner zones of systems, not sensitive to planets like Jupiter and Saturn beyond 5 au. Recent improvements in high contrast imaging have enabled us to find planets out at the same stellocentric distance scales as the debris disks. Fomalhaut (Kalas et al., 2008), HR 8799 (Marois et al., 2008, 2010), Pic (Lagrange et al., 2009), HD 95086 (Rameau et al., 2013), HD 106906 (Bailey et al., 2014), and 51 Eri (Macintosh et al., 2015) are prominent examples of such systems known to host both debris disks and directly imaged planets.
From the observed dust temperatures derived from disk spectral energy distributions (SEDs) of 200 debris disks, Ballering et al. (2013) report a weak trend that the inner edge of the cold planetesimal zone appears to depend on the luminosity/temperature of the star, indicating a signpost for planetary migration and/or shepherding. However, disk extents estimated from SEDs are degenerate. Any inferred radii depend strongly on the assumed composition and the particle size distribution. Due to this degeneracy, it is very difficult to translate SED measurements into physical sizes directly. Even when there are resolved images available (mostly in the far-infrared), the exact location of the parent bodies is still uncertain due to the effect of non-gravitational forces (radiation and drag) on small grains. The true parent-body distribution in debris disks can be provided by resolved submillimeter/millimeter images which probe large (mm-size) grains that stay close to their parent bodies. Disk morphologies suggestive of influences from unseen planets, such as resonance clumps (Wyatt, 2003) and/or apo-center glow (Pan et al., 2016), are also best observed at submillimeter/millimeter wavelengths (e.g., Ertel et al. 2012; Löhne et al. 2017). Existing ALMA data on debris disks show a large variety of Kuiper-belt analogs: some systems have very narrow rings of parent bodies (e.g., Fomalhaut, Boley et al. 2012; MacGregor et al. 2017, and Eri, Booth et al. 2017), and some have either multiple rings (HD 107146, Ricci et al. 2015a) or broad disks (HR 8799, Booth et al. 2016; Ceti, MacGregor et al. 2016; 61 Vir, Marino et al. 2017). The parent body distributions are therefore giving insights to the possible overall structure of the planetary systems.
HD 95086 is a young (174 Myr, Meshkat et al. 2013) A8 star that possesses a large infrared excess, indicative of a massive debris disk (Chen et al., 2012), and a 5 planet at the projected distance of 56 AU (Rameau et al., 2013, 2016). Compared to the Hipparcos catalog, the Gaia DR1 catalog gives a slightly closer distance, 83.81.9 pc (Gaia Collaboration et al., 2016), which we adopt throughout the paper. Its disk was marginally resolved by Herschel and found to be inclined at 25∘ from face-on (Moór et al., 2013). Analysis of its detailed infrared SED and re-analysis of the resolved images suggest that the debris structure around HD 95086 is very similar to that of HR 8799: a warm (170 K) belt, a cold (60 K) disk, and an extended disk halo (up to 800 AU) (Su et al., 2015). Modeling the disk surface brightness distribution at 70 and 160 m suggests that the extended emission seen in the far-infrared is largely from the small grains produced by frequent collisions due to dynamical stirring of planetesimals and launched from the system by stellar radiation in the form of a disk halo. Therefore, the inclination derived from the Herschel images might not be a true representative of the planetesimal disk or be subject to a large error. It is then crucial to measure the intrinsic distribution of the planetesimal population, as traced by millimeter emission from large grains, in order to properly characterize the possible perturbers, HD 95086 b and any unseen planet(s) interior to the cold disk.
Here we present the first millimeter observations of the HD 95086 system, obtained by the Atacama Large Millimeter/submillimeter Array (ALMA). Our observations reveal the location of the cold Kuiper-belt analog for the first time. The paper is organized as follows. Details about the observations and general data reduction are given in Section 2. In Section 3, we first present the dust continuum map of the system which can be described as an inclined ring plus a bright point source near the outer edge of the ring. We then determine the properties of the disk (flux and geometry) and those of the bright source (flux and position) using both visibilities and imaging model approaches. In Section 4, we revise the disk SED based on the new observations, discuss the ring’s width and possible asymmetry, the likely nature of the bright source, and obtain new constraints on HD 95086 b. Conclusions are given in Section 5.
| Date | Block UID | # of Used | Baselines | PWV | Tsys | Time on Source | Hour Angle | Flux Calibrator |
|---|---|---|---|---|---|---|---|---|
| Antennae | [m] | [mm] | [K] | [min] | at mid-point | |||
| #2013.1.00773.S, data set A | ||||||||
| 2015-01-28 | X1beb | 38 | 15.1 – 348.5 | 1.27 | 83.7 | 45.86 | +02:25 | J1107 |
| 2015-04-04 | Xba2 | 39 | 15.1 – 327.8 | 1.02 | 73.8 | 45.86 | –00:38 | Callisto |
| 2015-04-05 | X267e | 39 | 15.1 – 327.8 | 1.28 | 77.2 | 45.86 | –00:09 | Ganymede |
| 2015-04-05 | X2a9e | 39 | 15.1 – 327.8 | 1.27 | 77.3 | 45.86 | +01:27 | J1107 |
| 2015-04-05 | X2e6d | 39 | 15.1 – 327.8 | 1.25 | 80.7 | 45.86 | +02:55 | Titan |
| 2015-04-06 | X14f2 | 36 | 15.1 – 327.8 | 1.23 | 76.5 | 45.86 | +01:47 | J1107 |
| #2013.1.00612.S, data set B | ||||||||
| 2015-04-10 | X1412 | 35 | 15.3 – 348.5 | 2.14 | 101.0 | 45.36 | +00:14 | Ganymede |
| 2015-04-10 | X1d34 | 35 | 15.3 – 348.5 | 2.38 | 108.9 | 45.36 | +02:16 | J1107 |
| 2015-04-14 | Xbb6 | 36 | 15.3 – 348.5 | 3.65 | 144.6 | 45.36 | –01:18 | Ganymede |
| 2015-04-23 | X1462 | 39 | 15.1 – 348.5 | 1.88 | 103.3 | 45.36 | +03:12 | Titan |
| 2015-05-01 | X883 | 37 | 15.1 – 348.5 | 1.95 | 100.7 | 45.36 | +00:55 | Ganymede |
| 2015-05-02 | Xd15 | 37 | 15.1 – 348.5 | 1.18 | 85.0 | 45.36 | +00:15 | Ganymede |
2. Observations
We observed HD 95086 with ALMA in Band 6 (1.3 mm) under two projects: #2013.1.00773.S, PI: Su (referred to as data set A) and #2013.1.00612.S, PI: Booth (referred to as data set B). The observations consist of 12 single pointing block executions centered at HD 95086 (phase center RA: 10:57:02.91 Dec: –68:40:02.27 (J2000)). The majority of the observations were obtained in April/May 2015, while one was done in January 2015. The proper motion of the star (pmra = –41.110.03 mas/yr and pmdec = 12.910.03 mas/yr) gives 11 mas offset for the three month time span, i.e., there is no significant pointing difference in these observations. Table 1 lists the details about these observations including dates, block id, number of antennae used, projected baselines, weather conditions, on-source integration time and flux calibrators.
The correlator set-up was designed to optimize the continuum sensitivity, but also covered the 12CO J=2-1 transition at 230.538 GHz with 3840 channels over a bandwidth of 1.875 GHz. The set-up was slightly different between the two projects. The four basebands were centered at 215, 217, 230 and 232.5 GHz for data set A, but at 231.87, 232.55, 245, 247 GHz for data set B. The raw data were processed by the ALMA Regional Centers using the CASA package (ver. 4.2.2 for data set A and ver. 4.3.1 for data set B). Nearby quasars and solar system objects (Callisto and Ganymede) were used for flux calibration, resulting in an absolute flux uncertainty 10 % (the Technical Handbook for cycle 2). The total on-source integration time is 4.58 hours for data set A, and 4.54 hours for data set B. No CO detection was reported in the pipeline reduced product. Details regarding the CO gas in the system will be reported in another publication (Booth et al. in prep.).
3. Results and Analysis
3.1. Continuum Emission
We generated the calibrated measurement sets using the scripts provided by the ALMA project for each of the data sets. We then split the observations into different fields (pointing) and spectral windows by binning the time sampling to 30 s and averaging the spectral channels with a width of 128 channels. These averaged, binned visibilities were then exported to FITS format for further analysis using the MIRIAD software (Sault et al., 1995). Visibilities were then inverted with natural weighting, deconvolved, and restored to generate a final synthesized map using the standard procedures in MIRIAD.
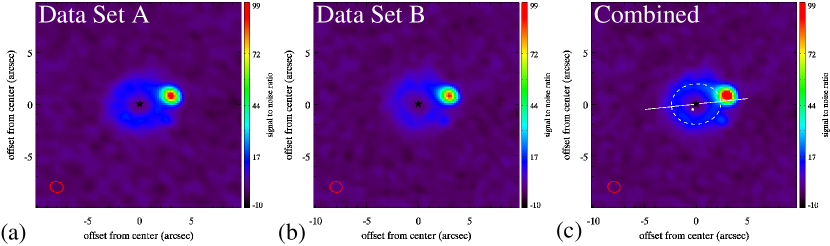
For the data set A, the synthesized continuum image is shown in Figure 1a with a synthesized beam of 128103 and a position angle (P.A., measured from North toward the East) of 75.1°, and a rms of 8.7 Jy beam-1. For the data set B, the image is shown in Figure 1b with a synthesized beam of 120104 and a P.A. of 79.4°, and a rms of 11.0 Jy beam-1. In both images, a ring-like structure is clearly seen with a very bright point-like source offset from the star 3″ away at a P.A. of 293° (–67°). Since the quality (rms and beam) of both data sets was similar, we then combined both data sets and generated a slightly deeper continuum map (shown in Figure 1c). The combined continuum map has a synthesized beam of 122103 and a P.A. of 77.4°, and a rms of 7.5 Jy beam-1. The ring’s circumference is detected at signal-to-noise (S/N) 15 per beam, and is slightly inclined from face-on. We estimate the pointing accuracy of the data, resolution/signal-to-noise, to be 013 since the main ring is detected at S/N10.
We adopt two approaches to explore the best-fit parameters for the HD 95086 system: (1) visibilities fitting and (2) image plane fitting. In both approaches, we assume the millimeter emission can be described by an optically and geometrically thin (no scale height) model plus a point source offset from the center. We explore two simple axi-symmetric models to describe the disk: (1) a two-boundary disk confined in a radial span of and with a surface density power law of where is the stellocentric distance, and (2) a Gaussian ring defined by the peak () and the width (FWHM) of the ring (). For the millimeter emission of the disk (i.e., dominated by large grains), we expect the dust temperatures follow where is the stellar luminosity in units of the solar luminosity (6 for HD 95086 using the new distance) and is in au. The disk has a total flux, , at 1.3 mm, and its mid-plane is assumed to incline by an angle of from face-on (i.e., °) with the major axis along a position angle (P.A.). There are three parameters describing the bright source: the total flux () and offset from the star ( and ). We discuss the results in the following subsections for both approaches, and synthesize the final best-fit model parameters in Section 3.4.
| Parameter1 | Description | Two Boundary Disk | Gaussian Ring | |||||||||
|---|---|---|---|---|---|---|---|---|---|---|---|---|
| Visibilities modeling | Dirty map modeling | Visibilities modeling | Dirty map modeling | |||||||||
| Value | 1 | Value | 1 | Value | 1 | Value | 1 | |||||
| [au] | inner belt radius | 107 | +6 –5 | 110 | +3 –4 | |||||||
| [au] | outer belt radius | 327 | +6 –7 | 328 | +7 –6 | |||||||
| surface density index | –0.48 | +0.34 –0.38 | –0.42 | +0.13 –0.12 | ||||||||
| [au] | peak radius | 204 | +7 –7 | 208 | +4 –3 | |||||||
| [au] | width (FWHM) | 176 | +6 –6 | 179 | +6 –6 | |||||||
| [mJy] | total belt flux density | 2.87 | +0.10 –0.11 | 2.89 | +0.08 –0.08 | 2.91 | +0.10 –0.18 | 3.07 | +0.09 –0.09 | |||
| [mJy] | flux of Pt.2 | 0.88 | +0.05 –0.05 | 0.92 | +0.01 –0.01 | 0.87 | +0.06 –0.06 | 0.92 | +0.01 –0.01 | |||
| x [″] | RA offset of Pt. | –3.06 | +0.04 –0.04 | –3.07 | +0.01 –0.01 | –3.05 | +0.05 –0.05 | –3.07 | +0.01 –0.01 | |||
| y [″] | Dec offset of Pt. | 0.85 | +0.05 –0.05 | 0.85 | +0.01 –0.01 | 0.85 | +0.05 –0.05 | 0.85 | +0.01 –0.01 | |||
| [°] | inclination | 36 | +3 –2 | 35 | +2 –2 | 36 | +2 –2 | 34 | +2 –2 | |||
| P.A. [°] | position angle | 98 | +3 –3 | 98 | +3 –3 | 98 | +3 –4 | 96 | +4 –3 | |||
3.2. Visibilities Modeling Approach
We model the visibilities for both data sets simultaneously. To minimize the free parameters, we assume no offset between the center of the disk and the star. Therefore, there are a total of eight/nine free parameters to describe the system in both axi-symmetric disk models: two/three parameters for the disk density distribution (, and for the two-boundary disk, or and for the Gaussian ring), two parameters for the disk viewing geometry ( and P.A.), the total flux of the disk (), and three parameters for the point source (, and the total flux ). We determine the best-fit values for these free parameters independently by adopting the MCMC approach outlined in MacGregor et al. (2013). For all parameters, we assume uniform priors and require that the model be physically plausible (flux greater than zero and the outer radius larger than the inner one).
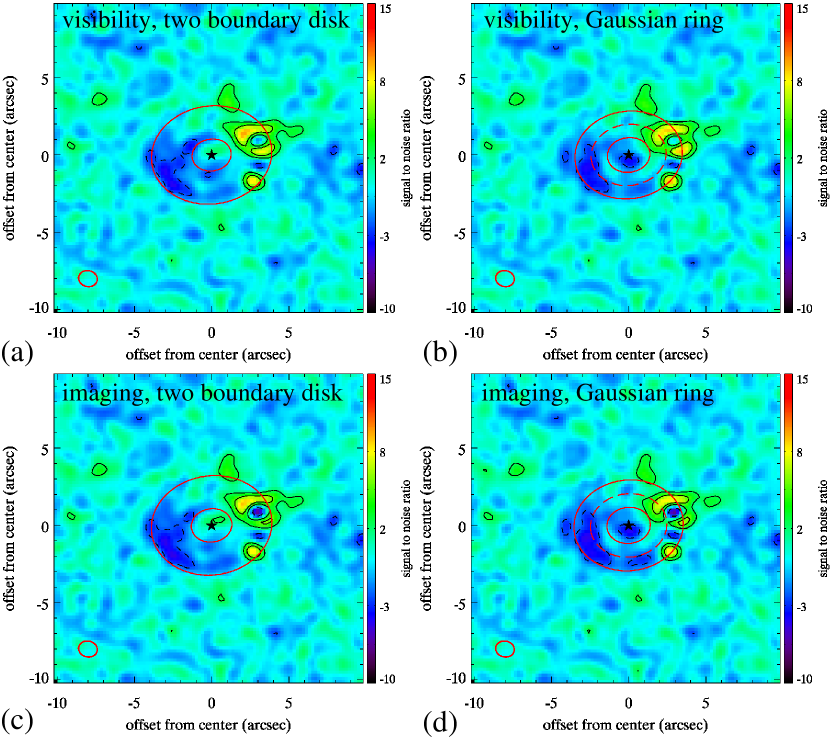
The best-fit parameters and their 1 uncertainties are given in Table 2. For each set of the best-fit parameters, we generated a high resolution model image and transformed it to the visibility domain according to the observation. We then constructed the residual map by subtracting the model from the data in the visibility domain and imaging the residual using the same procedures in MIRIAD. The residual maps are shown in Figure 2. Overall, the residuals are within 3 for the main disk. The subtraction of the bright source is not perfect, and creates an over-subtraction at the center of the bright source, and positive residuals in the area around it, suggesting the source might be extended . In all residual maps, there appears to be another faint (S/N9) source 25 south of the bright one. The two axi-symmetric models yield very similar parameters in terms of the disk flux, viewing geometry and point source parameters. However, the residual in the main disk is slightly smaller in the Gaussian ring model. Although the residuals in the main disk tend to be more negative in the east side of the disk, unfortunately the bright source is along the west side of the major-axis, making it difficult to assess any asymmetric structure present in the disk (more detail is given in Section 4.2).
3.3. Imaging Plane Modeling Approach
Given the good S/N detection of the main disk, we also try to derive the best-fit parameters for the two models by fitting in the image plane. Details about this approach can be found in Booth et al. (2016). We use the combined synthesized map for the MCMC search. For experiments, two more free parameters are included in this part of the fitting. For both models, the center of the ring is not fixed at the star position. Although a small offset111016 and 006 for the two boundary model, and 021 and 008 for the Gaussian ring is preferred for both models, these values are within one pixel of the reconstructed maps (02 per pixel) and within 2 of the pointing accuracy ( 013), therefore not significant. The final best-fit parameters and the residual maps are also given in Table 2 and Figure 2. Overall, the best-fit parameters agree with the ones derived from the visibilities method within the uncertainties, except for the total fluxes of the ring and the point source where the derived flux using the imaging approach is consistently larger. We also note that the estimated uncertainties are also smaller using the image plane approach. This is because the MCMC uncertainty depends strongly on the weightings of the data. The noise within the beam is highly correlated, and the image deconvolution (the “CLEAN” procedure) treats noise non-linearly, both resulting in smaller uncertainties for the MCMC image fitting that might not be statistically robust. A factor equivalent to the square root of the beam size in pixels is included to mitigate the correlated noise, but this is only an approximation as it assumes a Gaussian beam whereas the dirty beam has some low level, non-Gaussian structure that this factor cannot account for. Fitting in the image domain is computationally faster, and can achieve the same result in terms of geometric parameters for high S/N data; however, we caution against relying on the robustness of the uncertainties using imaging plane fitting.
| Parameter | Description | Point 1 | Point 2 |
|---|---|---|---|
| [mJy] | flux density | 0.81 0.03 | 0.100.02 |
| x [″] | RA offset | –3.08 0.04 | –2.800.03 |
| y [″] | Dec offset | 0.83 0.05 | –1.610.04 |
| Parameter2 | Description | Two Boundary Disk | Gaussian Ring | |||||||||
|---|---|---|---|---|---|---|---|---|---|---|---|---|
| Visibilities | Dirty map | Visibilities | Dirty map | |||||||||
| Value | 1 | Value | 1 | Value | 1 | Value | 1 | |||||
| [au] | inner belt radius | 105 | +5 –5 | 106 | +5 –4 | |||||||
| [au] | outer belt radius | 331 | +4 –6 | 312 | +7 –8 | |||||||
| surface density index | -0.5 | +0.3 –0.3 | –0.5 | +0.2 –0.2 | ||||||||
| [au] | peak radius | 199 | +6 –6 | 200 | +4 –4 | |||||||
| [au] | width (FWHM) | 169 | +5 –6 | 167 | +7 –7 | |||||||
| [mJy] | total belt flux density | 2.77 | +0.19 –0.07 | 2.57 | +0.09 –0.08 | 2.72 | +0.12 –0.08 | 2.74 | +0.09 –0.10 | |||
| xc [″] | RA offset of ring | 0.15 | +0.04 –0.04 | 0.09 | +0.03 –0.03 | 0.15 | +0.05 –0.04 | 0.12 | +0.04 –0.04 | |||
| yc [″] | Dec offset of ring | 0.05 | +0.04 –0.04 | 0.05 | +0.03 –0.03 | 0.06 | +0.04 –0.04 | 0.08 | +0.03 –0.03 | |||
| [°] | inclination | 31 | +3 –3 | 28 | +3 –3 | 31 | +2 –3 | 30 | +3 –3 | |||
| P.A. [°] | position angle | 98 | +4 –3 | 97 | +6 –6 | 98 | +4 –4 | 95 | +5 –5 | |||
3.4. Best-Fit Disk Parameters by Minimizing Other Contamination
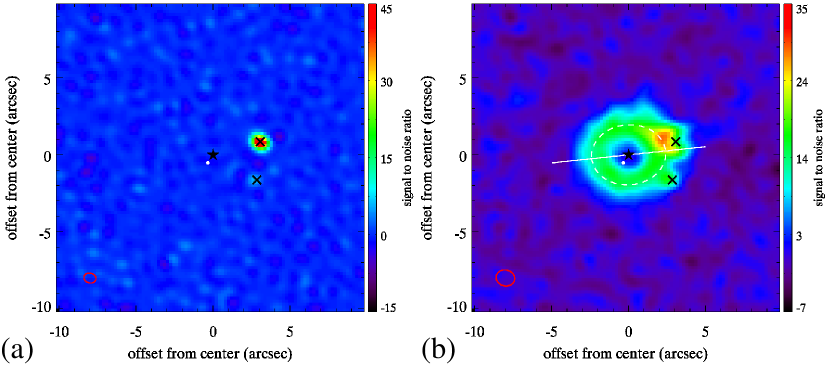
Since ALMA is sampling the sky with many different baselines (i.e., spatial scales) through interferometry, we can better assess the properties of the bright source by generating a map with only the long baseline data (80 = 31) where any extended structure with sizes 31 (i.e., the disk emission) is filtered out. The long baseline map is shown in Figure 3a. Within 35 radius from the star, there are two sources (detected above 8 ) that appear in the long baseline map. The measured FWHM of the faint source is 079064, the same as the synthesized beam in the long baseline map, while the FWHM of the bright source is 8% broader, 085070. To evaluate whether the threshold defining the long baseline data affects the FWHM of the bright source, we also generated the long baseline maps with different thresholds between 60 to 80 . The FWHM of the bright source is consistently broader than the synthesized beam by 8%. Furthermore, we generated individual, long baseline maps per data set to see if there exists a flux difference between the two data sets for the bright source. Taken at face value, the bright source is about 5% brighter in data set B. Given the typical absolute flux uncertainty (10%) in the ALMA data, the flux difference is not significant. The properties (offset and flux density) of the two point sources are determined using ’uvmodelfit’ in CASA, and given in Table 3. Using the long baseline data, the flux of the bright source is 9% lower than the derived flux by fitting the disk and point source simultaneously.
We then generated a “disk-only” map by subtracting the best-fit point sources in the visibility domain. The “disk-only” map is shown in Figure 3b. The subtraction of the bright source is far from perfect. There is still significant flux (25 ) near the east side of the bright source, which could be part of the disk structure or the bright source has a non-symmetric, extended shape. If the bright source is a dusty galaxy in nature (see Section 4.3), it is very likely to have an irregular shape, making it challenging to separate it from the disk without high angular resolution observations. The subtraction of the faint source is better. The emission near the position of the faint source is more smooth, but it does appear that the disk flux extends toward the faint source, explaining the residual in Figure 2. Similarly, the observed resolution prevents further assessment.
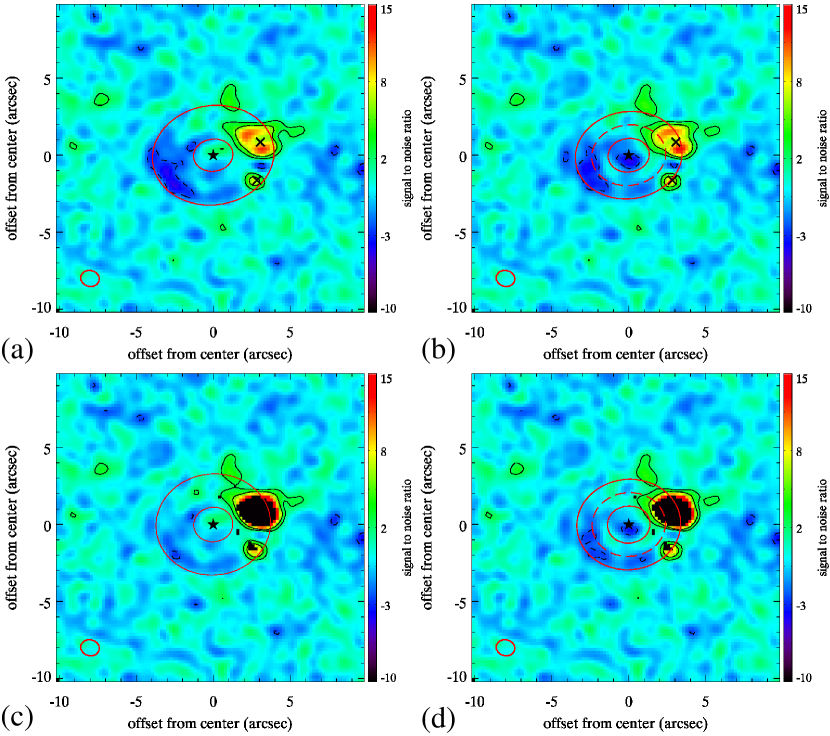
To evaluate the impact of the two sources on the derived disk parameters, we searched for the best-fit disk parameters using the visibility approach by fixing the properties of the two point sources. The best-fit disk parameters are basically the same as the ones without fixing the two point sources (Section 3.2). The residual maps are shown in Figures 4a and 4b. Compared to Figures 2a and 2b, the fits with the fixed point source properties have no over subtraction at the position of the bright source, but the residual around the bright source is higher.
We performed similar searches using the image plane approach by masking out the pixels that have fluxes 0.1 mJy beam-1 (the region around the bright source and the center of the faint one). To explore whether allowing a slight offset between the star and the disk center can improve the results, we also allow offsets in the MCMC parameters. The best-fit disk parameters are given in Table 4. Interestingly, the disk size parameters are slightly smaller than the ones derived in Section 3.3, but still within uncertainties. The residual maps are shown in Figures 4c and 4d. The derived disk fluxes is also smaller, reducing the over-subtraction in the east side of the disk. The presence of the bright source is undoubtedly affecting the derived disk parameters. Unfortunately, there is no easy way to mask out the contribution of the bright source in the visibility domain since the bright source contributes to all baselines. We tried to minimize the impact of the bright source by fitting it as a Gaussian profile in visibilities, allowing for some sort of extension. The results are also given in Table 4. Similar to the image plane approach, the disk size parameters are also slightly smaller than the ones derived in Section 3.2. The Gaussian parameters for the bright source are basically the same as the synthesized beam, but with much less flux compared to the fits derived from the long baseline data (Table 3). The residual maps (not shown) are neither better than the ones in Figures 4a and 4b nor than those in Figures 2a and 2b as a result.
We synthesized the various fitting results as follows. The disk has a total flux density of 2.790.1 mJy at 1.3 mm, and is inclined by 30°3° from face-on with a P.A. of 97°3°. It is interesting to note that the best-fit models (Table 4) all prefer to have the ring center east of the star by 01. Since the star is not detected in the ALMA data, the “translated” pointing accuracy cannot confirm such an offset. The disk is very broad (0.84) in the millimeter continuum, and its width is resolved by 1.7 beam widths. As a result, we cannot determine the exact disk density distribution nor the offset between the star and disk center. For the two-boundary model, the disk can be described as having sharp boundaries at 1065 au and 32010 au with a surface density power index of –0.50.3. For the Gaussian ring, the disk is peaked at 2006 au with a width of 1687 au. The reduced chi-squared () is 1.20 for the two-boundary model, but 1.15 for the Gaussian ring model with the total number of visibilities (574358) in the fitting; similar numbers are also found using the image plane approach. Based on the , the Gaussian ring model gives a slightly better fit; however, the number of free parameters is different (7 vs. 8), and some of the parameters are correlated.
4. Discussion
4.1. Revised 3-Component SED Model
Su et al. (2015) examined the resolved disk images of HD 95086 from Herschel and argued, by a detailed SED analysis, that the system is likely to possess three debris structures. The three debris components are very similar to the ones of the HR 8799 system – (1) an inner warm emission representing the dust in an asteroid-belt analog, (2) an outer cold emission representing the dust in a Kuiper-belt analog, and (3) an extended disk halo surrounding the aforementioned two components and composed of small grains. Since only the extended disk halo is resolved in the far infrared, the exact boundaries of the different components are very uncertain and not well constrained by the SED model. The presence of an asteroid-belt analog is only constrained by the excess emission detected in the Spitzer IRS spectrum and unresolved MIPS 24 photometry; therefore, its location is set by the observed dust temperature (175 K, i.e., 7–10 au). Given the warm temperature and large distance to the system, this asteroid-belt component is not expected to be detected nor resolved by the ALMA observation.
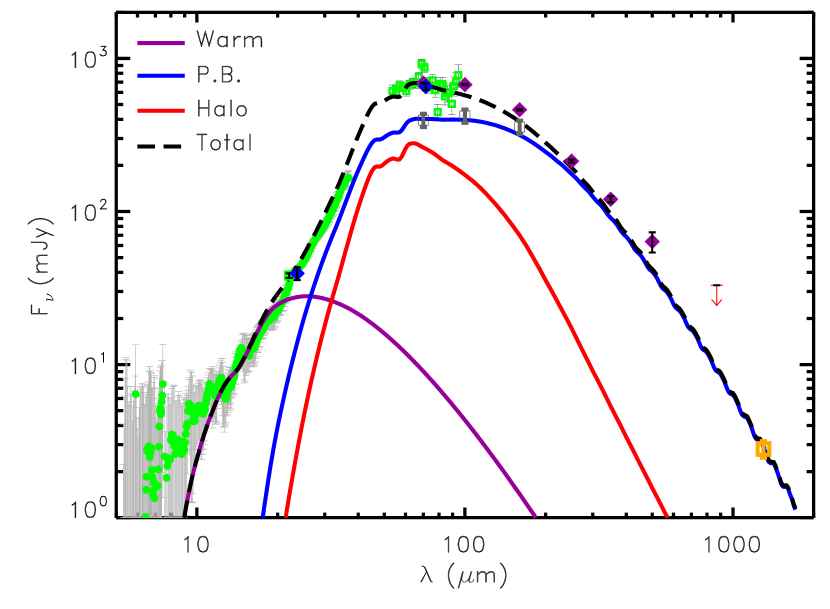
Since we now have the measured size for the cold disk (=106 au and =320 au compared to the old SED 63–189 au value), the 3-component SED model needs revision. Furthermore, a re-reduction of the archive APEX/LABOCA 870 data on HD 95086 using the techniques described in Phillips (2011) finds a total flux of 19.411.0 mJy, much lower than the one published by Nilsson et al. (2010). The peak emission in the 870 map is offset by 13″ (i.e., 2/3 of the beam diameter) from the expected star position; therefore, the quoted flux is estimated as an unresolved source at the position of the star. Due to the large offset, we consider it as a non-detection and use 33 mJy as the 3 upper limit. We adopted this value for further SED analysis. Using similar approaches and grain parameters as in Su et al. (2015) (minimum and maximum grain sizes of 1.8 and 1000 , and a particle size distribution in a power law index of 3.5), a geometrically thin, constant surface density disk with a radial span of 106-320 au provides a good fit to the ALMA 1.3 mm flux and maximum allowable fluxes in the far infrared (gray squares in Figure 5). This cold disk SED model also agrees with the observed 7 mm flux (not shown in Figure 5) obtained by Ricci et al. (2015b) within the uncertainty. Compared to the cold component model presented in Su et al. (2015), this revised planetesimal disk model contributes much more flux shortward of 60 , and is the dominant component (compared to the disk halo) at 20–30 . With a much larger cold planetesimal disk component, the inner radius of the disk halo is more distant from the star (from old 190 au to 300 au), and contributes much less flux at mid- and far-infrared wavelengths using the same grain parameters as in Su et al. (2015). Although we now have resolved the cold disk at millimeter wavelengths, revealing the placement of the large grain population, there are still a wide range of parameters that are not constrained in the SED models, especially for the grain parameters in the disk halo. The SED models shown in Figure 5 are not unique. Future resolved images of the various components at crucial mid-infrared wavelengths will shed light on this.
4.2. Ring Width and Azimuthal Asymmetry
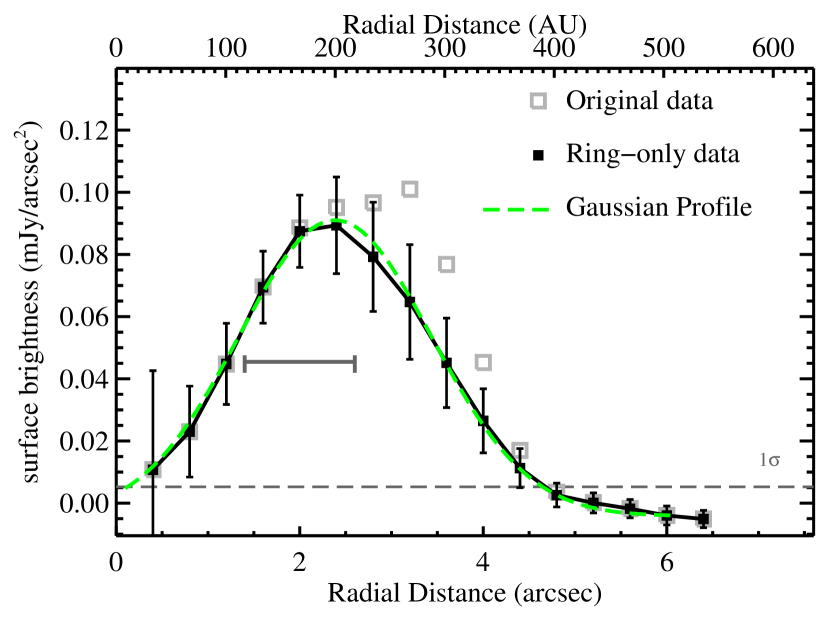
We computed the azimuthally averaged radial profile for the disk using the synthesized image data without the two point sources (the right panel of Figure 3). Assuming the disk is inclined by 30° with the major axis along P.A. of 97°, we first created a series of elliptical rings with a width of 2 pixels (04) centered at the star, and computed the average value of all pixels that fall in each ring. Since the pixels are highly correlated within the area of each synthesized beam, the noise in each ring can be approximated with the standard deviation in the ring divided by the number of beams in that ring. The background noise per ring is computed in a similar fashion. The total error in the average flux measurement per ring, therefore, is the nominal error and the background noise added in quadrature. The resultant disk surface brightness profile is shown in the top panel of Figure 6. For reference, the profile using the original data is also shown, and the contamination from the bright source obviously results in extra flux in the radii at 2″–4″ from the star. The point-source subtracted ring profile is centered at 23 from the star with symmetric profiles inside and outside the peak within uncertainties. The millimeter emission of the disk is surprisingly broad (0.84).
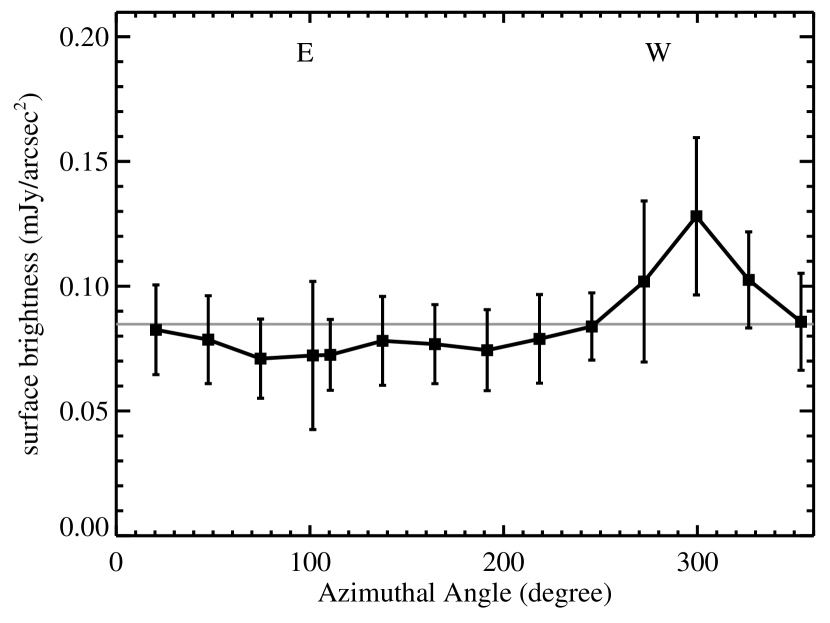
To assess the degree of the asymmetry in the millimeter disk emission, we also computed the radially averaged surface brightness profile along the disk circumference. To minimize the contamination of the bright source, we picked a radial span of 14–26 from the star, and computed the average disk brightness within an incremental angle of 27° azimuthally. Similarly, the uncertainty includes the standard deviation and background noise in each of the wedges. The azimuthal profile is shown in the bottom panel of Figure 6. The azimuthal profile agrees within 1 to the average disk surface brightness (horizontal grey line in Figure 6), except at P.A. of 300°, the direction toward the bright source (although the difference is still within 2 ). Given the contamination by the bright source, plus the modest resolution of the ring (6 beam widths in circumference and 2 beam widths in width), the apparent asymmetry is not significant.
4.3. Possible Nature of the Bright Source
As demonstrated in Section 3.4, the bright source near the edge of the disk, at 32 (a projected distance of 268 au) from the star, is slightly more extended than the synthesized beam, and roughly along the major axis of the disk (3° off). Although the disk emission can be traced up to 320 au from the star, the peak millimeter emission is within 200 au, i.e., this bright structure is quite far away from the main location of the colliding planetesimals. We explore various possibilities for the nature of the bright source either physically associated with the HD 95086 system or due to chance alignment of a background source.
4.3.1 Debris Phase of a Circumplanetary Disk?
It is challenging to form planets at large orbital distances through the usual route of km-sized planetesimal merger. However, there are multiple ways to bypass this hurdle like pebble accretion in conjunction with planet scattering (e.g., Lambrechts & Johansen 2012; Kenyon & Bromley 2015; Bromley & Kenyon 2016). Therefore, it may be possible to have a newly formed planet at 270 au from this 17 Myr old star. Given the fact that there is no sign of this bright source in the deep data (J. Rameau priv. comm.) and in the mid-infrared photometry of the system (Moór et al., 2013; Su et al., 2015), it is unlikely that the bright source is the direct detection of a newly formed planet222The typical temperature for a protoplanet is expected to be a few 100 to a few 1000 K (Zhu, 2015; Eisner, 2015).. Assuming the bright source is at the distance of 83.8 pc, the bulk of the 1.3 mm flux suggests a bolometric luminosity of 2 to 7 assuming it has a temperature of 30–100 K, which translates to a radius of 0.7–1.4 au for the optically thick emitting area. It is interesting to note that the Hill radius for a 10 planet at 270 au around 1.6 star is 5 au. Therefore, the mm flux of the bright source could come from the dust emission of a circumplanetary disk (CPD) whose typical size is expected to be one third of the Hill radius (Martin & Lubow, 2011; Zhu, 2015).
The CPD is expected to be gas-rich around a planet in formation, like a scaled-down version of a protoplanetary disk around a young star. With a total flux of 0.81 mJy at 1.3 mm, the estimated dust mass is 0.2–0.4 assuming a typical dust opacity, = 2.3 cm2g-1 (Beckwith et al., 1990) and dust temperatures of 30–60 K. We do not detect any CO gas emission from the bright source. The noise level in the integrated CO (2-1) line flux is 1.5 W m-2 assuming a velocity dispersion of 4.6 km s-1 (twice the Keplerian velocity at 270 au) (Booth et al. in prep.). The CO gas mass for the hypothesized CPD is less than 2.3 (1 , details see Booth et al. in prep.), suggesting an extremely low gas-to-dust mass ratio. If the dust emission did come from the CPD of a newly formed planet, the CPD might be in the “debris” phase as moons/satellites are being formed. However, the mass fraction between the hypothesized CPD and newly formed planet is uncomfortably high (10-2 for a Neptune-size planet) in comparison to the typical mass fraction of between the satellites and the giant planets in the solar system, making this “debris CPD” hypothesis unlikely.
4.3.2 A Dust Clump due to A Giant Impact?
Alternatively, a recent giant impact in the disk can create a bright, concentrated region in the disk (Telesco et al., 2005). Depending on the impact velocity, the disk morphology could remain in the clump-dominated phase that lasts for a few orbital periods after a giant impact (Jackson et al., 2014). Given the system’s young age, observing such a large impact at 270 au is not impossible. Next, we estimate whether the brightness/mass in the clump is consistent with such a scenario. Using the parameters derived in Section 3.4, the bright source contributes 25% of the total disk flux at 1.3 mm, which is significantly larger than the clump in the Pic disk ( 4% of the disk flux).
At 270 au, the orbital velocities are so low that most collisions between large objects would be mergers333The typical impact velocity is roughly the orbital velocity, which is 2.3 at 270 au around HD 95086. Given the escape velocity of 25 for a Neptune-like planet, a typical impact between two Neptune-like objects at 270 au belongs to the merging collision outcome based on the work by Leinhardt & Stewart (2012). and not produce much debris (with masses a few % of the impactors, Jackson et al. 2014). To produce the amount of dust observed in the bright source, objects with masses 10–20 (Neptune mass) are required. Impacts involving such large objects are likely to be very explosive, i.e., the resultant clump is expected to smear and spread very rapidly after the impact (a few orbital periods). The fact that the bright source is relatively compact (8% broader than the synthesized beam in the long baseline data) disfavors the origin of a giant impact.
4.3.3 A Dust Clump due to Planetesimals trapped by an Unseen Planet?
In addition, a concentrated dust clump can also be created by the intense collision among the planetesimals trapped in the resonance with an unseen planet (Wyatt, 2003), as one of the proposed origins for the dust clump in the Pic disk. The dust clump in the Pic disk is also found to be very bright in CO gas emission, probably released by the icy planetesimals (Matrà et al., 2017). Therefore, we might also expect to detect a significant amount of CO gas associated with the bright source in HD 95086 if all the planetary systems have a similar composition. The upper limit on the integrated CO (2-1) line flux is 100 times fainter than the integrated line flux of CO (2-1) line in the Pic disk after scaling by the distance difference, while the dust flux in the clump is much brighter in the HD 95086 disk. Given these comparisons, it seems unlikely the bright source has a similar nature as the clump in the Pic disk.
4.3.4 Alignment of a Background Galaxy
An alternative explanation is that the source is a background galaxy. In fact, Su et al. (2015) suspected that the integrated submillimeter flux of the system is likely contaminated by background galaxies due to the excess emission detected at Herschel/SPIRE bands and APEX 870 compared to the disk SED model. Using the parameters of the Schechter function in Carniani et al. (2015), the probability of a galaxy with an 1.3 mm flux of 0.81 mJy within 4″ of the star is 0.5%, but increases to 5% and 14% chance within the FWHM and 10% of the primary beam, respectively. For the fainter source, the probability of having a source with an 1.3 mm flux of 0.1 mJy within 4″ of the star is 11.4%. Assuming the two sources are physically not related, the chance of both within 4″ of the star is 0.06%. The contamination from multiple background point sources is also seen around Eri (Chavez-Dagostino et al., 2016). Therefore, it is possible that the sources in HD 95086 are related background galaxies, and the 0.06% probability is then a lower limit. These values are a statistical assessment given an ensemble of observations, and the application to one single observation is not one-to-one correspondence. Based on these probabilities, the faint source is very likely to be a background galaxy; the bright source could be a background galaxy, a rare case but not impossible.
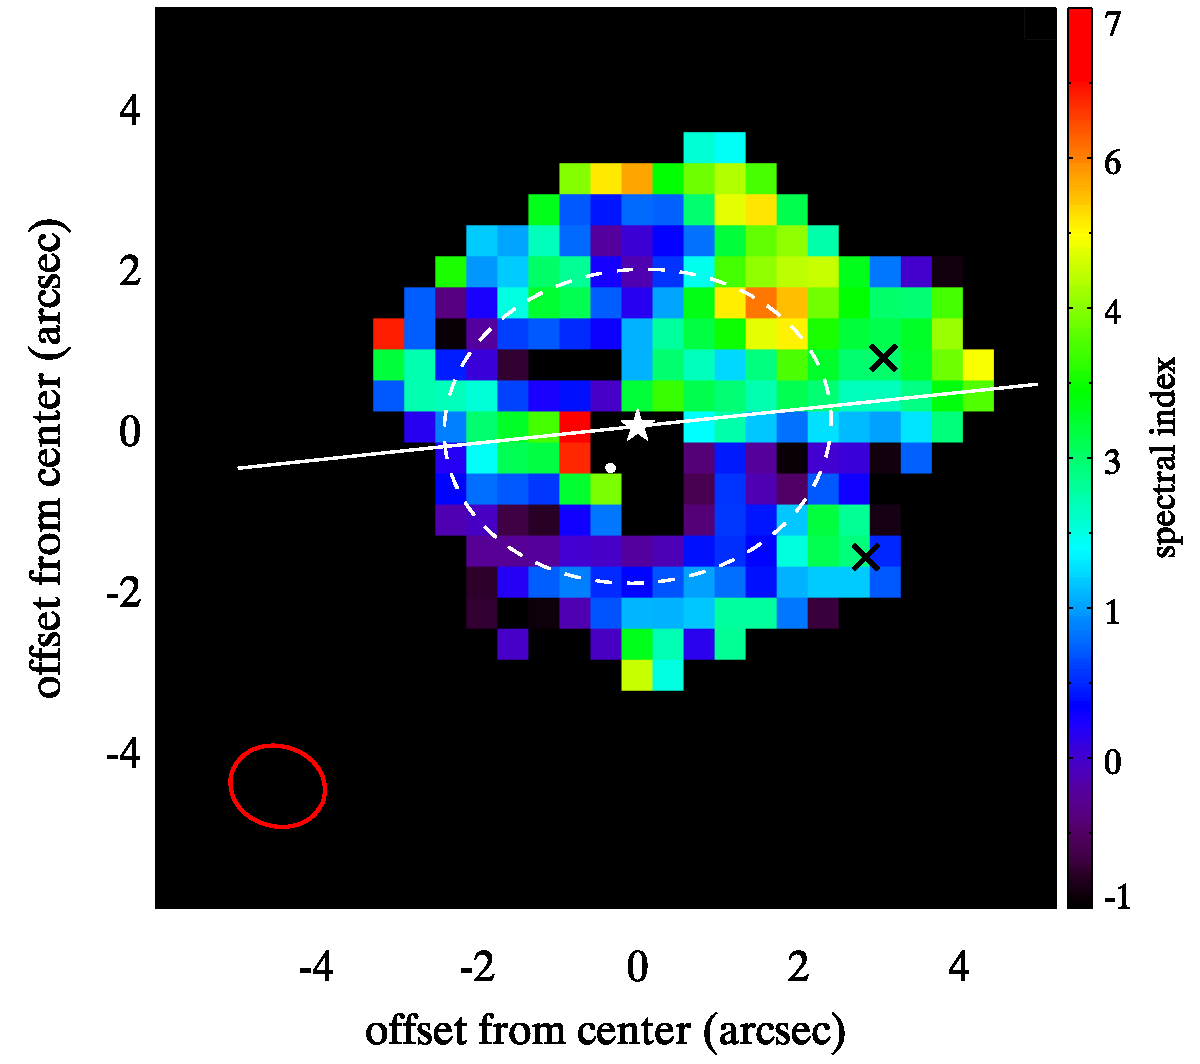
In general, a background galaxy might have a steep dust spectrum, like , and the debris disk is likely to be shallower, like (MacGregor et al., 2016; Holland et al., 2017). Therefore, a background galaxy is likely to be brighter in the data set B than in A due to the frequency difference if the absolute flux calibration in both data sets is consistent. As estimated in Section 4.1, the flux difference of the bright source between the two data sets is within the uncertainty of absolute flux calibration, i.e., not significant. Alternatively, we can compare the spectral indexes between the bright source and the disk. Spectral index maps were generated with the data sets combined and separately using all baselines and long baselines only. Figure 7 shows the spectral index map of the combined data set. The bright source has a spectral index of 3.04.0 derived from the combined data. Due to the signal-to-noise in the extended emission, the spectral index across the whole disk varies, however, the index of the disk is generally shallower than the one of the bright source.
A steeper spectral index does not necessarily mean the bright source is indeed a background galaxy because an impact produced clump may also have a steep particle size distribution, resulting in a high spectral index. Assuming this is indeed the case, the spectral slope suggests that the clump should have a total flux of a few hundred mJy at 200 m from extrapolating the measured flux of 0.81 mJy at 1.3 mm. The flux of such a clump at 70–100 m range would have been even brighter, i.e., comparable to the total disk flux in the far infrared. Given the measured disk SED (Figure 5), it would be very difficult to have such a component co-exist with other components (planetesimal disk and disk halo), corroborating our early assessment.
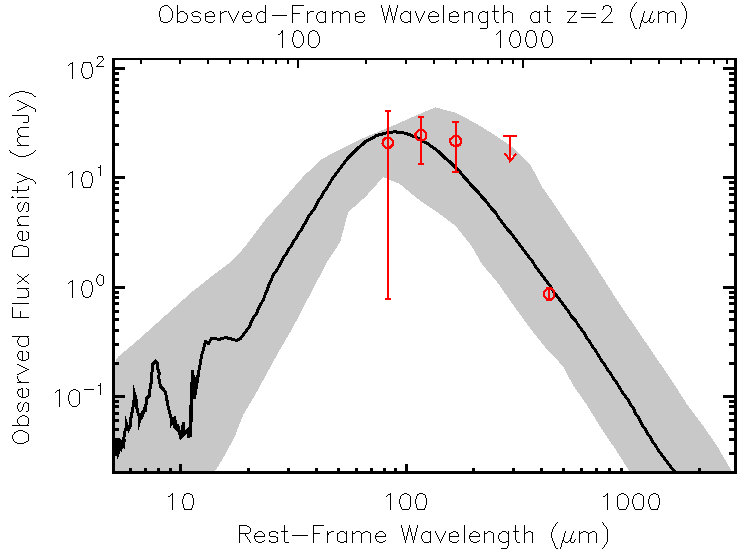
As a sanity check, we can also construct the SED of the bright source using the measured 1.3 mm flux and the revised 3-component disk SED presented in Section 4.2. By comparing the photometric measurements and the model disk SED, the “excess” emission, presumably from the bright source, is 31.418.9 mJy, 30.910.6 mJy, 24.810.4 and 10.111.0 mJy at 250, 350, 500 and 870 , respectively (the quoted errors include 10% uncertainty from the SED model). With the 1.3 mm flux measured by ALMA, the SED of the bright source is shown in Figure 8, and the SED is consistent with the one of a dusty star forming galaxy at =2 (Casey et al., 2014). The angular size of the bright source (Section 3.4) is in the range of angular sizes for luminous infrared and submillimeter galaxies at 2 measured in the radio (Gurvits et al., 1999; Rujopakarn et al., 2016). It seems very plausible that this bright source is due to the chance alignment of a background galaxy.
4.4. Constraints for the HD 95086 b from the Disk Perspective
HD 95086 b was discovered by Rameau et al. (2013) at an angular separation of 060–063 from the star (Rameau et al., 2016). At a distance of 83.8 pc, this translates to a projected distance of 50.3–52.3 au. Assuming the planet b and the disk are co-planar, the inclination of the disk (30°3°) implies that planet b has a stellocentric distance of 56–63 au (semimajor distance if the planet b is on a circular orbit). The bright source makes it difficult to assess the asymmetry in the disk, and no “significant” asymmetry is present in the millimeter disk emission. Alternatively, we can also put some constraint on the eccentricity of the shepherding planet orbit, presumably the planet b, by determining the offset of the ring and the star (i.e., the offset is where is the semi-major distance and is the eccentricity). As discussed earlier, we did not detect a significant offset between the ring center and the star. The expected pointing accuracy, resolution/signal-to-noise, is 013 since the main ring is detected at S/N10. The non-detection of an offset suggests for the shepherding planet (presumably planet b) with a semi-major distance of 63 au.
The most recent orbital parameters for HD 95086 b are from Rameau et al. (2016) where a small angular movement is detected using the data obtained by Gemini/GPI between 2013 and 2016: a semi-major distnce of 61.7 au, an inclination of 27° and an eccentricity less than 0.2. With the revised distance of 83.8 pc to HD 95086, we revise the semi-major distance of HD 95086 b to 57.2 au. These orbital parameters are all consistent with the ones derived from the disk geometry (assumed co-planar). The mass of the planet is estimated to be 4.40.8 (De Rosa et al., 2016). The 5- detection limits from VLT/NaCo and Gemini/GPI observations suggest that our current high contrast capability is not sensitive to planet masses less than 1.5 in the 60–800 au region from the star (Rameau et al., 2016).
Assuming the mass of the star is 1.60.16 , the mass ratio between the planet b and the star, , is 1.95–3.45. For this mass ratio, the timescale to clear the planet’s chaotic zone is Myr (Morrison & Malhotra, 2015), much shorter than the estimated 17 Myr age of the system. We adopt the numerically derived formula from Morrison & Malhotra (2015) to compute the size of the planet’s chaotic zone. Assuming the planet b is at a circular orbit with a semi-major axis of , the interior chaotic zone width is and the exterior chaotic zone width is . With the range of and (56–63 au), the width of the exterior chaotic zone is 14–19 au, suggesting the outer boundary of the chaotic zone from the planet b is 70–82 au. If the inner edge of the disk is at 106 au as derived from the two boundary model in Section 3.4, an eccentricity of 0.29 is needed to extend its chaotic zone to the inner edge of the disk if planet b is the shepherding planet and coplanar with the disk. This eccentricity is marginally consistent (2) with no significant offset detected between the ring center and the star. If we relax the assumption that the disk and the planet are co-planar, HD 95086 b’s chaotic zone can reach 98 au assuming a semi-major distance of 76 au (the maximum allowable range from high contrast imaging, Rameau et al. 2016). A small eccentricity (0.08) can extend the planet’s influence to 106 au (the inner boundary of the disk). Therefore, the planet b can be the shepherding planet to maintain the inner edge of the Kuiper-belt analog. In summary, the values listed above are all within the allowable ranges for the system.
If the system hosts an additional planet outside the orbit of HD 95086 b that is shepherding the inner edge of the cold disk, it would have to be less than 1.5 to have eluded detection (Rameau et al., 2016). From the dynamical stability criteria of Gladman (1993) and Morrison & Kratter (2016), the estimated separation between planet b and the disk is sufficient for another planet below this mass threshold to reside there while remaining long-term dynamically stable with respect to planet b if both possess low orbital eccentricities. However, the youth of this system (17 Myr) and long dynamical timescales at these large orbital distances place a lower limit on planets that could have cleared debris from their chaotic zones over the system’s lifetime. From the clearing timescales estimated in Morrison & Malhotra (2015), a putative low eccentricity, coplanar outer planet orbiting in the region beyond planet b’s orbit and interior to the cold disk, would have to be 0.2 (4 Neptune masses) to have cleared debris from that region over the system’s lifetime. In summary, the shepherding planet between the planet b and the inner edge of the cold disk would have a mass of 0.2–1.5 with the assumption of coplanarity and low eccentricity.
5. Conclusion
We obtained an ALMA 1.3 mm image of HD 95086, a young (17 Myr) star hosting a directly imaged planet and a debris disk composed of dust generated in massive asteroid- and Kuiper-belt analogs. The high angular resolution (a beam of 11) and sensitivity (rms of 7.5 Jy beam-1) provided by ALMA enable us to resolve the Kuiper-belt analog for the first time. The sensitive ALMA millimeter image reveals an inclined ring centered at the star and a bright source near the edge of the ring along the major axis of the ring. Our observations also covered the the 12CO J=2-1 transition at 230.538 GHz, and no CO emission above 3 per beam was found in the pipeline produced CO channel maps in the region of the ring and the bright source.
To access the properties of the bright source, we also generated the continuum map using data with baselines longer than 60–80 where an extended structure like the planetesimal disk is filtered out. The long baseline data reveal two sources within 35 of the star (a much fainter source south of the bright one). The FWHM of the sources is consistent with being a point source although the bright one is slightly broader (8%) than the synthesized beam. We determined the best fit parameters (total fluxes and positions) of the two sources in the long baseline data using point source fitting in the visibility domain. The faint source has a 1.3 mm flux of 0.1 mJy (S/N 9 in the long baseline map), and is most likely a background galaxy, similar to other faint sources in the long baseline map. The bright source is detected at high S/N with a total 1.3 mm flux of 0.81 mJy and located –308 E and 083 N of the star. We explored the possible nature of the bright source including (1) a debris phase of the circumplanetary disk, (2) a dust clump produced by a giant impact, (3) a dust concentration due to planetesimals trapped by an unseen planet, and (4) a background dusty galaxy. The source’s brightness in dust continuum and non-detection of the CO emission suggest that it is unlikely to have resulted from a structure physically assocated with the system (the first three scenarios), and more likely due to chance alignment of a background source. We further constructed the SED of the bright source using the 1.3 mm flux and the “excess” emission by comparing the unresolved photometry and the expected disk emission, and found it is consistent with the expected SED from a =2 dusty galaxy. The slight extension of the bright source and the steeper spectral index compared to the spectral index of the disk are both consistent with the bright source being a luminous, high redshift galaxy.
We used the MCMC approach to determine the best fit parameters of the disk. We assumed the Kuiper-belt analog can be described by simple, parametric models. We explored two axi-symmetric, geometric thin models for the disk surface density profiles: (1) a two-boundary, power-law disk with sharp inner and outer boundaries, and (2) a Gaussian ring. We further assumed that the millimeter emission comes from large grains whose temperatures follow a power law. The best-fit parameters and associated uncertainties are derived by fitting the visibilities and image plane data. We found that fittings in the visibilities and image plane domain give consistent results within 1 uncertainties in terms of the geometric parameters (disk extent, position and inclination angles and the offset of the bright source); however, the derived fluxes are consistently larger when using the fits in the image plane. Although within the uncertainties, the flux of the bright source is also brighter than the one derived from the long baseline data, implying a difficulty of separating the disk from the bright source. We then synthesized the disk parameters by (1) fixing the point source parameters in the visibilities fit, (2) masking out the pixels affected by the bright source in the imaging fit, and (3) fitting the bright source as a Gaussian profile. The final parameters for the Kuiper-belt analog are all very similar. The major axis of the disk is along P.A. of 97°3° with the mid-plane inclined by 30°3° from face-on. The width of the disk is very broad and resolved by 2 beam widths. The disk density profile is consistent with either (1) a broad, Gaussian ring peaked at 2006 au with a FWHM width of 1687 au or (2) an power-law profile with an inner radius of 1065 au and outer radius of 32010 au. Although the residual maps (data – model) are very similar between the two models, the Gaussian ring model gives a slightly better reduced . In all residual maps, the east side of the disk has more negative residuals compared to the opposite side, suggesting an apparent disk asymmetry. However, the residual in the west side of the disk is also contaminated by the imperfect subtraction of the bright source. Judging from the azimuthal profile along the disk circumference, the apparent asymmetry is not significant.
We also explored whether allowing an offset between the ring and the star would produce a better residual map. Although a small offset (within 015, one eighth of the synthesized beam) is preferred in statistics, it produces no significant difference in the residual map. Based on the estimated pointing accuracy of 013, the non-detection of an offset suggests that the orbit of the shepherding planet has an eccentricity 0.17 if it has a semi-major axis of 63 au. Given the observed projected separation between HD 95086 b and the star, the semi-major axis of the planet b orbit is 56–63 au if the planet and the disk share the same orbital plane and the planet is on a circular orbit. The estimated major axis is consistent with the apparent motion of the planet detected within three years. However, in the co-planar case for a planet in a circular orbit, the expected chaotic zone of the planet b (maximum of 82 au), does not reach the inner boundary of the disk (106 au). If the planet b is the shepherding planet to maintain the inner edge of the cold disk, an eccentricity 0.29 is needed to extend its influence. Such a planet would create an offset of 02 between the star and the ring center, marginally consistent with the observed data. It is also possible that the planet b is not the shepherding planet for the cold disk given the large separation between its chaotic zone and the inner disk edge. An additional unseen low-mass planet (0.2–1.5 ) on a circular orbit can also occupy the dust-free zone between the planet b and the cold disk and have eluded detection. Alternatively, relaxing the co-planarity assumption, a larger semimajor axis of planet b (76.4 au, still within the allowable range) and a small eccentricity (0.08) would extend its chaotic zone to 106 au.
References
- Aumann et al. (1984) Aumann, H. H., Beichman, C. A., Gillett, F. C., et al. 1984, ApJ, 278, L23
- Beckwith et al. (1990) Beckwith, S. V. W., Sargent, A. I., Chini, R. S., & Guesten, R. 1990, AJ, 99, 924
- Bailey et al. (2014) Bailey, V., Meshkat, T., Reiter, M., et al. 2014, ApJ, 780, L4
- Ballering et al. (2013) Ballering, N. P., Rieke, G. H., Su, K. Y. L., & Montiel, E. 2013, ApJ, 775, 55
- Boley et al. (2012) Boley, A. C., Payne, M. J., Corder, S., et al. 2012, ApJ, 750, LL21
- Booth et al. (2016) Booth, M., Jordán, A., Casassus, S., et al. 2016, MNRAS, 460, L10
- Booth et al. (2017) Booth, M., Dent, W. R. F., Jordán, A., et al. 2017, MNRAS, 469, 3200
- Bromley & Kenyon (2016) Bromley, B. C., & Kenyon, S. J. 2016, ApJ, 826, 64
- Gaia Collaboration et al. (2016) Gaia Collaboration, Prusti, T., de Bruijne, J. H. J., et al. 2016, A&A, 595, A1
- Carniani et al. (2015) Carniani, S., Maiolino, R., De Zotti, G., et al. 2015, A&A, 584, A78
- Casey et al. (2014) Casey, C. M., Narayanan, D., & Cooray, A. 2014, Phys. Rep., 541, 45
- Chavez-Dagostino et al. (2016) Chavez-Dagostino, M., Bertone, E., Cruz-Saenz de Miera, F., et al. 2016, MNRAS, 462, 2285
- Chen et al. (2012) Chen, C. H., Pecaut, M., Mamajek, E. E., Su, K. Y. L., & Bitner, M. 2012, ApJ, 756, 133
- Dent et al. (2014) Dent, W. R. F., Wyatt, M. C., Roberge, A., et al. 2014, Science, 343, 1490
- De Rosa et al. (2016) De Rosa, R. J., Rameau, J., Patience, J., et al. 2016, ApJ, 824, 121
- Eisner (2015) Eisner, J. A. 2015, ApJ, 803, L4
- Ertel et al. (2012) Ertel, S., Wolf, S., & Rodmann, J. 2012, A&A, 544, A61
- Gladman (1993) Gladman, B. 1993, Icarus, 106, 247
- Gurvits et al. (1999) Gurvits, L. I., Kellermann, K. I., & Frey, S. 1999, A&A, 342, 378
- Holland et al. (2017) Holland, W. S., Matthews, B. C., Kennedy, G. M., et al. 2017, arXiv:1706.01218
- Jackson et al. (2014) Jackson, A. P., Wyatt, M. C., Bonsor, A., & Veras, D. 2014, MNRAS, 440, 3757
- Jewitt & Luu (1993) Jewitt, D., & Luu, J. 1993, Nature, 362, 730
- Kalas et al. (2008) Kalas, P., Graham, J. R., Chiang, E., et al. 2008, Science, 322, 1345
- Kenyon & Bromley (2015) Kenyon, S. J., & Bromley, B. C. 2015, ApJ, 806, 42
- Lagrange et al. (2009) Lagrange, A.-M., Gratadour, D., Chauvin, G., et al. 2009, A&A, 493, L21
- Lambrechts & Johansen (2012) Lambrechts, M., & Johansen, A. 2012, A&A, 544, A32
- Leinhardt & Stewart (2012) Leinhardt, Z. M., & Stewart, S. T. 2012, ApJ, 745, 79
- Löhne et al. (2017) Löhne, T., Krivov, A. V., Kirchschlager, F., Sende, J. A., & Wolf, S. 2017, arXiv:1704.08085
- Rameau et al. (2016) Rameau, J., Nielsen, E. L., De Rosa, R. J., et al. 2016, ApJ, 822, L29
- MacGregor et al. (2013) MacGregor, M. A., Wilner, D. J., Rosenfeld, K. A., et al. 2013, ApJ, 762, L21
- MacGregor et al. (2016) MacGregor, M. A., Wilner, D. J., Chandler, C., et al. 2016, ApJ, 823, 79
- MacGregor et al. (2016) MacGregor, M. A., Lawler, S. M., Wilner, D. J., et al. 2016, ApJ, 828, 113
- MacGregor et al. (2017) MacGregor, M. A., Matrà, L., Kalas, P., et al. 2017, ApJ, 842, 8
- Macintosh et al. (2015) Macintosh, B., Graham, J. R., Barman, T., et al. 2015, Science, 350, 64
- Marino et al. (2017) Marino, S., Wyatt, M. C., Kennedy, G. M., et al. 2017, MNRAS, 469, 3518
- Marois et al. (2008) Marois, C., Macintosh, B., Barman, T., et al. 2008, Science, 322, 1348
- Marois et al. (2010) Marois, C., Zuckerman, B., Konopacky, Q. M., Macintosh, B., & Barman, T. 2010, Nature, 468, 1080
- Martin & Lubow (2011) Martin, R. G., & Lubow, S. H. 2011, MNRAS, 413, 1447
- Matthews et al. (2014) Matthews, B. C., Krivov, A. V., Wyatt, M. C., Bryden, G., & Eiroa, C. 2014, Protostars and Planets VI, 521
- Matrà et al. (2017) Matrà, L., Dent, W. R. F., Wyatt, M. C., et al. 2017, MNRAS, 464, 1415
- Meshkat et al. (2013) Meshkat, T., Bailey, V., Rameau, J., et al. 2013, ApJ, 775, L40
- Moór et al. (2013) Moór, A., Ábrahám, P., Kóspál, Á., et al. 2013, ApJ, 775, L51
- Morrison & Malhotra (2015) Morrison, S., & Malhotra, R. 2015, ApJ, 799, 41
- Morrison & Kratter (2016) Morrison, S. J., & Kratter, K. M. 2016, ApJ, 823, 118
- Nilsson et al. (2010) Nilsson, R., Liseau, R., Brandeker, A., et al. 2010, A&A, 518, A40
- Pan et al. (2016) Pan, M., Nesvold, E. R., & Kuchner, M. J. 2016, ApJ, 832, 81
- Phillips (2011) Phillips, N. M. 2011, Ph.D. Thesis,
- Pope et al. (2008) Pope, A., Chary, R.-R., Alexander, D. M., et al. 2008, ApJ, 675, 1171-1193
- Ricci et al. (2015a) Ricci, L., Carpenter, J. M., Fu, B., et al. 2015a, ApJ, 798, 124
- Ricci et al. (2015b) Ricci, L., Maddison, S. T., Wilner, D., et al. 2015b, ApJ, 813, 138
- Rameau et al. (2013) Rameau, J., Chauvin, G., Lagrange, A.-M., et al. 2013a, ApJ, 772, L15
- Rujopakarn et al. (2016) Rujopakarn, W., Dunlop, J. S., Rieke, G. H., et al. 2016, ApJ, 833, 12
- Sault et al. (1995) Sault, R. J., Teuben, P. J., & Wright, M. C. H. 1995, Astronomical Data Analysis Software and Systems IV, 77, 433
- Su et al. (2009) Su, K. Y. L., Rieke, G. H., Stapelfeldt, K. R., et al. 2009, ApJ, 705, 314
- Su et al. (2013) Su, K. Y. L., Rieke, G. H., Malhotra, R., et al. 2013, ApJ, 763, 118
- Su & Rieke (2014) Su, K. Y. L., & Rieke, G. H. 2014, IAU Symposium, 299, 318
- Su et al. (2015) Su, K. Y. L., Morrison, S., Malhotra, R., et al. 2015, ApJ, 799, 146
- Telesco et al. (2005) Telesco, C. M., Fisher, R. S., Wyatt, M. C., et al. 2005, Nature, 433, 133
- Wyatt (2003) Wyatt, M. C. 2003, ApJ, 598, 1321
- Zhu (2015) Zhu, Z. 2015, ApJ, 799, 16