otherfnsymbols††§§** ‡‡‖∥¶¶•∘
Frustrated spin order and stripe fluctuations in FeSe
Abstract
The charge and spin dynamics of the structurally simplest iron-based superconductor, FeSe, may hold the key to understanding the physics of high temperature superconductors in general. Unlike the iron pnictides, FeSe lacks long range magnetic order in spite of a similar structural transition around 90 K. Here, we report results of Raman scattering experiments as a function of temperature and polarization and simulations based on exact diagonalization of a frustrated spin model. Both experiment and theory find a persistent low energy peak close to 500 cm-1 in symmetry, which softens slightly around 100 K, that we assign to spin excitations. By comparing with results from neutron scattering, this study provides evidence for nearly frustrated stripe order in FeSe.
pacs:
74.70.Xa, 75.10.Jm, 74.20.Mn, 74.25.ndIntroduction
Fe-based pnictides and chalcogenides, similar to cuprates, manganites or some heavy fermion compounds, are characterized by the proximity and competition of various phases including magnetism, charge order and superconductivity. Specifically the magnetism of Fe-based systems has various puzzling aspects which do not straightforwardly follow from the Fe valence or changes in the Fermi surface topology Yin et al. (2011); Georges et al. (2013); Si et al. (2016); Skornyakov et al. (2017). Some systems have a nearly ordered localized moment close to Li et al. (2009), such as FeTe or rare-earth iron selenides, whereas the moments of Fe2As2-based compounds ( Ba, Sr, Eu or Ca) are slightly below Johnston (2010) and display aspects of itinerant spin-density-wave (SDW) magnetism with a gap in the electronic excitation spectrum Yi et al. (2017). In contrast others do not order down to the lowest temperatures, such as FeSe Baek et al. (2014) or LaFePO Taylor et al. (2013).
The material specific differences are a matter of intense discussion, and low- as well as high-energy electronic and structural properties determine the properties Mazin and Johannes (2009); Yin et al. (2011); Georges et al. (2013); Stadler et al. (2015); Glasbrenner et al. (2015); Skornyakov et al. (2017); Baum et al. (2018). At the Fermi energy , the main fraction of the electronic density of states originates from Fe orbitals, but a substantial part of the Fe-Fe hopping occurs via the pnictogen or chalcogen atoms, hence via the , , and orbitals. For geometrical reasons, the resulting exchange coupling energies between nearest () and next nearest neighbour () iron atoms have the same order of magnitude, and small changes in the pnictogen (chalcogen) height above the Fe plane influence the ratio , such that various orders are energetically very close Glasbrenner et al. (2015).
The reduced overlap of the in-plane orbitals decreases the hopping integral and increases the influence of the Hund’s rule interactions and the correlation energy , even though they are only in the range of 1-2 eV. Thus the electrons in the orbitals have a considerably higher effective mass and smaller quasiparticle weight than those of the and orbitals. This effect was coined orbital selective Mottness Anisimov, V. I. et al. (2002); de’ Medici et al. (2009); de’ Medici (2017) and observed by photoemission spectroscopy (ARPES) in Fe-based chalcogenides Yi et al. (2015). It is similar in spirit to what was found by Raman scattering in the cuprates as a function of momentum Venturini et al. (2002). In either case some of the electron wave functions are more localized than others. This paradigm may explain why the description remains difficult and controversial in all cases.
Therefore we address the question as to whether systematic trends can be found across the families of the Fe-based superconductors, how the spin excitations are related to other highly correlated systems, and how they can be described appropriately.
As an experimental tool we use Raman scattering since the differences expected theoretically Yin et al. (2011); Si et al. (2016) and indicated experimentally in the electronic structure Yi et al. (2017) can be tracked in both the charge and the spin channel. Another advantage is the large energy range of approximately 1 meV to 1 eV (8 to 8,000 ) accessible by light scattering Devereaux and Hackl (2007).
Early theoretical work on Fe-based systems considered the Heisenberg model the most appropriate approach Chen et al. (2011), and the high-energy maxima observed by Raman scattering in BaFe2As2 were interpreted in terms of localized spins Okazaki et al. (2011); Sugai et al. (2012). On the other hand, the low-energy spectra are reminiscent of charge density wave (CDW) or SDW formation Chauvière et al. (2011); Sugai et al. (2012); Eiter et al. (2013); Yang et al. (2014). In principle, both effects can coexist if the strength of the correlations varies for electrons from different orbitals, where itinerant electrons form a SDW, while those on localized orbitals give rise to a Heisenberg-like response.
In contrast to the Fe2As2-based compounds ( Ba, Sr, Ca), FeSe seems to be closer to localized order with a larger mass renormalization than in the iron pnictides Yin et al. (2011). Apart from low lying charge excitations, the remaining, presumably spin, degrees of freedom in FeSe may be adequately described by a spin-1 --- Heisenberg model Glasbrenner et al. (2015) which provides also a consistent description of our results shown in this work and allows for the presence of different spin orders. Since various types of spin order are energetically in close proximity Glasbrenner et al. (2015); Wang et al. (2015, 2016), frustration may quench long-range order down to the lowest temperatures Baek et al. (2014), even though neutron scattering experiments in FeSe find large values for the exchange energies Rahn et al. (2015); Wang et al. (2016).
Recent experiments on FeSe focused on low-energies and () symmetry, and the response was associated with particle-hole excitations and critical fluctuations Massat et al. (2016). Here, we obtain similar experimental results below 1,500 . Those in the range 50-200 show similarities with the other Fe-based systems while those above 200 are distinctly different but display similarities with the cuprates Sulewski et al. (1991); Muschler et al. (2010). In addition to previous work, we analyze all symmetries at higher energies up to 3,500 , to uncover crucial information about the behaviour of the spin degrees of freedom.
By comparing experimental and simulated Raman data we find a persistent low energy peak at roughly 500 in symmetry, which softens slightly around 100 K. We assign the maximum and the related structures in and symmetry to spin excitations. The theoretical simulations also aim at establishing a link between light and neutron scattering data with respect to the spin degrees of freedom and to furnish evidence for nearly frustrated stripe order at low temperature. We arrive at the conclusion that frustrated order of localized spins dominates the physics in FeSe, while critical spin and/or charge fluctuations are not the main focus of the paper.
Results
Experiments
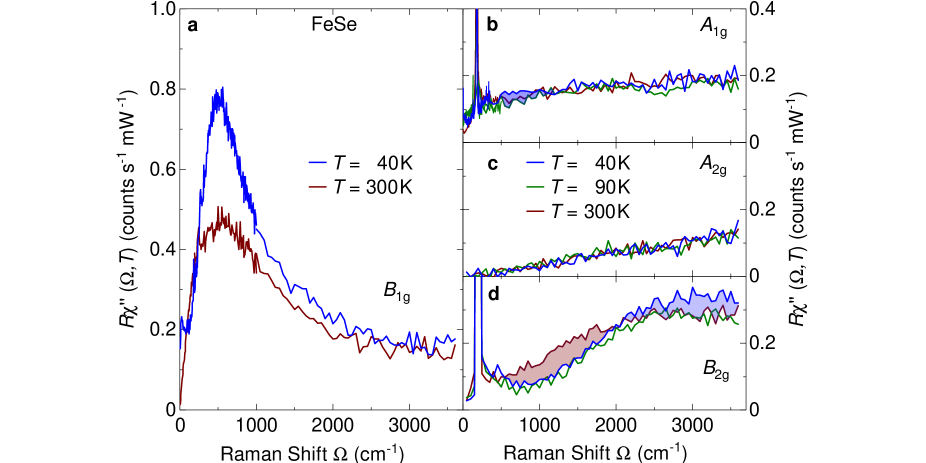
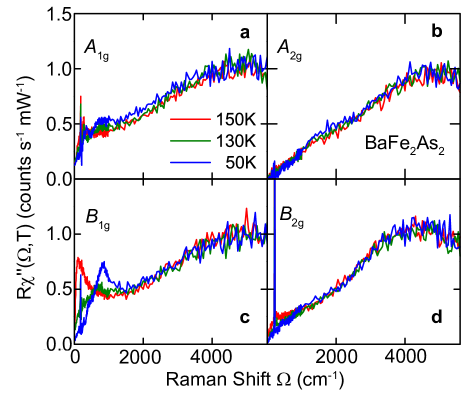
Symmetry-resolved Raman spectra of single-crystalline FeSe (see Methods) in the energy range up to 0.45 eV (3,600 cm-1) are shown in Fig. 1. The spectra are linear combinations of the polarization dependent raw data (see Methods and Supplementary Fig. 1 in Supplementary Note 1). For symmetry (Fig. 1a) we plot only two temperatures, 40 and 300 K, to highlight the persistence of the peak at approximately 500 cm-1. The full temperature dependence will be shown below. For , , and symmetry we show spectra at 40, 90 and 300 K (Fig. 1b-d). Out of the four symmetries, the , , and spectra display Raman active phonons, magnons or electron-hole excitations, while the spectra are weak and vanish below 500-1,000 cm-1. As intensity in symmetry appears only under certain conditions not satisfied in the present study, we ignore it here.
In the high-energy limit the intensities are smaller in all symmetries than those in other Fe-based systems such as BaFe2As2 (see Supplementary Fig. 2 in Supplementary Note 2). However, in the energy range up to approximately 3,000 cm-1 there is a huge additional contribution to the cross section in FeSe (Fig. 1a). The response is strongly temperature dependent and peaks at 530 cm-1 in the low-temperature limit. Between 90 and 40 K the and spectra increase slightly in the range around 700 and 3,000 cm-1, respectively (indicated as blue shaded areas in Fig. 1b and d). The overall intensity gain in the and spectra in the shaded range is a fraction of approximately 5% of that in symmetry. The spectra exhibit a reduction in spectral weight in the range from 600 to 1,900 (shaded red) which is already fully developed at the structural transition at in agreement with earlier work Massat et al. (2016). In contrast to and symmetry, the temperature dependence of the intensity is strong, whereas the peak energy changes only weakly, displaying some similarity with the cuprates Knoll et al. (1990). This similarity, along with the considerations of Glasbrenner et al. Glasbrenner et al. (2015), motivated us to explore a spin-only, Heisenberg-like model for describing the temperature evolution of the Raman scattering data.
Simulations at zero temperature
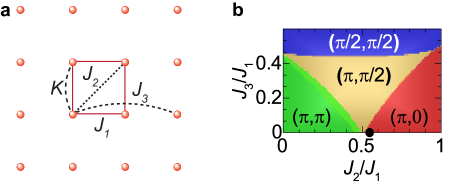
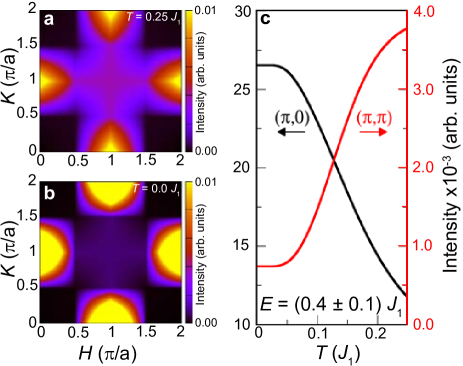
We performed numerical simulations at zero temperature for a frustrated spin-1 system on the basis of a --- Heisenberg model Glasbrenner et al. (2015) on a 16-points cluster as shown in Fig. 2a and described in the Methods section. Fig. 2b shows the resulting phase diagram as a function of and . was set at 0.1 (repulsive) in order to suppress ordering tendencies on the small cluster. The parameter set for the simulations of the Raman and neutron data at finite temperature is indicated as a black dot.
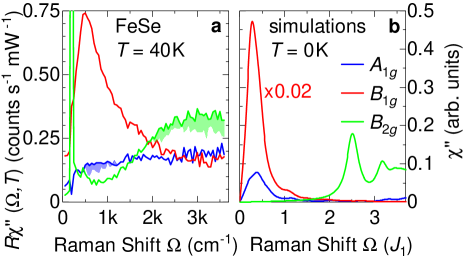
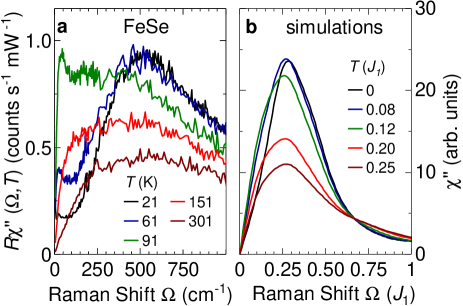
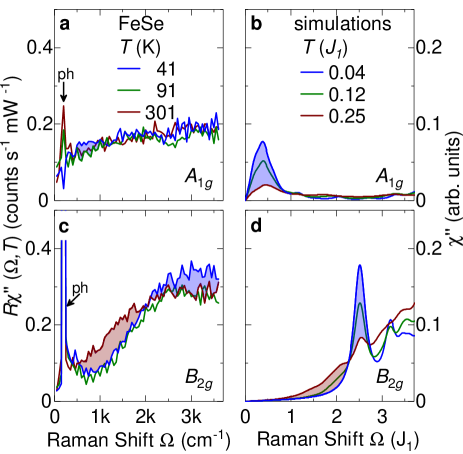
In Fig. 3 we show the low-temperature data (Fig. 3a) along with the simulations (Fig. 3b). The energy scale for the simulations is given in units of which has been derived to be 123 meV or 990 cm-1 Glasbrenner et al. (2015), allowing a semi-quantitative comparison with the experiment. As already mentioned, the experimental and spectra are not dominated by spin excitations and we do not attempt to further analyze the continua extending to energies in excess of 1 eV, considering them a background. The opposite is true for symmetry, also borne out in the simulations. For the selected values of meV, , , and , the positions of the spin excitations in the three symmetries and the relative intensities are qualitatively reproduced. The choice of parameters is motivated by the previous use of the - Heisenberg model, with to describe the stripe phase of iron pnictides Chen et al. (2011). Here we use a value of smaller than to enhance competition between Néel and stripe orders when describing FeSe. This approach and choice of parameters is strongly supported in a recent neutron scattering study Wang et al. (2016).
The comparison of the different scattering symmetries, the temperature dependence, and our simulations indicate that the excitation at 500 cm-1 is an additional scattering channel superimposed on the particle-hole continuum and fluctuation response, as shown in Supplementary Note 3 with Supplementary Figures 3 and 4. Here we focus on the peak centered at approximately 500 cm-1 which, in agreement with the simulations, originates from two-magnon excitations in a highly frustrated spin system, although the features below 500 cm-1 also are interesting and were interpreted in terms of quadrupolar orbital fluctuations Massat et al. (2016).
Temperature dependence
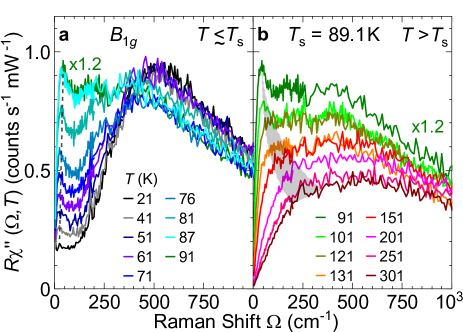
It is enlightening to look at the spectra across the whole temperature range as plotted in Fig. 4. The well-defined two-magnon peak centered at approximately 500 cm-1 in the low temperature limit loses intensity, and becomes less well defined with increasing temperature up to the structural transition . Above the structural transition, the spectral weight continues to decrease and the width of the two-magnon feature grows, while the peak again becomes well-defined and the energy hardens slightly approaching the high temperature limit of the study. What may appear as a gap opening at low temperature is presumably just the reduction of spectral weight in a low-energy feature at approximately 22 cm-1. The intensity of this lower energy response increases with temperature, leading to a well-formed peak at an energy around 50 cm-1 near the structural transition. Above the structural transition this feature rapidly loses spectral weight, hardens, and becomes indistinguishable from the two-magnon response in the high temperature limit. This low-energy feature develops in a fashion very similar to that found in Ba(Fe1-xCox)2As2 for Choi et al. (2008); Gallais et al. (2013); Kretzschmar et al. (2016).
Now we compare the measurements with numerical simulations for the temperature dependence of the Raman susceptibility in Fig. 5a and b, respectively. For the simulations (Fig. 5b) we use the same parameters as at (black dot in Fig. 3). At zero temperature the simulations show a single low energy peak around 0.3 . As temperature increases, a weak shoulder forms on the low energy side of the peak, and the whole peak softens slightly and broadens over the simulated temperature range. Except for the additional intensity at low energies, , (Fig. 5a) there is good qualitative agreement between theory and experiment. As shown in Supplementary Fig. 5 in Supplementary Note 4, a similar agreement between experiment and simulations is obtained for the temperature dependence in and symmetries, indicating that both the gain in intensity (blue shaded areas in Fig. 1) as well as the reduction in spectral weight in from 600 to 1,900 (shaded red in Fig. 1d) can be attributed to the frustrated localized magnetism.
Connection to the spin structure factor
To support our explanation of the Raman data, we simulated the dynamical spin structure factor and compared the findings to results of neutron scattering experiments Wang et al. (2016). While clearly not observing long-range order, above the structural transition neutron scattering finds similar intensity at finite energy for several wave vectors along the line . Upon cooling, the spectral weight at these wave vectors shifts away from to directions along , although the respective peaks remain relatively broad. In Fig. 6a and b we show the results of the simulations for two characteristic temperatures. As temperature decreases, spectral weight shifts from towards in agreement with the experiment Wang et al. (2016). In Fig. 6c we show the evolution of the spectral weights around and in an energy window of as a function of temperature, similar to the results shown in Ref. Wang et al., 2016. In the experiment, the temperature where the integrated dynamical spin structure factor changes most dramatically is close to the structural transition. From our simulations, the temperature where similar changes occur in comparison to neutron scattering corresponds to the temperature at which the simulated response (Fig. 5) shows the most pronounced shoulder, and the overall intensity begins to decrease. Not surprisingly, the low-energy peak in the Raman scattering experiment is also strongest near the structural transition.
Discussion
The agreement of experiment with theory in both neutron and Raman scattering suggests that a dominant contribution to the FeSe spectra comes from frustrated magnetism of essentially local spins. The differences between the classes of ferro-pnictides and -chalcogenides, in particular the different degrees of itineracy, may then originate in a subtle orbital differentiation across the families Yin et al. (2011).
If FeSe were frustrated, near such a phase boundary between magnetic states, then its behaviour would be consistent with the observed sensitivity to intercalation Burrard-Lucas et al. (2013); Zhang et al. (2013), layer thickness Ge et al. (2015), and pressure Medvedev et al. (2009), which could affect the exchange interactions through the hopping. Relative to the theoretical results below 200 cm-1, critical fluctuations of any origin, which are characterized by a diverging correlation length close to the transition, can neither be described nor distiguished in such a small cluster calculation. Here, only experimental arguments can be applied similar to those in Ref. Kretzschmar et al., 2016, but will not be further discussed, since they are not the primary focus of the analysis. A brief summary may be found in the Supplementary Note 3.
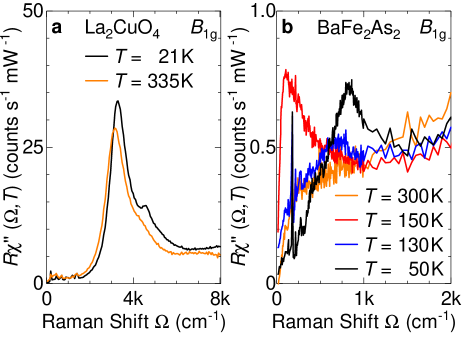
It is remarkable how clearly the Raman spectra of an SDW state originating from a Fermi surface instability and a magnet with local moments can be distingiuished. For comparison, Fig. 7 shows Raman spectra for La2CuO4 and BaFe2As2 at characteristic temperatures. La2CuO4 (Fig. 7a) is an example of a material with local moments on the Cu sites Sulewski et al. (1991); Muschler et al. (2010) having a Néel temperature of K. The well-defined peak at approximately 2.84 Canali and Girvin (1992); Weidinger and Zwerger (2015) possesses a weak and continuous temperature dependence across Knoll et al. (1990). The origin of the scattering in La2CuO4 and other insulating cuprates Chelwani et al. (2018) can thus be traced back to Heisenberg-type physics of local moments Fleury and Loudon (1968), which, for simplicity, need only include the nearest-neighbour exchange interaction .
In contrast, most iron-based superconductors are metallic antiferromagnets in the parent state exhibiting rather different Raman signatures. In BaFe2As2 (Fig. 7b) abrupt changes are observed in symmetry upon entering the SDW state: the fluctuation peak below 100 cm-1 vanishes, a gap develops below some 500-600 cm-1, and intensity piles up in the range 600-1,500 cm-1 Chauvière et al. (2010); Sugai et al. (2012), the typical behaviour of an SDW or CDW Eiter et al. (2013) in weak-coupling, resulting from Fermi surface nesting. Yet, even for itinerant systems such as these, longer range exchange interactions can become relevant and lead to magnetic frustration Yildirim (2009).
In summary, the Raman response of FeSe was measured in all symmetries and compared to simulations of a frustrated spin-1 system. The experimental data were decomposed in order to determine which parts of the spectra originate from particle-hole excitations, fluctuations of local spins, and low energy critical fluctuations. Comparison of the decomposed experimental data with the simulations gives evidence that the dominant contribution of the Raman spectra comes from magnetic competition between and ordering vectors. These features of the Raman spectra, which agree qualitatively with a spin only model, consist of a dominant peak in symmetry around 500 along with a peak at similar energy but lower intensity in and at higher energy in symmetry. These results will likely help to unravel the mechanism behind the superconducting phase found in FeSe.
Methods
Experiment
The FeSe crystals were prepared by the vapor transport technique. Details of the crystal growth and characterization are described elsewhere Böhmer et al. (2013). Before the experiment the samples were cleaved in air and the exposure time was minimized. The surfaces obtained in this way have several atomically flat regions allowing us to measure spectra down to 5 cm-1. At the tetragonal-to-orthorhombic transition twin boundaries appear and become clearly visible in the observation optics. As described in detail by Kretzschmar et al. Kretzschmar et al. (2016) the appearance of stripes can be used to determine the laser heating and to be and K, respectively.
Calibrated Raman scattering equipment was used for the experiment. The samples were attached to the cold finger of a He-flow cryostat having a vacuum of approximately Pa ( mbar). For excitation we used a diode-pumped solid state laser emitting at 575 nm (Coherent GENESIS MX-SLM 577-500) and various lines of an Ar ion laser (Coherent Innova 304). The angle of incidence was close to for reducing the elastic stray light entering the collection optics. Polarization and power of the incoming light were adjusted in a way that the light inside the sample had the proper polarization state and, respectively, a power of typically mW independent of polarization. For the symmetry assignment we use the 1 Fe unit cell (axes and parallel to the Fe-Fe bonds) which has the same orientation as the magnetic unit cell in the cases of Néel or single-stripe order (4 Fe cell). The orthorhombic distortion is along these axes whereas the crystallographic cell assumes a diamond shape with the length of the tetragonal axes preserved. Because of the rotated axes in the 1 Fe unit cell the Fe phonon appears in the spectra. Spectra at low to medium energies were measured with a resolution in steps of or 5 below 250 and steps of 10 above where no sharp peaks need to be resolved. Spectra covering the energy range up to 0.5-1 eV were measured with a resolution in steps of
Simulations
We use exact diagonalization to study a Heisenberg-like model on a 16 site square lattice, which contains the necessary momentum points and is small enough that exact diagonalization can reach high enough temperatures to find agreement with the temperature dependence in the experiment. This was solved using the parallel Arnoldi method Sorensen et al. (1998). The Hamiltonian is given by
| (1) |
where is a spin-1 operator reflecting the observation that the local moments of iron chalcogenides close to 2 Gretarsson et al. (2011). The sum over nn is over nearest neighbours, the sum over 2nn is over next nearest neighbours, and the sum over 3nn is over next next nearest neighbours.
We determine the dominant order according to the largest static spin structure factor, given by
| (2) |
Due to the possible spontaneous symmetry breaking we adjust the structure factor by the degeneracy of the momentum. To characterize the relative strength of the dominant fluctuations we project the relative intensity of the dominant static structure factor onto the range [0,1] using the following
| (3) |
where is the degeneracy of momentum , is the momentum with the largest , and is the momentum with the second largest (subdominant) .
The Raman susceptibilities for , , and symmetries for non-zero temperatures were calculated using the Fleury-Loudon scattering operator Chen et al. (2011) given by
| (4) |
where are the exchange interaction values used in the Hamiltonian, is a unit vector connecting sites and and are the polarization vectors. For the symmetries calculated we use the polarization vectors
| (5) |
(where and point along the Fe-Fe directions). We use this operator to calculate the Raman response using the continued fraction expansion Dagotto (1994), where is given by
| (6) |
with the partition function. The sum traverses over all eigenstates of the Hamiltonian having eigenenergies where is the ground state energy. The Raman susceptibility is given by . The dynamical spin structure factor was calculated using the same method with replaced with .
Acknowledgement
The work was supported by the German Research Foundation (DFG) via the Priority Program SPP 1458 (grant-no. Ha2071/7) and the Transregional Collaborative Research Center TRR80 and by the Serbian Ministry of Education, Science and Technological Development under Project III45018. We acknowledge support by the DAAD through the bilateral project between Serbia and Germany (grant numbers 57142964 and 57335339). The collaboration with Stanford University was supported by the Bavaria California Technology Center BaCaTeC (grant-no. A5 [2012-2]). Work in the SIMES at Stanford University and SLAC was supported by the U.S. Department of Energy, Office of Basic Energy Sciences, Division of Materials Sciences and Engineering, under Contract No. DE-AC02-76SF00515. Computational work was performed using the resources of the National Energy Research Scientific Computing Center supported by the U.S. Department of Energy, Office of Science, under Contract No. DE-AC02-05CH11231.
Author contributions
A.B., T.B., and R.H. conceived the experiment. B.M. and T.P.D. conceived the ED analysis. P.A. and T.W. synthesized and characterized the samples. A.B., N.L., T.B., and R.H.A. performed the Raman scattering experiment. H.N.R. and Y.W. coded and performed the ED calculations. A.B., H.N.R., N.L., B.M., and R.H. analyzed and discussed the data. A.B., H.N.R., N.L., Z.P., B.M., T.P.D., and R.H. wrote the paper. All authors commented on the manuscript.
Competing interests
The authors declare that there are no competing interests.
Data availability
Data are available upon reasonable request from the corresponding author.
Supplementary Note 1: Polarization dependence of the Raman spectra of FeSe
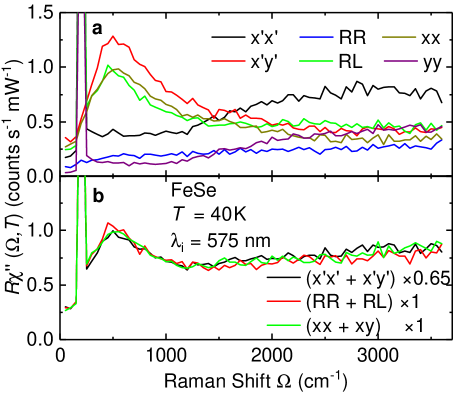
Supplementary Fig. 1a shows the complete set of polarization resolved Raman spectra we measured for FeSe at K up to a maximum energy of eV. The measured spectra have been corrected for the sensitivity of the instrument and divided by the Bose factor . In Supplementary Fig. 1b sums of corresponding pairs of spectra are shown. Each sum contains the full set of all four symmetries () accessible with the light polarizations in the Fe plane. All three sets exhibit the same spectral shape. The spectra measured with linear light polarizations at 45∘ with respect to the Fe-Fe bonds ( and ) were multiplied by a factor of 0.65 to fit the other configurations. The same factor was applied when calculating the sums for extracting the pure symmetries. The reason for this deviation from the expected and intensities lies in small inaccuracies in determining the optical constants. Since we never observed polarization leakages the main effect pertains obviously on the power absorption and transmission rather than phase shifts between the parallel and perpendicular light polarizations.
Supplementary Note 2: Raman spectra of BaFe2As2
Supplementary Fig. 2 shows the Raman spectra of BaFe2As2 as a function of symmetry and temperature. Towards high energies the spectra increase almost monotonically over an energy range of approximately 0.7 eV. We could not observe the pronounced nearly polarization-independent maxima in the range 2,000 - 3,000 cm-1 reported in Ref. Sugai et al., 2010. At high energies our spectra are temperature independent. At low energies pronounced changes are observed in and symmetry upon entering the striped spin density wave (SDW) state below K as described by various authors Chauvière et al. (2010, 2011); Sugai et al. (2012). In and symmetry the changes are small but probably significant in that polarization leakage is unlikely to be the reason for the weak low-temperature peaks in the range 2,000 cm-1 and the gap-like behaviour below approximately 1,000 cm-1. The changes are particularly pronounced in symmetry. As shown in Supplementary Fig. 2c, in Fig. 1b of the main text and in more detail elsewhere Kretzschmar et al. (2016) the fluctuation peak vanishes very rapidly and the redistribution of spectral weight from low to high energies sets in instantaneously at . All these observations show that the polarization and temperature dependences here are fundamentally different from those of FeSe (Fig. 1 of the main text).
Supplementary Note 3: Delineation of the contributions to the spectra
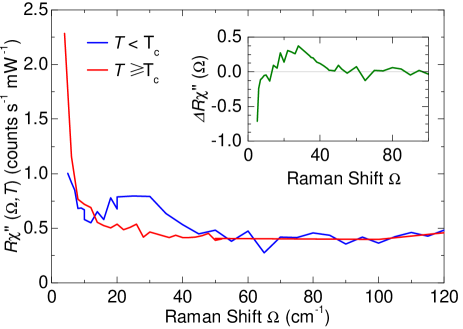
Supplementary Fig. 3 shows Raman spectra of the FeSe sample at temperatures below (blue line) and above (red line) the superconducting transition temperature , which was determined to be K by measuring the third harmonic of the magnetic susceptibility Venturini (2003). Both spectra show a sharp increase towards the laser line which can be attributed to increased elastic scattering due to an accumulation of surface layers at low temperatures. Below a broad peak emerges centred around approximately 28 cm-1 which we identify as pair breaking peak at . Above 50 cm-1 the spectra at and are identical. We could not resolve the second peak close to 40 cm-1 as observed in Ref. Massat et al., 2016. The gap ratio of is comparable to what was found for Ba(Fe0.939Co0.061)2As2 Muschler et al. (2009) but smaller than that found for Ba1-xKxFe2As2 Böhm et al. (2017). The existence of a superconducting gap and a pair-breaking peak in the Raman spectra shows that the magnetic features are superposed on an electronic continuum.
The temperature and symmetry dependence of the Raman response (Figs. 1 and 4 of the main text) indicate that the spectra are a superposition of various scattering channels as shown in Supplementary Fig. 4: (i) particle-hole excitations and presumably also a weak contribution from luminescence in the range up to 1 eV and beyond, (ii) critical fluctuations of either spin or charge in the range below 250 cm-1, and (iii) excitations of neighboring spins with the response centered at 500 cm-1 in and symmetry and at 3,000 cm-1 in symmetry.
(i) An estimate of electron-hole excitations may be obtained by comparing the with the and spectra at various temperatures including . In a first approximation we assume that luminescence has a weak symmetry and temperature dependence and find that the intensities in all channels have the same order of magnitude. We use the continuum for deriving an analytical approximation for modeling the particle-hole spectrum (blue in Supplementary Fig. 4).
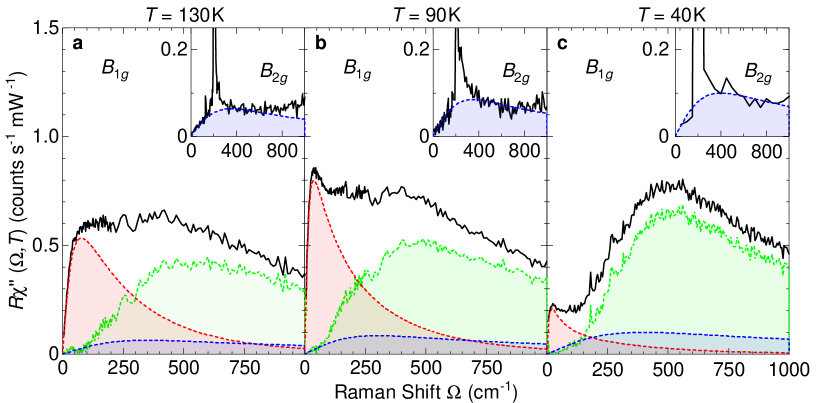
(ii) There are various ways to derive the Raman response of critical fluctuations with finite wave vector . Caprara and coworkers considered the clean limit and, consequently, calculated the response and the selection rules for a pair of fluctuations having and thus maintaining the selection rule for light scattering Caprara et al. (2005). Alternatively the the collision-limited regime was considered where the momentum of the fluctuation can be carried away by an impurity Gallais and Paul (2016). Finally, quadrupolar fluctuations in the unit cell can give rise to Raman scattering Thorsmølle et al. (2016); Massat et al. (2016). In either case the response diverges at or slightly below the structural transition where the correlation length diverges. We used the approach of Ref. Caprara et al., 2005 for modeling the response since we believe that FeSe is in the clean limit and that spin fluctuations are a possible candidate for the response Kretzschmar et al. (2016). Yet, the decision about the type of fluctuations relevant here is not a subject of this publication, and we are predominantly interested in excitations of neighboring spins.
(iii) For isolating the response of neighboring spins in the total Raman response we subtract the particle-hole continuum (i) and the response of fluctuations (ii) from the spectra. The resulting difference is shown in green in Supplementary Fig. 4 and can be considered the best possible approximation to the two-magnon response. At temperatures much smaller or larger than the critical fluctuations do not contribute substantially to the total response and can be ignored. The particle-hole continuum is generally weak. Therefore the simulations can be best compared to the Raman data at temperatures sufficiently far away from as shown in Figs. 3 and 5. Since the simulations were performed on a cluster critical fluctuations cannot be described close to where the correlation length is much larger than the cluster size.
Supplementary Note 4: Temperature dependence in and symmetries
Supplementary Figure 5 compares experimental and simulated Raman spectra in and symmetry up to high energies at room temperature (red), slightly above (green) and below (blue). The choice of temperatures for the simulated spectra corresponds to Fig. 5 of the main text. Sharp phonon peaks (labelled ph) appear in the experimental spectra at 200 cm-1 the shape of which is not reproduced properly since resolution and sampling width are reduced. With (990 cm-1) as found in Ref. Glasbrenner et al., 2015 the experimental and simulated spectra can be compared semi-quantitatively. Both theory and experiment consistently show a gain in intensity for at medium energies and for at high energies (blue shaded areas in the respective spectra) as well as a reduction of spectral weight in in the range from 600 to 1,900 (shaded red). The changes appear to be more continuous in the simulations than in the experiment where the gain in intensity in both symmetries only occurs at . The reduction in spectral weight in symmetry has already taken place at (green spectra).
References
- Yin et al. (2011) Z. P. Yin, K. Haule, and G. Kotliar, “Kinetic frustration and the nature of the magnetic and paramagnetic states in iron pnictides and iron chalcogenides,” Nature Mater. 10, 932–935 (2011).
- Georges et al. (2013) Antoine Georges, Luca de’ Medici, and Jernej Mravlje, “Strong Correlations from Hund’s Coupling,” Annu. Rev. Cond. Mat. Phys. 4, 137–178 (2013).
- Si et al. (2016) Qimiao Si, Rong Yu, and Elihu Abrahams, “High-temperature superconductivity in iron pnictides and chalcogenides,” Nat. Rev. Mater. 1, 16017 (2016).
- Skornyakov et al. (2017) S. L. Skornyakov, V. I. Anisimov, D. Vollhardt, and I. Leonov, “Effect of electron correlations on the electronic structure and phase stability of FeSe upon lattice expansion,” Phys. Rev. B 96, 035137 (2017).
- Li et al. (2009) Shiliang Li, Clarina de la Cruz, Q. Huang, Y. Chen, J. W. Lynn, Jiangping Hu, Yi-Lin Huang, Fong-Chi Hsu, Kuo-Wei Yeh, Maw-Kuen Wu, and Pengcheng Dai, “First-order magnetic and structural phase transitions in ,” Phys. Rev. B 79, 054503 (2009).
- Johnston (2010) D. C. Johnston, “The Puzzle of High Temperature Superconductivity in Layered Iron Pnictides and Chalcogenides ,” Adv. Phys. 59, 803 (2010).
- Yi et al. (2017) Ming Yi, Yan Zhang, Zhi-Xun Shen, and Donghui Lu, “Role of the orbital degree of freedom in iron-based superconductors,” npj Quantum Materials 2, 57 (2017).
- Baek et al. (2014) S.-H. Baek, D. V. Efremov, J. M. Ok, J. S. Kim, Jeroen van den Brink, and B. Büchner, “Orbital-driven nematicity in FeSe,” Nature Mater. 14, 210–214 (2014).
- Taylor et al. (2013) A. E. Taylor, R. A. Ewing, T. G. Perring, R. D. Parker, J. Ollivier, S. J. Clarke, and A. T. Boothroyd, “Absence of strong magnetic fluctuations in FeP-based systems LaFePO and Sr2ScO3FeP,” J. Phys.: Condens. Matter 25, 425701 (2013).
- Mazin and Johannes (2009) I. I. Mazin and M. D. Johannes, “A key role for unusual spin dynamics in ferropnictides,” Nature Phys. 5, 141 (2009).
- Stadler et al. (2015) K. M. Stadler, Z. P. Yin, J. von Delft, G. Kotliar, and A. Weichselbaum, “Dynamical mean-field theory plus numerical renormalization-group study of spin-orbital separation in a three-band Hund metal,” Phys. Rev. Lett. 115, 136401 (2015).
- Glasbrenner et al. (2015) J. K. Glasbrenner, I. I. Mazin, Harald O. Jeschke, P. J. Hirschfeld, R. M. Fernandes, and Roser Valentí, “Effect of magnetic frustration on nematicity and superconductivity in iron chalcogenides,” Nature Phys. 11, 953–958 (2015).
- Baum et al. (2018) A. Baum, Ying Li, M. Tomić, N. Lazarević, D. Jost, F. Löffler, B. Muschler, T. Böhm, J.-H. Chu, I. R. Fisher, R. Valentí, I. I. Mazin, and R. Hackl, “Interplay of lattice, electronic, and spin degrees of freedom in detwinned : A Raman scattering study,” Phys. Rev. B 98, 075113 (2018).
- Anisimov, V. I. et al. (2002) Anisimov, V. I., Nekrasov, I. A., Kondakov, D. E., Rice, T. M., and Sigrist, M., “Orbital-selective Mott-insulator transition in Ca2-xSrxRuO4,” Eur. Phys. J. B 25, 191–201 (2002).
- de’ Medici et al. (2009) Luca de’ Medici, S. R. Hassan, Massimo Capone, and Xi Dai, “Orbital-Selective Mott Transition out of Band Degeneracy Lifting,” Phys. Rev. Lett. 102, 126401 (2009).
- de’ Medici (2017) Luca de’ Medici, “Hund’s Induced Fermi-Liquid Instabilities and Enhanced Quasiparticle Interactions,” Phys. Rev. Lett. 118, 167003 (2017).
- Yi et al. (2015) M. Yi, Z-K Liu, Y. Zhang, R. Yu, J.-X. Zhu, J.J. Lee, R.G. Moore, F.T. Schmitt, W. Li, S.C. Riggs, J.-H. Chu, B. Lv, J. Hu, M. Hashimoto, S.-K. Mo, Z. Hussain, Z.Q. Mao, C.W. Chu, I.R. Fisher, Q. Si, Z.-X. Shen, and D.H. Lu, “Observation of universal strong orbital-dependent correlation effects in iron chalcogenides,” Nature Commun. 6, 7777 (2015).
- Venturini et al. (2002) F. Venturini, M. Opel, T. P. Devereaux, J. K. Freericks, I. Tüttő, B. Revaz, E. Walker, H. Berger, L. Forró, and R. Hackl, “Observation of an Unconventional Metal-Insulator Transition in Overdoped CuO2 Compounds,” Phys. Rev. Lett. 89, 107003 (2002).
- Devereaux and Hackl (2007) Thomas P. Devereaux and Rudi Hackl, “Inelastic light scattering from correlated electrons,” Rev. Mod. Phys. 79, 175 (2007).
- Chen et al. (2011) C.-C. Chen, C. J. Jia, A. F. Kemper, R. R. P. Singh, and T. P. Devereaux, “Theory of Two-Magnon Raman Scattering in Iron Pnictides and Chalcogenides,” Phys. Rev. Lett. 106, 067002 (2011).
- Okazaki et al. (2011) K. Okazaki, S. Sugai, S. Niitaka, and H. Takagi, “Phonon, two-magnon, and electronic Raman scattering of Fe1+yTe1-xSex,” Phys. Rev. B 83, 035103 (2011).
- Sugai et al. (2012) Shunji Sugai, Yuki Mizuno, Ryoutarou Watanabe, Takahiko Kawaguchi, Koshi Takenaka, Hiroshi Ikuta, Yasumasa Takayanagi, Naoki Hayamizu, and Yasuhiro Sone, “Spin-Density-Wave Gap with Dirac Nodes and Two-Magnon Raman Scattering in BaFe2As2,” J. Phys. Soc. Japan 81, 024718 (2012).
- Chauvière et al. (2011) L. Chauvière, Y. Gallais, M. Cazayous, M. A. Méasson, A. Sacuto, D. Colson, and A. Forget, “Raman scattering study of spin-density-wave order and electron-phonon coupling in Ba(Fe1-xCox)2As2,” Phys. Rev. B 84, 104508 (2011).
- Eiter et al. (2013) Hans-Martin Eiter, Michela Lavagnini, Rudi Hackl, Elizabeth A. Nowadnick, Alexander F. Kemper, Thomas P. Devereaux, Jiun-Haw Chu, James G. Analytis, Ian R. Fisher, and Leonardo Degiorgi, “Alternative route to charge density wave formation in multiband systems,” Proc. Nat. Acad. Sciences 110, 64–69 (2013), http://www.pnas.org/content/110/1/64.full.pdf+html .
- Yang et al. (2014) Y.-X. Yang, Y. Gallais, F. Rullier-Albenque, M.-A. Méasson, M. Cazayous, A. Sacuto, J. Shi, D. Colson, and A. Forget, “Temperature-induced change in the Fermi surface topology in the spin density wave phase of Sr(Fe1-xCox)2As2,” Phys. Rev. B 89, 125130 (2014).
- Wang et al. (2015) Fa Wang, Steven A. Kivelson, and Dung-Hai Lee, “Nematicity and quantum paramagnetism in FeSe,” Nature Phys. 11, 959–963 (2015).
- Wang et al. (2016) Qisi Wang, Yao Shen, Bingying Pan, Xiaowen Zhang, K. Ikeuchi, K. Iida, A. D. Christianson, H. C. Walker, D. T. Adroja, M. Abdel-Hafiez, Xiaojia Chen, D. A. Chareev, A. N. Vasiliev, and Jun Zhao, “Magnetic ground state of FeSe,” Nature Commun. 7, 12182 (2016).
- Rahn et al. (2015) M. C. Rahn, R. A. Ewings, S. J. Sedlmaier, S. J. Clarke, and A. T. Boothroyd, “Strong spin fluctuations in observed by neutron spectroscopy,” Phys. Rev. B 91, 180501 (2015).
- Massat et al. (2016) Pierre Massat, Donato Farina, Indranil Paul, Sandra Karlsson, Pierre Strobel, Pierre Toulemonde, Marie-Aude Méasson, Maximilien Cazayous, Alain Sacuto, Shigeru Kasahara, Takasada Shibauchi, Yuji Matsuda, and Yann Gallais, “Charge-induced nematicity in FeSe,” Proc. Nat. Acad. Sciences 113, 9177–9181 (2016).
- Sulewski et al. (1991) P. E. Sulewski, P. A. Fleury, K. B. Lyons, and S-W. Cheong, “Observation of chiral spin fluctuations in insulating planar cuprates,” Phys. Rev. Lett. 67, 3864 (1991).
- Muschler et al. (2010) B. Muschler, W. Prestel, L. Tassini, R. Hackl, M. Lambacher, A. Erb, Seiki Komiya, Yoichi Ando, D.C. Peets, W.N. Hardy, R. Liang, and D.A. Bonn, “Electron interactions and charge ordering in CuO2 compounds,” Eur. Phys. J. Special Topics 188, 131 (2010).
- Knoll et al. (1990) P. Knoll, C. Thomsen, M. Cardona, and P. Murugaraj, “Temperature-dependent lifetime of spin excitations in RBa2Cu3O6 ( R = Eu, Y),” Phys. Rev. B 42, 4842–4845 (1990).
- Choi et al. (2008) K.-Y. Choi, D. Wulferding, P. Lemmens, N. Ni, S. L. Bud’ko, and P. C. Canfield, “Lattice and electronic anomalies of CaFe2As2 studied by Raman spectroscopy,” Phys. Rev. B 78, 212503 (2008).
- Gallais et al. (2013) Y. Gallais, R. M. Fernandes, I. Paul, L. Chauvière, Y.-X. Yang, M.-A. Méasson, M. Cazayous, A. Sacuto, D. Colson, and A. Forget, “Observation of Incipient Charge Nematicity in Ba(Fe1-xCox)2As2,” Phys. Rev. Lett. 111, 267001 (2013).
- Kretzschmar et al. (2016) F. Kretzschmar, T. Böhm, U. Karahasanović, B. Muschler, A. Baum, D. Jost, J. Schmalian, S. Caprara, M. Grilli, C. Di Castro, J. H. Analytis, J.-H. Chu, I. R. Fisher, and R. Hackl, “Critical spin fluctuations and the origin of nematic order in ,” Nature Phys. 12, 560–563 (2016).
- Burrard-Lucas et al. (2013) Matthew Burrard-Lucas, David G. Free, Stefan J. Sedlmaier, Jack D. Wright, Simon J. Cassidy, Yoshiaki Hara, Alex J. Corkett, Tom Lancaster, Peter J. Baker, Stephen J. Blundell, and Simon J. Clarke, “Enhancement of the superconducting transition temperature of fese by intercalation of a molecular spacer layer,” Nature Mater. 12, 15–19 (2013).
- Zhang et al. (2013) An-min Zhang, Tian-long Xia, Kai Liu, Wei Tong, Zhao-rong Yang, and Qing-ming Zhang, “Superconductivity at 44 K in K intercalated FeSe system with excess Fe,” Sci. Rep. 3, 1216 (2013).
- Ge et al. (2015) Jian-Feng Ge, Zhi-Long Liu, Canhua Liu, Chun-Lei Gao, Dong Qian, Qi-Kun Xue, Ying Liu, and Jin-Feng Jia, “Superconductivity above 100 K in single-layer FeSe films on doped SrTiO3,” Nature Mater. 14, 285–289 (2015).
- Medvedev et al. (2009) S. Medvedev, T. M. McQueen, I. A. Troyan, T. Palasyuk, M. I. Eremets, R. J. Cava, S. Naghavi, F. Casper, V. Ksenofontov, G. Wortmann, and C. Felser, “Electronic and magnetic phase diagram of -Fe1.01Se with superconductivity at 36.7 K under pressure,” Nature Mater. 8, 630 (2009).
- Canali and Girvin (1992) C. M. Canali and S. M. Girvin, “Theory of Raman scattering in layered cuprate materials,” Phys. Rev. B 45, 7127–7160 (1992).
- Weidinger and Zwerger (2015) Simon Adrian Weidinger and Wilhelm Zwerger, “Higgs mode and magnon interactions in 2D quantum antiferromagnets from Raman scattering,” Eur. Phys. B 88, 237 (2015).
- Chelwani et al. (2018) N. Chelwani, A. Baum, T. Böhm, M. Opel, F. Venturini, L. Tassini, A. Erb, H. Berger, L. Forró, and R. Hackl, “Magnetic excitations and amplitude fluctuations in insulating cuprates,” Phys. Rev. B 97, 024407 (2018).
- Fleury and Loudon (1968) P. A. Fleury and R. Loudon, “Scattering of Light by One- and Two-Magnon Excitations,” Phys. Rev. 166, 514 (1968).
- Chauvière et al. (2010) L. Chauvière, Y. Gallais, M. Cazayous, M. A. Méasson, A. Sacuto, D. Colson, and A. Forget, “Impact of the spin-density-wave order on the superconducting gap of Ba(Fe1-xCox)2As2,” Phys. Rev. B 82, 180521 (2010).
- Yildirim (2009) Taner Yildirim, “Frustrated magnetic interactions, giant magneto-elastic coupling, and magnetic phonons in iron-pnictides,” Physica C 469, 425 (2009).
- Böhmer et al. (2013) A. E. Böhmer, F. Hardy, F. Eilers, D. Ernst, P. Adelmann, P. Schweiss, T. Wolf, and C. Meingast, “Lack of coupling between superconductivity and orthorhombic distortion in stoichiometric single-crystalline FeSe,” Phys. Rev. B 87, 180505 (2013).
- Sorensen et al. (1998) D.C. Sorensen, R.B. Lehoucq, and C. Yang, ARPACK Users’ Guide: Solution of Large-Scale Eigenvalue Problems with Implicitly Restarted Arnoldi Methods (Siam, Philadelphia, 1998).
- Gretarsson et al. (2011) H. Gretarsson, A. Lupascu, Jungho Kim, D. Casa, T. Gog, W. Wu, S. R. Julian, Z. J. Xu, J. S. Wen, G. D. Gu, R. H. Yuan, Z. G. Chen, N.-L. Wang, S. Khim, K. H. Kim, M. Ishikado, I. Jarrige, S. Shamoto, J.-H. Chu, I. R. Fisher, and Young-June Kim, “Revealing the dual nature of magnetism in iron pnictides and iron chalcogenides using x-ray emission spectroscopy,” Phys. Rev. B 84, 100509 (2011).
- Dagotto (1994) Elbio Dagotto, “Correlated electrons in high-temperature superconductors,” Rev. Mod. Phys. 66, 763 (1994).
- Sugai et al. (2010) S. Sugai, Y. Mizuno, K. Kiho, M. Nakajima, C. H. Lee, A. Iyo, H. Eisaki, and S. Uchida, “Pairing symmetry of the multiorbital pnictide superconductor BaFe1.84Co0.16As2 from Raman scattering,” Phys. Rev. B 82, 140504 (2010).
- Venturini (2003) F. Venturini, Raman Scattering Study of Electronic Correlations in Cuprates: Observation of an Unconventional Metal-Insulator Transition, Ph.D. thesis, TU-München (2003).
- Muschler et al. (2009) B. Muschler, W. Prestel, R. Hackl, T. P. Devereaux, J. G. Analytis, Jiun-Haw Chu, and I. R. Fisher, “Band- and momentum-dependent electron dynamics in superconducting Ba(Fe1-xCox)2As2 as seen via electronic Raman scattering,” Phys. Rev. B 80, 180510 (2009).
- Böhm et al. (2017) T. Böhm, F. Kretzschmar, A. Baum, M. Rehm, D. Jost, R. Hosseinian Ahangharnejhad, R. Thomale, C. Platt, T. A. Maier, W. Hanke, B. Moritz, T. P. Devereaux, D. J. Scalapino, S. Maiti, P. J. Hirschfeld, P. Adelmann, T. Wolf, H.-H. Wen, and R. Hackl, “Microscopic pairing fingerprint of the iron-based superconductor ,” ArXiv e-prints (2017), arXiv:1703.07749 [cond-mat.supr-con] .
- Caprara et al. (2005) S. Caprara, C. Di Castro, M. Grilli, and D. Suppa, “Charge-Fluctuation Contribution to the Raman Response in Superconducting Cuprates,” Phys. Rev. Lett. 95, 117004 (2005).
- Gallais and Paul (2016) Yann Gallais and Indranil Paul, “Charge nematicity and electronic Raman scattering in iron-based superconductors,” C. R. Physique 17, 113 – 139 (2016).
- Thorsmølle et al. (2016) V. K. Thorsmølle, M. Khodas, Z. P. Yin, Chenglin Zhang, S. V. Carr, Pengcheng Dai, and G. Blumberg, “Critical quadrupole fluctuations and collective modes in iron pnictide superconductors,” Phys. Rev. B 93, 054515 (2016).