Magnetic-field-induced suppression of spin Peltier effect in Pt/ system at room temperature
Abstract
We report the observation of magnetic-field-induced suppression of the spin Peltier effect (SPE) in a junction of a paramagnetic metal Pt and a ferrimagnetic insulator (YIG) at room temperature. For driving the SPE, spin currents are generated via the spin Hall effect from applied charge currents in the Pt layer, and injected into the adjacent thick YIG film. The resultant temperature modulation is detected by a commonly-used thermocouple attached to the Pt/YIG junction. The output of the thermocouple shows sign reversal when the magnetization is reversed and linearly increases with the applied current, demonstrating the detection of the SPE signal. We found that the SPE signal decreases with the magnetic field. The observed suppression rate was found to be comparable to that of the spin Seebeck effect (SSE), suggesting the dominant and similar contribution of the low-energy magnons in the SPE as in the SSE.
I Introduction
Thermoelectric conversion is one of the promising technologies for smart energy utilization Zhang and Zhao (2015). Owing to the progress of spintronics in this decade, the spin-based thermoelectric conversion is now added to the scope of the thermoelectric technology Bauer et al. (2012); Boona et al. (2014); Uchida et al. (2016); Flipse et al. (2014, 2012); Slachter et al. (2010). In particular, the thermoelectric generation mediated by flow of spins, or spin current, has attracted much attention because of the advantageous scalability, simple fabrication processes, and flexible design of the figure of merit Uchida et al. (2008, 2010a); Kirihara et al. (2012); Ramos et al. (2015); Uchida et al. (2016); Adachi et al. (2013). This is realized by combining the spin Seebeck effect (SSE) Uchida et al. (2010b) and spin-to-charge conversion effects Saitoh et al. (2006); Sinova et al. (2015); Hoffmann (2013), where a spin current is generated by an applied thermal gradient and is converted into electricity owing to spin–orbit coupling.
The SSE has a reciprocal effect called the spin Peltier effect (SPE), discovered by Flipse et al. in 2014 in a Pt/yttrium iron garnet (: YIG) junction Flipse et al. (2014); Daimon et al. (2016). In the SPE, a spin current across a normal conductor (N)/ferromagnet (F) junction induces a heat current, which can change the temperature distribution around the junction system.
To reveal the mechanism of the SPE, systematic experiments have been conducted Uchida et al. (2017); Daimon et al. (2017, 2016). Since the SPE is driven by magnetic fluctuations (magnons) in the F layer, detailed study on the magnetic-field and temperature dependence is indispensable for clarifying the microscopic relation between the SPE and magnon excitation and the reciprocity between the SPE and SSE Uchida et al. (2014); Rezende et al. (2014); Kikkawa et al. (2015); Jin et al. (2015); Barker and Bauer (2016); Guo et al. (2016); Basso et al. (2016); Iguchi et al. (2017); Miura et al. (2017); Ohnuma et al. (2017). A high magnetic field is expected to affect the magnitude of the SPE signal via the modulation of spectral properties of magnons. In fact, the SSE thermopower in a Pt/YIG system was shown to be suppressed by high magnetic fields even at room temperature against the conventional theoretical expectation based on the equal contribution over the magnon spectrum Kikkawa et al. (2015). This anomalously-large suppression highlights the dominant contribution of sub-thermal magnons, which possess lower energy and longer propagation length than thermal magnons Hioki et al. (2017); Jin et al. (2015); Guo et al. (2016); Miura et al. (2017). Thus, the experimental examination of the field dependence of the SPE is an important task for understanding the SPE. Although the SPE has recently been measured in various systems by using the lock-in thermography (LIT) Daimon et al. (2016), it is difficult to be used at high fields and/or low temperatures. For investigating the high-magnetic-field response of the SPE, an alternative method is required.
In this paper, we investigate the magnetic field dependence of the SPE up to 9 T at 300 K by using a commonly-used thermocouple (TC) wire. As revealed by the LIT experiments Daimon et al. (2016, 2017), the temperature modulation induced by the SPE is localized in the vicinity of N/F interfaces. This is the reason why the magnitude of the SPE signals is very small in the first experiment by Flipse et al. Flipse et al. (2014), where a thermopile sensor is put on the bare YIG surface, not on the Pt/YIG junction. Here, we show that the SPE can be detected with better sensitivity simply by attaching a common TC wire on a N/F junction. This simple SPE detection method enables systematic measurements of the magnetic field dependence of the SPE, since it is easily integrated to conventional measurement systems. In the following, we describe the details of the electric detection of the SPE signal using a TC, the results of the magnetic field dependence of the SPE signal in a high-magnetic-field range, and its comparison to that of the SSE thermopower.
II Experimental
The spin current for driving the SPE is generated via the spin Hall effect (SHE) from a charge current applied to N Sinova et al. (2015); Hoffmann (2013). The SHE-induced spin current then forms spin accumulation at the N/F interface, whose spin vector representation is given by
| (1) |
where is the spin Hall angle of N, the charge-current-density vector, and the unit vector normal to the interface directing from F to N. at the interface exerts spin-transfer torque to magnons in F via the interfacial exchange coupling at finite temperatures, when is parallel or anti-parallel to the equilibrium magnetization () Tserkovnyak et al. (2005); Zhang and Zhang (2012). The torque increases or decreases the number of the magnons depending on the polarization of the torque ( or ), and eventually changes the system temperature by energy transfer, concomitant with the spin-current injection Flipse et al. (2014); Daimon et al. (2016); Ohnuma et al. (2017). The energy transfer induces observable temperature modulation in isolated systems, which satisfies the following relation
| (2) |
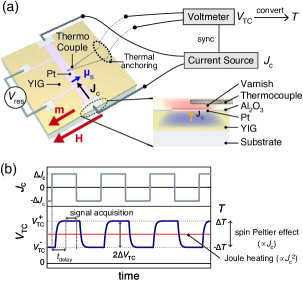
A schematic of the sample system and measurement geometry is shown in Fig. 1(a). The sample system is a Pt strip on a single-crystal YIG. The YIG layer is 112--thick and grown by a liquid phase epitaxy method on a 500--thick substrate with the lateral dimension 10 × 10 , where small amount of Bi is substituted for the Y-site of the YIG to compensate the lattice mismatching to the substrate. The Pt strip, connected to four electrodes, is 5-nm-thick, 0.5-mm-wide, fabricated by a sputtering method, and patterned with a metal mask. Then, the whole surface of the sample except the electrodes is covered by a highly-resistive film with a thickness of nm by means of an atomic layer deposition method. We attached a TC wire to the top of the Pt/YIG junction, where the wire is electrically insulated from but thermally connected to the Pt layer owing to the layer. We used a type-E TC with a diameter of 0.013 mm (Omega engineering CHCO-0005), and fixed its junction part on the middle of the Pt strip using varnish. The rest of the TC wires were fixed on the sample surface for thermal-anchoring and avoiding thermal leakage from the top of the Pt/YIG junction [see the cross sectional view in Fig. 1(a)]. The expected thickness of the varnish between the TC and the sample surface is in the order of 111This is estimated from the thickness of the varnish layer sandwiched between glass substrates pressed with the same pressure applied to the sample; we pressed the sample and the TC wire with an additional glass cover.. Note that the thickness of the varnish layer does not affect the magnitude of the signal while it affects the temporal response of the TC 222As the radiation to the outer environment at the surface is negligibly small, the vertical heat current in the varnish layer is zero at the steady-state condition. The effect of the lateral heat currents, expected at the edges of the Pt strip, is also small as the total thickness from the top of the Pt strip to the surface () is smaller than the width (). . The ends of the Pt strip are connected to a current source and the other two electrodes are used for measuring resistance based on the four-terminal method. The magnetic field is applied in the film plane and perpendicular to the strip, thus is along , satisfying the symmetry of the SPE [Eq. (2)]. The TC is connected to electrodes on a heat bath, which acts as a thermal anchor, and further connected to a voltmeter via conductive wires. The measurements were carried out at 300 K and Pa.
For the electric detection of the SPE, we measured the amplitude difference () of the TC voltage in response to a change () in the current (so-called Delta-mode of the nanovoltmeter Keithley 2182A). After the current is set to , time delay () is inserted before measuring the corresponding voltages . Then, is obtained as . The time delay is necessary because the temperature modulation occurred at the Pt/YIG junction takes certain time to reach and stabilize the TC. The appropriate value of can be determined from the delay-dependence of the SPE signal, which will be shown in Sec. III. For the SPE measurements, we set no offset current () so that is free from Joule heating (), and the SPE is expected to dominate the signal [see Fig. 1(a)]. By using the measured values of , the temperature modulation () is estimated via the relation , where is the Seebeck coefficient of the TC. For the low-field measurements (), the reference value of at 300 K is used, while, for the high-field measurements, the field dependence of , determined by the method shown in Appendix A, is used.
III Results and Discussion
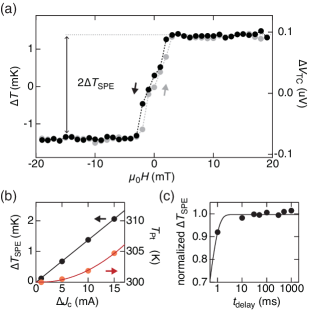
First, we demonstrated the electric detection of the SPE at low fields. Figure 2(a) shows as a function of the field magnitude at and . clearly changes its sign when the field direction is reversed and the appearance of the hysteresis demonstrates that it reflects the magnetization curve of the YIG, showing the symmetry expected from Eq. (2) Daimon et al. (2016); Flipse et al. (2014). The small offset of may be attributed to the temperature modulation by the Peltier effect appearing around the current electrodes, Joule heating due to small uncanceled current offsets, and possible electrical leakage of the applied current from the sample to the TC. Since the Peltier and resistance effects are of even functions of the magnetization cosines though the SPE is of an odd function, the SPE-induced temperature modulation can be extracted by subtracting the symmetric response to the magnetization: Flipse et al. (2014). Figure 2(b) shows the dependence of and the temperature () of the Pt strip, estimated from the resistance of the strip. While increases parabolically with the magnitude of for Joule heating, increases linearly as is expected from the characteristic of the SPE. This distinct dependencies show negligibly small contribution to from the Joule heating in this study 333The SPE signal at 305 and 310 K (nominal) was observed to show the same magnitude as that at 300 K. Thus the temperature increase due to the Joule heating does not affect the measured SPE value.. The magnitude of the SPE signal is estimated to be , where is the difference in . This value is almost same as the value obtained in the thermographic experiments Daimon et al. (2016, 2017); since in Ref. Daimon et al. (2017) the sine-wave amplitude of is divided by the rectangular-wave amplitude of , a correction factor of is necessary, i.e. in the previous study. We note that, in the above and following measurements, is chosen based on the dependence of [Fig. 2(c)], where is almost saturated at . Such finite but small thermal-stabilization time can be explained by the thermal diffusion from the junction to the TC and rapid thermal stabilization of the SPE-induced temperature modulation Daimon et al. (2016).
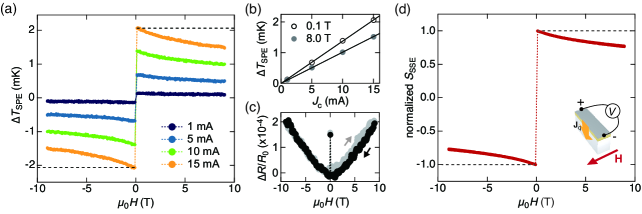
Next, we measured the field dependence of the SPE at higher fields up to . Figure 3(a) shows as a function of , where is changed from 1 to 15 mA. The suppression of the signal at higher fields is clearly observed for all the values. As shown in Fig. 3(b), the signal shows a linear variation with both at and 8.0 T, demonstrating a constant suppression rate. Since the resistance of the sample varies only 1 % at most [Fig. 3(c)], the junction temperature keeps constant during the field scan. The field dependence of the thermal conductivity of YIG is also irrelevant to the suppression as it is known to be negligibly small at room temperature Boona and Heremans (2014). Thus we can conclude that the suppression is attributed to the nature of the SPE. By calculating the suppression magnitude as
we obtained .
To compare to the field-induced suppression of the SSE, we performed SSE measurements in a longitudinal configuration using a Pt/YIG junction system fabricated at the same time as the SPE sample. The SSE sample has the lateral dimension and the same vertical configuration as the SPE sample except for the absence of the layer. The detailed method of the SSE measurement is available elsewhere Uchida et al. (2012); Iguchi et al. (2017); Sola et al. (2017). Figure 3(d) shows the field dependence of the SSE thermopower in the Pt/YIG junction. The clear suppression of the SSE thermopower is observed. Importantly, the high-field response of the SSE is quite similar to that of the SPE in the Pt/YIG system. The suppression magnitude of the SSE , defined in the same manner as the SPE, is estimated to be , consistent with the previously reported values Kikkawa et al. (2015); Jin et al. (2015); Guo et al. (2016).
The observed remarkable field-induced suppression of the SPE at room temperature shows that the SPE is likely dominated by low-energy magnons because the energy scale of the applied field is less than and thus much lower than the thermal energy of 300 K Kikkawa et al. (2015). The origin of the strong contribution of the low-energy magnons in the SPE can be (i) stronger coupling of the spin torque to the low-energy (sub-thermal) magnons and (ii) greater propagation length of the low-energy magnons than those of high-energy (thermal) magnons Hioki et al. (2017). While (i) is not well experimentally investigated, the existence of the -range length scale in the SPE Daimon et al. (2017) and the similarity between and suggest the dominant contribution from (ii) as in the case of the SSE Guo et al. (2016); Hioki et al. (2017). In fact, recently, it has been demonstrated that the high magnetic fields reduce the propagation length of magnons contributing to the SSE Hioki et al. (2017). This length-scale scenario can qualitatively explain the suppression in the SPE. Recalling that a heat current density () existing over a distance ( generates the temperature difference in an isolated system, should decrease when decreases, where is the thermal conductivity of the system. In the SPE, corresponds to the magnon propagation length Cornelissen et al. (2016), and a flow of magnons accompanies a heat current Boona and Heremans (2014). Consequently, when the high magnetic field is applied and the magnons with longer propagation length are suppressed by the Zeeman gap, the averaged magnon propagation length decreases and thus results in the reduced . To further investigate the microscopic mechanism of the SPE, consideration of the spectral non-uniformity may be vital both in experiments and theories.
IV Summary
In this study, we showed the magnetic field dependence of the spin Peltier effect (SPE) up to 9.0 T at 300 K in a Pt/YIG junction system. We established a simple but sensitive detection method of the SPE using a commonly-available thermocouple wire. The SPE signals were observed to be suppressed at high magnetic fields, highlighting the stronger contribution of low-energy magnons in the SPE. The similar suppression rate of the SPE-induced temperature modulation to that of the SSE-induced thermopower suggests that the suppression originates the decrease in the magnon propagation length as in the case of the SSE. We anticipate that the experimental results and the method reported here will be useful for systematic investigation of the SPE.
Acknowledgements.
The authors thank T. Kikkawa for the aid in measuring the SSE and G. E. W. Bauer and Y. Ohnuma for the valuable discussion. This work was supported by PRESTO “Phase Interfaces for Highly Efficient Energy Utilization” (Grant No. JPMJPR12C1) and ERATO “Spin Quantum Rectification Project” (Grant No. JPMJER1402) from JST, Japan, Grant-in-Aid for Scientific Research (A) (Grant No. JP15H02012), and Grant-in-Aid for Scientific Research on Innovative Area “Nano Spin Conversion Science” (Grant No. JP26103005) from JSPS KAKENHI, Japan, NEC Corporation, the Noguchi Institute, and E-IMR, Tohoku University. S.D. was supported by JSPS through a research fellowship for young scientists (Grant No. JP16J02422). K.O. acknowledges support from GP-Spin at Tohoku University.Appendix A Calibration of Thermo Couple at High Magnetic Fields
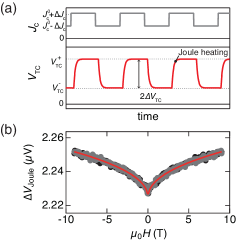
To measure the field dependence of , we used the Joule-heating-induced signal as a reference. By adding a non-zero offset () to the applied current, we obtained the temperature modulation induced by the Joule heating, of which the power changes from to , where denotes the resistance of the strip [Fig. 4(a)]. Figure 4(b) shows the magnetic field dependence of the component of symmetric to the field (). As the change in , due to the ordinary, spin Hall, and Hanle magnetoresistance effects Nakayama et al. (2013); Vélez et al. (2016), is in the order of 0.02 % [Fig.3(c)], its contribution to can be neglected. Similarly, the field dependence of the thermal conductivity of YIG is negligibly small Boona and Heremans (2014), ensuring the constant temperature change. Accordingly, the field dependence of directly reflects . It increases by a factor of when the field magnitude increases up to 9.0 T. We approximated the field dependence of as by determining the relative change from the measurement results and the absolute value from the reference value.
References
- Zhang and Zhao (2015) X. Zhang and L.-D. Zhao, J. Materiomics 1, 92 (2015).
- Bauer et al. (2012) G. E. W. Bauer, E. Saitoh, and B. J. van Wees, Nat. Mater. 11, 391 (2012).
- Boona et al. (2014) S. R. Boona, R. C. Myers, and J. P. Heremans, Energy Environ. Sci. 7, 885 (2014).
- Uchida et al. (2016) K. Uchida, H. Adachi, T. Kikkawa, A. Kirihara, M. Ishida, S. Yorozu, S. Maekawa, and E. Saitoh, Proc. IEEE 104, 1946 (2016).
- Flipse et al. (2014) J. Flipse, F. K. Dejene, D. Wagenaar, G. E. W. Bauer, J. B. Youssef, and B. J. van Wees, Phys. Rev. Lett. 113, 027601 (2014).
- Flipse et al. (2012) J. Flipse, F. L. Bakker, A. Slachter, F. K. Dejene, and B. J. van Wees, Nat. Nanotech. 7, 166 (2012).
- Slachter et al. (2010) A. Slachter, F. L. Bakker, J. P. Adam, and B. J. van Wees, Nat. Phys. 6, 879 (2010).
- Uchida et al. (2008) K. Uchida, S. Takahashi, K. Harii, J. Ieda, W. Koshibae, K. Ando, S. Maekawa, and E. Saitoh, Nature 455, 778 (2008).
- Uchida et al. (2010a) K. Uchida, J. Xiao, H. Adachi, J. Ohe, S. Takahashi, J. Ieda, T. Ota, Y. Kajiwara, H. Umezawa, H. Kawai, G. E. W. Bauer, S. Maekawa, and E. Saitoh, Nat. Mater. 9, 894 (2010a).
- Kirihara et al. (2012) A. Kirihara, K. Uchida, Y. Kajiwara, M. Ishida, Y. Nakamura, T. Manako, E. Saitoh, and S. Yorozu, Nat. Mater. 11, 686 (2012).
- Ramos et al. (2015) R. Ramos, T. Kikkawa, M. H. Aguirre, I. Lucas, A. Anadón, T. Oyake, K. Uchida, H. Adachi, J. Shiomi, P. A. Algarabel, L. Morellón, S. Maekawa, E. Saitoh, and M. R. Ibarra, Phys. Rev. B 92, 220407 (2015).
- Adachi et al. (2013) H. Adachi, K. Uchida, E. Saitoh, and S. Maekawa, Rep. Prog. Phys. 76, 036501 (2013).
- Uchida et al. (2010b) K. Uchida, H. Adachi, T. Ota, H. Nakayama, S. Maekawa, and E. Saitoh, Appl. Phys. Lett. 97, 172505 (2010b).
- Saitoh et al. (2006) E. Saitoh, M. Ueda, H. Miyajima, and G. Tatara, Appl. Phys. Lett. 88, 2509 (2006).
- Sinova et al. (2015) J. Sinova, S. O. Valenzuela, J. Wunderlich, C. H. Back, and T. Jungwirth, Rev. Mod. Phys. 87, 1213 (2015).
- Hoffmann (2013) A. Hoffmann, IEEE Trans. Magn. 49, 5172 (2013).
- Daimon et al. (2016) S. Daimon, R. Iguchi, T. Hioki, E. Saitoh, and K. Uchida, Nat. Commun. 7, 13754 (2016).
- Uchida et al. (2017) K. Uchida, R. Iguchi, S. Daimon, R. Ramos, A. Anad n, I. Lucas, P. A. Algarabel, L. Morelln, M. H. Aguirre, M. R. Ibarra, and E. Saitoh, Phys. Rev. B 95, 184437 (2017).
- Daimon et al. (2017) S. Daimon, K. Uchida, R. Iguchi, T. Hioki, and E. Saitoh, Phys. Rev. B 96, 024424 (2017).
- Uchida et al. (2014) K. Uchida, T. Kikkawa, A. Miura, J. Shiomi, and E. Saitoh, Phys. Rev. X 4, 041023 (2014).
- Rezende et al. (2014) S. M. Rezende, R. L. Rodriguez-Suarez, R. O. Cunha, A. R. Rodrigues, F. L. A. Machado, G. A. F. Guerra, J. C. L. Ortiz, and A. Azevedo, Phys. Rev. B 89, 014416 (2014).
- Kikkawa et al. (2015) T. Kikkawa, K. Uchida, S. Daimon, Z. Qiu, Y. Shiomi, and E. Saitoh, Phys. Rev. B 92, 064413 (2015).
- Jin et al. (2015) H. Jin, S. R. Boona, Z. Yang, R. C. Myers, and J. P. Heremans, Phys. Rev. B 92, 054436 (2015).
- Barker and Bauer (2016) J. Barker and G. E. W. Bauer, Phys. Rev. Lett. 117, 217201 (2016).
- Guo et al. (2016) E.-J. Guo, J. Cramer, A. Kehlberger, C. A. Ferguson, D. A. MacLaren, G. Jakob, and M. Kläui, Phys. Rev. X 6, 031012 (2016).
- Basso et al. (2016) V. Basso, E. Ferraro, A. Magni, A. Sola, M. Kuepferling, and M. Pasquale, Phys. Rev. B 93, 184421 (2016).
- Iguchi et al. (2017) R. Iguchi, K. Uchida, S. Daimon, and E. Saitoh, Phys. Rev. B 95, 174401 (2017).
- Miura et al. (2017) A. Miura, T. Kikkawa, R. Iguchi, K. Uchida, E. Saitoh, and J. Shiomi, Phys. Rev. Materials 1, 014601 (2017).
- Ohnuma et al. (2017) Y. Ohnuma, M. Matsuo, and S. Maekawa, to be published in Phys. Rev. B (2017).
- Hioki et al. (2017) T. Hioki, R. Iguchi, Z. Qiu, D. Hou, K. Uchida, and E. Saitoh, Appl. Phys. Express 10, 073002 (2017).
- Tserkovnyak et al. (2005) Y. Tserkovnyak, A. Brataas, G. E. W. Bauer, and B. I. Halperin, Rev. Mod. Phys. 77, 1375 (2005).
- Zhang and Zhang (2012) S. S. L. Zhang and S. Zhang, Phys. Rev. B 86, 214424 (2012).
- Note (1) This is estimated from the thickness of the varnish layer sandwiched between glass substrates pressed with the same pressure applied to the sample; we pressed the sample and the TC wire with an additional glass cover.
- Note (2) As the radiation to the outer environment at the surface is negligibly small, the vertical heat current in the varnish layer is zero at the steady-state condition. The effect of the lateral heat currents, expected at the edges of the Pt strip, is also small as the total thickness from the top of the Pt strip to the surface () is smaller than the width ().
- Note (3) The SPE signal at 305 and 310 K (nominal) was observed to show the same magnitude as that at 300 K. Thus the temperature increase due to the Joule heating does not affect the measured SPE value.
- Boona and Heremans (2014) S. R. Boona and J. P. Heremans, Phys. Rev. B 90, 064421 (2014).
- Uchida et al. (2012) K. Uchida, T. Ota, H. Adachi, J. Xiao, T. Nonaka, Y. Kajiwara, G. E. W. Bauer, S. Maekawa, and E. Saitoh, J. Appl. Phys. 111, 103903 (2012).
- Sola et al. (2017) A. Sola, P. Bougiatioti, M. Kuepferling, D. Meier, G. Reiss, M. Pasquale, T. Kuschel, and V. Basso, Sci. Rep. 7, 46752 (2017).
- Cornelissen et al. (2016) L. J. Cornelissen, K. J. H. Peters, G. E. W. Bauer, R. A. Duine, and B. J. van Wees, Phys. Rev. B 94, 014412 (2016).
- Nakayama et al. (2013) H. Nakayama, M. Althammer, Y. T. Chen, K. Uchida, Y. Kajiwara, D. Kikuchi, T. Ohtani, S. Geprägs, M. Opel, S. Takahashi, R. Gross, G. E. W. Bauer, S. T. B. Goennenwein, and E. Saitoh, Phys. Rev. Lett. 110, 206601 (2013).
- Vélez et al. (2016) S. Vélez, V. N. Golovach, A. Bedoya-Pinto, M. Isasa, E. Sagasta, M. Abadia, C. Rogero, L. E. Hueso, F. S. Bergeret, and F. Casanova, Phys. Rev. Lett. 116, 016603 (2016).