ASASSN-16fp (SN 2016coi): A transitional supernova between
Type Ic and broad-lined Ic
Abstract
We present results based on a well sampled optical () and ultraviolet (Swift/UVOT) imaging, and low-resolution optical spectroscopic follow-up observations of the nearby Type Ic supernova (SN) ASASSN-16fp (SN 2016coi). The SN was monitored during the photospheric phase ( to 33 days with respect to the -band maximum light). The rise to maximum light and early post-maximum decline of the light curves are slow. The peak absolute magnitude ( = mag) of ASASSN-16fp is comparable with broad-lined Ic SN 2002ap, SN 2012ap and transitional Ic SN 2004aw but considerably fainter than the GRB/XRF associated supernovae (e.g. SN 1998bw, 2006aj). Similar to the light curve, the spectral evolution is also slow. ASASSN-16fp shows distinct photospheric phase spectral lines along with the C ii features. The expansion velocity of the ejecta near maximum light reached 16000 km s-1 and settled to 8000 km s-1, 1 month post-maximum. Analytical modelling of the quasi-bolometric light curve of ASASSN-16fp suggests that 0.1 M⊙ 56Ni mass was synthesized in the explosion, with a kinetic energy of 6.9 1051 erg and total ejected mass of 4.5 0.3 M⊙.
keywords:
Supernovae: general – supernovae, individual – ASASSN-16fp (SN 2016coi), galaxies: individual – UGC 118681 Introduction
A large fraction of massive stars undergo catastrophic explosions at the end point of their lives due to the gravitational collapse of their cores (e.g. Woosley & Weaver, 1986; Heger et al., 2003; Smartt, 2009). Such events are recognized as core-collapse supernovae (CCSNe). Various physical mechanisms play a crucial role during the evolutionary phases of these progenitor stars, and consequently, the post-explosion observational features (e.g light curve shapes, luminosities, spectral evolution etc.) exhibit heterogeneity. Among the larger group of CCSNe (see Minkowski, 1941; Filippenko, 1997) Type Ib, Ic and IIb constitute the ‘stripped-envelope, SE’ (Clocchiatti & Wheeler, 1997) sub-category where the progenitor’s outer envelope of hydrogen and/or helium is partially or completely removed before they explode. A radiation-driven stellar wind (Puls, Vink & Najarro, 2008), eruptive mass loss (Smith & Owocki, 2006) and/or mass transfer with a companion star (Wheeler & Levreault, 1985; Podsiadlowski, Joss & Hsu, 1992; Yoon, Woosley & Langer, 2010) are the likely mechanisms for the stripping of the outer envelopes. A sub-population of Type Ic (He poor or absent) SNe are differentiated with very broad absorption lines in their spectra which signify high expansion velocities of the ejecta ( 14000 km s-1, a few days after the explosion). These events are commonly designated as ‘broad-line’ Ic SNe (BL-Ic). A small fraction of them are linked with long-duration gamma ray bursts (GRBs) and X-ray Flash (XRF) e.g. SN 1998bw/GRB 980425 (Galama et al., 1998; Patat et al., 2001) and SN 2006aj/XRF 060218 (Pian et al., 2006), while no such association is observed in a majority of the BL-Ic events e.g. SN 2012ap (Milisavljevic et al., 2015), SN 2009bb (Pignata et al., 2011), SN 2007ru (Sahu et al., 2009), SN 2003jd (Valenti et al., 2008a), SN 2002ap (Mazzali et al., 2002; Gal-Yam et al., 2002) and SN 1997ef (Iwamoto et al., 2000).
In recent attempts, using large data samples, several groups have investigated the observational properties of different SE-SNe using single as well as multi-band photometry (c.f. Richardson et al., 2006, 2014; Drout et al., 2011; Cano, 2013; Bianco et al., 2014; Pritchard et al., 2014; Taddia et al., 2015; Lyman et al., 2016; Prentice et al., 2016). Matheson et al. (2001) compared spectra of different SE-SNe and characterized individual SNe types in detail. More recently, Modjaz et al. (2014) and Liu et al. (2016) have, using an updated larger spectroscopic data set, provided with an identification scheme that helps constrain the progenitors of different kinds of SE-SNe. All these studies indicate that both Type Ic and BL-Ic SNe exhibit diversity in terms of their explosion parameters (e.g. mass of ejecta, mass of newly synthesized 56Ni and kinetic energy of the explosion). There are a few SE-SNe such as SN 2004aw that are known to have properties between Type Ic and BL-Ic SNe. These Ic events, termed as transitional Type Ic (Taubenberger et al., 2006), are just a few in number. In order to understand them better, detailed studies of similar events are needed. The nearby supernova ASASSN-16fp exhibits properties similar to SN 2004aw and provides an opportunity to explore the observational properties of the transitional Ic events.
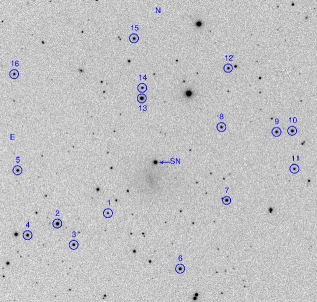
ASASSN-16fp was discovered (Holoien et al., 2016) in the outskirts of the nearby galaxy UGC 11868 (Type: Sm) on 2016 May 27.6 UT (JD 2457536.1) by the Brutus telescope of the All Sky Automated Survey for SuperNovae (ASAS-SN111http://www.astronomy.ohio-state.edu/~assassin/index.shtml) project. The SN was located approximately 31.7 arcsec North and 7.9 arcsec West from the center of the host galaxy. The apparent brightness of the SN at the time of discovery was reported as 15.7 mag (-band). It was classified as a broad line Type Ic similar to SN 2006aj a few days before the maximum brightness (Elias-Rosa et al., 2016). Additional spectroscopic data obtained from various telescopes confirmed the broad-line nature of this object. The absorption features at 5550 Å , 6300 Å and 6700 Å present in the spectrum were identified as He i 5876, 6678, and 7065 lines respectively, indicating possible presence of helium in the ejecta of ASASSN-16fp (Yamanaka et al., 2016). This transient was also detected in the X-ray, UV (Grupe et al., 2016) and the radio domain (Nayana & Chandra, 2016; Mooley et al., 2016; Argo et al., 2016). Table 1 lists some of the basic parameters of ASASSN-16fp.
We present in this paper the results of photometric (optical and UV) and low-resolution optical spectroscopic observations of ASASSN-16fp during the early phase.
| Parameters | Value | Reference |
| RA (J2000) | = 21h 59m 0414 | 1 |
| DEC (J2000) | = 18° 11′ 1046 | 1 |
| Explosion epoch (UT) | 2016 May 25.9 | Section 3 |
| (JD 2457534.4) | ||
| Discovery date (UT) | 2016 May 27.6 | 1 |
| (JD 2457536.1) | ||
| Distance | 18.1 1.3 Mpc | 2 |
| 0.074 0.002 mag | Section 3.3 |
1 Holoien et al. (2016)
2 NASA/IPAC Extragalactic Database (NED)
| Star | |||||
|---|---|---|---|---|---|
| ID | (mag) | (mag) | (mag) | (mag) | (mag) |
| 1 | 17.28 0.03 | 17.18 0.03 | 16.48 0.02 | 16.10 0.02 | 15.70 0.02 |
| 2 | 14.99 0.02 | 15.03 0.01 | 14.42 0.01 | 14.07 0.01 | 13.70 0.01 |
| 3 | 17.07 0.02 | 16.47 0.02 | 15.58 0.01 | 15.10 0.01 | 14.65 0.01 |
| 4 | 17.32 0.03 | 16.47 0.02 | 15.47 0.01 | 14.94 0.01 | 14.48 0.01 |
| 5 | 17.43 0.03 | 16.69 0.02 | 15.73 0.01 | 15.19 0.01 | 14.70 0.01 |
| 6 | 15.74 0.02 | 15.63 0.02 | 14.98 0.01 | 14.60 0.01 | 14.22 0.01 |
| 7 | 16.59 0.02 | 16.07 0.02 | 15.20 0.01 | 14.72 0.01 | 14.28 0.01 |
| 8 | 16.87 0.02 | 16.61 0.02 | 15.72 0.01 | 15.20 0.01 | 14.69 0.01 |
| 9 | 16.22 0.02 | 16.08 0.02 | 15.35 0.01 | 14.92 0.01 | 14.49 0.01 |
| 10 | 16.06 0.02 | 15.96 0.01 | 15.30 0.01 | 14.90 0.01 | 14.51 0.01 |
| 11 | 16.84 0.02 | 16.86 0.02 | 16.22 0.02 | 15.82 0.02 | 15.42 0.02 |
| 12 | 17.09 0.03 | 16.59 0.02 | 15.75 0.01 | 15.29 0.01 | 14.87 0.01 |
| 13 | 15.29 0.02 | 14.95 0.01 | 14.16 0.01 | 13.72 0.01 | 13.31 0.01 |
| 14 | 16.73 0.02 | 16.58 0.02 | 15.84 0.02 | 15.42 0.01 | 15.01 0.01 |
| 15 | 16.31 0.02 | 16.24 0.02 | 15.54 0.01 | 15.12 0.01 | 14.72 0.01 |
| 16 | 16.44 0.02 | 16.46 0.02 | 15.78 0.01 | 15.36 0.02 | 14.94 0.01 |
2 Observations and data reduction
| Date | JD | Phase∗ | |||||
|---|---|---|---|---|---|---|---|
| (yyyy-mm-dd) | 2457000+ | (d) | (mag) | (mag) | (mag) | (mag) | (mag) |
| 2016-05-29 | 538.4 | 9.8 | 15.37 0.03 | 15.64 0.03 | 14.95 0.02 | 14.64 0.02 | 14.69 0.02 |
| 2016-05-30 | 539.3 | 8.9 | 15.19 0.03 | 15.46 0.03 | 14.73 0.02 | 14.46 0.02 | 14.52 0.02 |
| 2016-05-31 | 540.4 | 7.8 | 15.07 0.03 | 15.28 0.03 | 14.51 0.02 | 14.27 0.02 | 14.35 0.02 |
| 2016-06-01 | 541.4 | 6.8 | 14.98 0.02 | 15.15 0.02 | 14.34 0.02 | 14.14 0.02 | 14.21 0.02 |
| 2016-06-02 | 542.5 | 5.8 | 14.92 0.02 | – | 14.19 0.02 | 14.01 0.02 | – |
| 2016-06-03 | 543.4 | 4.8 | 14.88 0.02 | 14.93 0.02 | 14.07 0.02 | 13.87 0.02 | 13.98 0.02 |
| 2016-06-05 | 545.4 | 2.8 | 14.86 0.04 | 14.82 0.04 | 13.90 0.03 | 13.71 0.03 | 13.83 0.03 |
| 2016-06-10 | 550.3 | 2.2 | 14.97 0.02 | 14.80 0.03 | 13.76 0.02 | 13.53 0.02 | 13.62 0.02 |
| 2016-06-11 | 551.4 | 3.3 | – | – | – | 13.52 0.02 | – |
| 2016-06-13 | 553.4 | 5.2 | 15.14 0.02 | 14.92 0.03 | 13.77 0.02 | 13.49 0.02 | 13.54 0.02 |
| 2016-06-16 | 556.4 | 8.2 | 15.39 0.02 | 15.13 0.03 | 13.86 0.02 | 13.52 0.02 | 13.54 0.02 |
| 2016-06-18 | 558.4 | 10.2 | 15.62 0.02 | 15.30 0.03 | 13.95 0.02 | 13.55 0.02 | 13.56 0.02 |
| 2016-06-19 | 559.4 | 11.2 | 15.73 0.02 | 15.39 0.04 | 14.00 0.02 | 13.58 0.02 | 13.58 0.03 |
| 2016-06-21 | 561.3 | 13.2 | 15.98 0.02 | 15.59 0.02 | 14.12 0.02 | 13.63 0.02 | 13.62 0.02 |
| 2016-06-22 | 562.4 | 14.2 | 16.11 0.04 | 15.68 0.04 | 14.17 0.03 | 13.67 0.03 | 13.65 0.03 |
| 2016-06-24 | 564.5 | 16.3 | – | – | 14.28 0.02 | 13.75 0.02 | – |
| 2016-06-26 | 566.3 | 18.1 | 16.47 0.02 | 15.96 0.02 | 14.36 0.02 | 13.82 0.02 | 13.73 0.02 |
| 2016-06-30 | 570.4 | 22.2 | 16.82 0.04 | 16.27 0.03 | 14.64 0.02 | 13.98 0.03 | 13.87 0.04 |
| 2016-07-01 | 571.4 | 23.2 | 16.86 0.03 | 16.31 0.02 | 14.69 0.02 | 14.05 0.02 | 13.90 0.02 |
| 2016-07-03 | 573.5 | 25.3 | – | – | 14.79 0.02 | 14.15 0.02 | 13.97 0.02 |
| 2016-07-05 | 575.3 | 27.1 | 17.05 0.02 | 16.47 0.02 | 14.87 0.03 | 14.20 0.02 | 14.01 0.02 |
| 2016-07-06 | 576.2 | 28.1 | 17.08 0.02 | 16.52 0.02 | 14.93 0.02 | 14.25 0.02 | 14.03 0.02 |
| 2016-07-10 | 580.4 | 32.2 | – | – | – | 14.35 0.04 | 14.12 0.05 |
| 2016-07-11 | 581.4 | 33.3 | 17.19 0.03 | 16.65 0.03 | 15.12 0.02 | 14.42 0.02 | 14.17 0.03 |
∗ With reference to the -band maximum (JD 2457548.2).
| Date | JD | Phase∗ | ||||||
|---|---|---|---|---|---|---|---|---|
| (yyyy-mm-dd) | 2457000+ | (d) | (mag) | (mag) | (mag) | (mag) | (mag) | (mag) |
| 2016-05-27 | 536.2 | 12.0 | 15.88 0.06 | 16.45 0.07 | 15.78 0.08 | 17.54 0.13 | 16.53 0.08 | 17.74 0.16 |
| 2016-05-29 | 537.9 | 10.3 | 15.27 0.03 | 15.81 0.03 | 15.10 0.03 | 17.00 0.08 | 16.13 0.05 | 17.09 0.05 |
| 2016-06-03 | 543.1 | 5.1 | 14.69 0.05 | 14.93 0.05 | 13.97 0.05 | 17.21 0.11 | – | 16.77 0.01 |
| 2016-06-04 | 544.3 | 3.9 | 14.69 0.05 | 14.86 0.04 | 13.86 0.05 | 17.37 0.12 | 15.96 0.07 | 16.93 0.09 |
| 2016-06-05 | 544.5 | 3.7 | 14.74 0.05 | 14.91 0.04 | 13.90 0.04 | 17.26 0.10 | 15.91 0.07 | 17.07 0.10 |
| 2016-06-06 | 546.1 | 2.1 | 14.79 0.06 | 14.83 0.04 | 13.77 0.05 | 17.26 0.12 | 15.96 0.09 | 17.21 0.12 |
| 2016-06-07 | 546.6 | 1.6 | 14.73 0.05 | 14.79 0.04 | 13.77 0.05 | 17.46 0.13 | 16.08 0.08 | 16.91 0.10 |
| 2016-06-08 | 547.9 | 0.3 | 14.84 0.05 | 14.80 0.04 | 13.68 0.04 | 17.43 0.16 | 16.17 0.08 | 17.08 0.10 |
| 2016-06-10 | 549.8 | 1.6 | 14.97 0.05 | 14.81 0.04 | 13.66 0.04 | 17.85 0.12 | 16.28 0.07 | 17.23 0.09 |
| 2016-06-11 | 551.0 | 2.8 | 15.05 0.05 | 14.82 0.04 | 13.63 0.04 | 17.78 0.12 | 16.36 0.08 | 17.29 0.10 |
| 2016-06-12 | 552.3 | 4.2 | 15.08 0.06 | 14.84 0.04 | 13.64 0.04 | 18.15 0.20 | 16.26 0.08 | 17.51 0.13 |
| 2016-06-12 | 552.4 | 4.2 | 15.10 0.07 | 14.89 0.05 | 13.67 0.05 | 17.92 0.18 | 16.40 0.11 | 17.65 0.16 |
| 2016-06-14 | 554.4 | 6.2 | 15.41 0.05 | 15.01 0.04 | 13.71 0.04 | 18.06 0.14 | 16.66 0.08 | 17.58 0.19 |
| 2016-06-15 | 554.9 | 6.8 | 15.48 0.06 | 15.02 0.04 | 13.66 0.04 | 18.03 0.15 | 16.68 0.09 | 17.55 0.11 |
| 2016-06-16 | 556.0 | 7.8 | 15.49 0.06 | 15.02 0.04 | 13.77 0.04 | 18.30 0.20 | 16.78 0.10 | 17.53 0.12 |
| 2016-06-18 | 558.1 | 9.9 | 15.75 0.07 | 15.27 0.04 | 13.81 0.04 | 17.99 0.15 | 17.07 0.12 | 18.09 0.18 |
| 2016-06-21 | 561.0 | 12.9 | 15.49 0.04 | 15.49 0.04 | 14.01 0.04 | 18.37 0.16 | 17.12 0.10 | 18.20 0.16 |
∗ With reference to the -band maximum (JD 2457548.2).
| Date | J.D. | Phase∗ | Range |
|---|---|---|---|
| (yyyy-mm-dd) | (2457000+) | (d) | (Å) |
| 2016-05-30 | 539.4 | 8.8 | 3500–9250 |
| 2016-05-31 | 540.4 | 7.8 | 3500–9250 |
| 2016-06-01 | 541.4 | 6.8 | 3500–9250 |
| 2016-06-02 | 542.4 | 5.8 | 3500–7800 |
| 2016-06-03 | 543.4 | 4.8 | 3500–9250 |
| 2016-06-10 | 550.3 | 2.2 | 3500–9250 |
| 2016-06-11 | 551.4 | 3.2 | 3500–9250 |
| 2016-06-13 | 553.4 | 5.2 | 3500–9250 |
| 2016-06-17 | 557.4 | 9.3 | 3500–9250 |
| 2016-06-19 | 559.3 | 11.1 | 3500–9250 |
| 2016-06-21 | 561.4 | 13.2 | 3500–9250 |
| 2016-06-24 | 564.4 | 16.3 | 3500–9250 |
| 2016-06-26 | 566.3 | 18.1 | 3500–9250 |
| 2016-06-30 | 570.4 | 22.2 | 3500–9250 |
| 2016-07-01 | 571.4 | 23.3 | 3500–9250 |
| 2016-07-06 | 576.2 | 28.0 | 3500–9250 |
| 2016-07-11 | 581.4 | 33.3 | 5200–9250 |
∗ With reference to the -band maximum (JD 2457548.2).
2.1 Photometric observation
Optical monitoring of ASASSN-16fp began on 2016 May 29 (JD 2457538.4). The observations were carried out in Bessell bands with the Himalayan Faint Object Spectrograph Camera (HFOSC) mounted on the Cassegrain focus of the 2 m Himalayan Chandra Telescope (HCT) situated at the Indian Astronomical Observatory (IAO), Hanle, India. HFOSC is equipped with liquid nitrogen cooled 2k 4k pixels SITe CCD chip (pixel size 15 15 m). The gain and readout noise of the detector are 1.22 e-/ADU and 4.87e-, respectively. With a plate scale of 0.296 arcsec per pixel, the central 2k 2k region covers a field of 10 10 on the sky and the same was used for imaging purpose. We obtained several bias and twilight flat frames in addition to the science frames. The pre-processing of raw data (bias-subtraction, flat-fielding and cosmic ray removal) was performed using the standard tasks available in the data reduction software IRAF 222IRAF is distributed by the National Optical Astronomy Observatory, which is operated by the Association of Universities for Research in Astronomy (AURA) under a cooperative agreement with the National Science Foundation.. In order to increase the signal-to-noise ratio, on some of the nights, multiple frames were taken and co-added in respective bands after alignment of the images.
To calibrate a sequence of secondary standards in the SN field, we observed Landolt photometric standard fields (Landolt, 1992) PG 1633+009, PG 2213-006 and SA 110 on four nights under good photometric conditions along with the SN field. The point spread function photometry on all frames (including the SN and Landolt fields) was done using the stand-alone version of DAOPHOT333DAOPHOT stands for Dominion Astrophysical Observatory Photometry. (Stetson, 1987, 1992). The average atmospheric extinction values in , , , and bands for the site were adopted from Stalin et al. (2008). The observed Landolt field stars having a brightness range of 12.02 16.25 mag and colour range of mag were chosen for the calibration. Using these stars, transformation to the standard system was derived by applying the average colour terms and the photometric zero points. Sixteen secondary standard stars calibrated in this way are marked in Figure 1 and their respective magnitudes averaged over four nights are listed in Table 2. Since, the location of SN in its host galaxy is fairly isolated, we did not consider host galaxy flux contamination to the SN. Final results of the SN photometry in bands are listed in Table 3.
The Swift UVOT data on ASASSN-16fp, downloaded from the Swift database (http://www.swift.ac.uk/swift_portal/) are also used in this work. The SN was monitored in the UVOT , , , , , and bands (see, Poole et al., 2008). These observations began on JD 2457536.2 and continued up to JD 2457581.4. The prescriptions of Brown et al. (2009) were adopted to reduce the UVOT data. Aperture photometry was performed to estimate the SN magnitudes, using uvotsource task in HEASoft (High Energy Astrophysics Software). It is recommended using an aperture size of 5 to estimate the magnitudes. However, since the SN was faint, we used a smaller aperture size of 3, and applied aperture corrections as listed by Poole et al. (2008). The background counts were determined from the nearby region having an aperture size similar to that used for the SN. Final Swift magnitudes (in Vega-system) are listed in Table 4.
2.2 Spectroscopic observation
Low-resolution optical spectroscopic observations of ASASSN-16fp were obtained at seventeen epochs during 2016 May 30 (JD 2457539.4) to 2016 July 11 (JD 2457581.4). All spectra were obtained using grisms Gr#7 (3500–7800 Å) and Gr#8 (5200–9250 Å) with the HFOSC, having a resolution of 7 Å. The journal of spectroscopic observations is given in Table 5. Calibration frames such as spectra of arc lamp and spectrophotometric standards were also obtained. Spectroscopic data reduction was done under the IRAF environment. Bias and flat field corrections were performed on each frame, and the one dimensional spectra extracted using the optimal extraction method. The dispersion solutions obtained using arc lamp spectra were used for wavelength calibration. To secure the wavelength calibration, night-sky emission lines were used, and wherever necessary small shifts were applied. Instrumental response curves, derived using the spectrophotometric standards observed on most of the nights, were used for flux calibration. For those nights where standard star observations were not available, the response curves obtained during nearby nights were used. To construct a single flux calibrated spectrum, the flux calibrated spectrum in each grism was combined. The spectra were then scaled with respect to the calibrated fluxes to bring them to an absolute flux scale. Finally, the SN spectra were corrected for the host galaxy redshift of = 0.0037 (from NED), and de-reddened by a total reddening = 0.074 mag (see Section 3.3).
| Parameter | |||||
|---|---|---|---|---|---|
| JD max (2457000+) | 545.8 0.5 | 548.2 0.4 | 550.7 0.4 | 553.2 0.4 | 555.3 0.5 |
| T (days) | –3.4 0.6 | 0 | +2.5 0.6 | +5.0 0.6 | +7.1 0.6 |
| Apparent mag at max | 14.84 0.02 | 14.76 0.01 | 13.74 0.01 | 13.50 0.01 | 13.54 0.01 |
| m15 | 1.06 0.04 | 1.01 0.03 | 0.60 0.02 | 0.42 0.02 | 0.32 0.02 |
# Time to reach the maximum for each band with respect to the -band maximum.
3 Light curve properties
A discussion on the epoch of explosion, the multi-band light curves, colour evolution and absolute -band light curve of ASASSN-16fp is provided in this section. These properties are compared with other well studied Ic and BL-Ic events.
3.1 Explosion epoch
Given the fact that we have good cadence of data points during the pre-maximum phase, we estimated the explosion epoch by fitting a power law of the form to the initial data points (pre-maximum). Here, denotes the luminosity at time , the parameter defines the rising rate, is the time of explosion and is a free parameter. The best fit to the observed data points provides an explosion date of 2016 May (JD 2457535.3). ASASSN-16fp was detected on 2016 May 27.6 (see Section 1), with pre-outburst last non-detection reported on 2016 May 21.5 (see Holoien et al., 2016). Assuming the SN exploded between the last non-detection and the date of discovery, the explosion date may be estimated as 2016 May 25 (JD 2457533.5 3). We adopt an average of the above two i.e. 2016 May 25.9 (JD 2457534.4) as our estimate to the date of the explosion of ASASSN-16fp. This is consistent with the explosion epoch of JD 2457533.0 estimated by Yamanaka et al. (2017).
| SN name | Type | Distance modulus | References | |
|---|---|---|---|---|
| (mag) | (mag) | |||
| 1997ef | BL-Ic | – | 33.63 | 1 |
| 1998bw | BL-Ic (GRB-SN) | 0.05 | 32.28 | 2, 3, 4 |
| 2002ap | BL-Ic | 0.08 | 29.50 | 5, 6, 7, 8, 9 |
| 2003jd | BL-Ic | 0.14 | 34.46 | 10 |
| 2004aw | Tr-Ic | 0.37 | 34.17 | 11 |
| 2006aj | BL-Ic (XRF-SN) | 0.13 | 35.60 | 12, 13, 14 |
| 2007ru | BL-Ic | 0.26 | 34.15 | 15 |
| 2007gr | Ic | 0.09 | 29.84 | 16, 17 |
| 2009bb | BL-Ic | 0.58 | 33.01 | 18 |
| 2010bh | BL-Ic (XRF-SN) | 0.49 | 36.90 | 19, 20 |
| 2012ap | BL-Ic | 0.45 | 33.17 | 21 |
| 2014ad | BL-Ic | 0.24 | 32.11 | 22 |
References: 1 (Mazzali et al., 2000), 2 (Iwamoto et al., 1998), 3 (Galama et al., 1998), 4 (Clocchiatti et al., 2011), 5 (Gal-Yam et al., 2002), 6 (Foley et al., 2003), 7 (Mazzali et al., 2002), 8 (Pandey et al., 2003), 9 (Yoshii et al., 2003), 10 (Valenti et al., 2008a), 11 (Taubenberger et al., 2006), 12 (Mirabal et al., 2006), 13 (Pian et al., 2006), 14 (Sollerman et al., 2006), 15 (Sahu et al., 2009), 16 (Hunter et al., 2009), 17 (Valenti et al., 2008b), 18 (Pignata et al., 2011), 19 (Cano et al., 2011), 20 (Olivares E. et al., 2012), 21 (Milisavljevic et al., 2015), 22 (Sahu et al., 2017).
3.2 Light curve features
The and Swift UVOT light curves of ASASSN-16fp are shown in Figure 2. The follow-up observations began on 2016 May 29 (JD 2457638.4) and continued until around 30 d after -band maximum. During this time span, we obtained photometric observations at 24 epochs with the HCT, and at 17 epochs with Swift satellite.
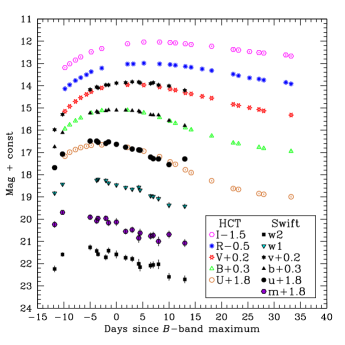
The epoch of maximum magnitude in different bands and their corresponding brightness were determined by fitting a low-order polynomial to the observed data points around the maximum light. The derived values are listed in Table 6. The light curve evolution of ASASSN-16fp follows the behaviour exhibited by other Ic/BL-Ic SNe i.e. the peak in the bluer bands appear earlier than the redder bands, which is attributed to the underlying spectrum and/or cooling of the photosphere (Taddia et al., 2015). The maximum in the -band occurred on JD 2457548.2 0.4 (i.e. around 14 d after the explosion) with an apparent magnitude of 14.76 0.01 mag while, in the -band, it peaked 3.4 days earlier. It took around 2.5, 5 and 7 days after -band maximum to reach to maximum light in the , and bands, respectively (cf. Table 6).
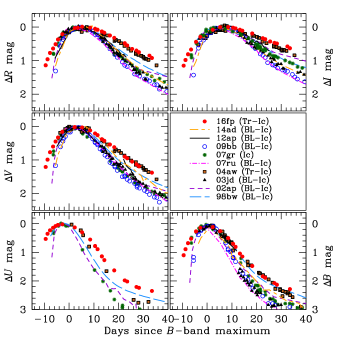
In Figure 3, the light curves of ASASSN-16fp are plotted along with those of other well studied Type Ic and BL-Ic SNe (see Table 7). The light curves of SNe used for the comparison were shifted in time axis to match the epoch of -band maxima of ASASSN-16fp, and normalized with respect to their peak magnitudes. For the purpose of comparison, only those objects that have densely sampled light curves, with coverage around maximum light were considered. The -band light curve of ASASSN-16fp is compared with those of SN 2002ap, SN 2004aw, SN 2007gr and SN 1998bw, as only these objects fit in our criteria.
A careful inspection of Figure 3 reveals that the light curves of ASASSN-16fp is broad in all the bands. Both the rise and decline of the light curves are slower than most of the objects used in comparison. The evolution of -band light curve of ASASSN-16fp between 0 to +20 d is slower than SN 1998bw, 2002ap, 2004aw and 2007gr. The post-maximum evolution of band light curves of SN 2004aw and ASASSN-16fp are similar. The m15 (decline in magnitude after 15 days post-maximum) parameter of ASASSN-16fp and SN 2004aw are comparable, except for -band. The respective m15 values in , , , and bands for ASASSN-16fp are 1.06 0.04, 1.01 0.03, 0.60 0.02, 0.42 0.02 and 0.32 0.02 and for SN 2004aw 1.62 0.25, 1.09 0.04, 0.62 0.03, 0.41 0.03 and 0.34 0.03 (Taubenberger et al., 2006). The m15,R of ASASSN-16fp is slightly lower than the mean m15,R computed by Drout et al. (2011) for a sample of BL-Ic (0.6 0.14 mag) and normal Ic (0.73 0.27 mag) events. This emphasizes the slow decline of ASASSN-16fp light curves compared to normal Ic and BL-Ic events, while being similar to the transitional Ic SN 2004aw.
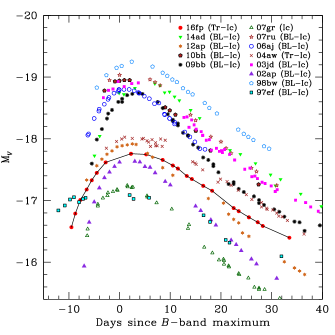
In Figure 4, we compare the peak absolute magnitudes in -band () for various well studied Ic and BL-Ic SNe. The is estimated after correcting for extinction and adopting distance measurements from the respective studies as listed in Table 7. In case of the host galaxy UGC 11868 of ASASSN-16fp, precise distance measurement (e.g. cepheid distances) is unavailable. However, for the present study, we have adopted distance444The distance was taken from NASA/IPAC Extragalactic Data base http://ned.ipac.caltech.edu/, and it is corrected for Virgo infall. of 18.1 1.3 Mpc ( = 31.29 0.15 mag, H0 = 73 km sec-1 Mpc-1). With = mag, the absolute -band luminosity of ASASSN-16fp is comparable with BL-Ic SN 2012ap ( mag, Milisavljevic et al., 2015), SN 2002ap ( mag, Foley et al., 2003; Pandey et al., 2003) and transitional Ic SN 2004aw ( mag, Taubenberger et al., 2006). From figure 4 it is evident that there are several BL-Ic events considerably brighter than ASASSN-16fp, while BL-Ic SN 1997ef ( mag, Mazzali et al., 2004) and normal Ic SN 2007gr ( mag, Hunter et al., 2009) are 0.5 mag fainter than ASASSN-16fp. The absolute -band luminosity of = mag for ASASSN-16fp is 1 mag fainter than BL-Ic sample ( mag) of Drout et al. (2011), but only slightly fainter than their normal Ic sample ( mag).
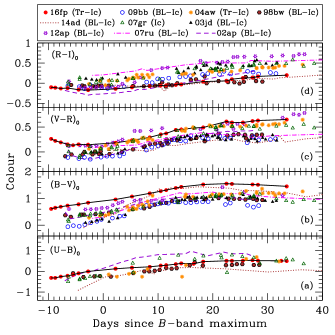
3.3 Extinction and colour evolution
The Galactic reddening towards ASASSN-16fp is = 0.074 0.002 mag (Schlafly & Finkbeiner, 2011). The strength of Na i D absorption lines is found to be coupled with the reddening (Barbon et al., 1990; Turatto et al., 2003), though exceptions exist (Poznanski et al., 2011). In the low-resolution spectra presented in this work, a weak Na i D absorption due to the ISM in the Milky Way is seen, while none detected at the redshift of the host galaxy. The absence of Na i D line at rest wavelength of the host indicates negligible extinction within the host galaxy. A similar conclusion has also been arrived at by Yamanaka et al. (2017). We have used = 0.074 mag for further analysis in this paper.
Figure 5 presents the evolution of the reddening corrected , , and colours for SNe ASASSN-16fp, 2014ad, 2012ap, 2009bb, 2007gr, 2007ru, 2004aw, 2003jd, 2002ap and 1998bw. The extinction values for these events have been taken from the references as mentioned in Table 7. The diverse nature of colour evolution is likely due to the varying nature of the expansion and cooling of the SN photosphere. Both and colours of majority of the SNe follow a blue to red trend until about +10 days, and beyond that, the colour evolution is almost flat (cf. panel a and b in Fig. 5). It is to be noted that among the compared events, the colour of ASASSN-16fp is redder by 0.6 mag and, continues to be so till the last epoch of data presented here. The and colours are shown in panels (c) and (d) of Figure 5, respectively. The color of ASASSN-16fp exhibits red-blue-red transition between d to d, a colour variation not evident in the other events used for comparison. Drout et al. (2011) have examined the multi-band light curve of Ibc SNe in the local universe (distance 150 Mpc). They have shown that the colour of Ibc SNe around 10 days past -band maximum shows very small scatter, ranging between 0.18 to 0.34 mag (with a mean colour 0.26 0.06 mag). Using a set of theoretical models Dessart et al. (2016) have confirmed the findings of Drout et al. (2011). At similar epoch, the colour of ASASSN-16fp is 0.43 0.02 mag indicating it to be intrinsically redder. The colour evolution of compared SNe shows considerable dispersion.
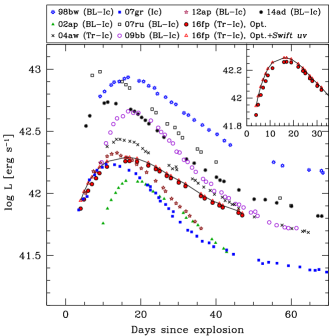
3.4 Bolometric light curve and explosion parameters
The bolometric light curve is crucial for calculation of various explosion parameters such as amount of ejecta mass expelled during the explosion (), kinetic energy (), mass of 56Ni synthesized in the explosion. These in turn help to infer the nature of the progenitor. The quasi-bolometric light curve of ASASSN-16fp was constructed using the optical and Swift UVOT magnitudes presented in Section 3. The data were interpolated wherever it was necessary and observed magnitudes were corrected for extinction = 0.074 mag. The extinction corrected magnitudes were then converted to monochromatic flux at the filter effective wavelength, using the magnitude to flux conversion zero points from Bessell et al. (1998) and Poole et al. (2008). The fluxes were then interpolated using the spline fitting. To obtain the quasi-bolometric luminosity, fluxes from 0.31 m to 0.93 m were integrated. Additionally, when Swift data was available (between JD 2457536.2 to JD 2457561.0) flux was integrated from 0.16 m to 0.93 m. The quasi-bolometric luminosities estimated from both optical and optical + Swift UV magnitudes are shown with different symbols in Figure 6. The bolometric light curves of several other well studied Ic and BL-Ic SNe, estimated in a similar way have also been plotted in the same figure. The bolometric light curve of ASASSN-16fp peaked at JD 2457559.5 with log(Lbol) = 42.26 erg s-1. It is fainter than GRB associated SN 1998bw, BL-Ic SNe 2014ad, 2009bb, 2007ru, and transitional Ic SN 2004aw. It is also brighter than BL-Ic SN 2002ap, and comparable to BL-Ic SN 2012ap and normal Ic SN 2007gr. During the post-peak phase, the evolution of bolometric light curve of ASASSN-16fp is slower than SN 2002ap, 2007gr and 2012ap.
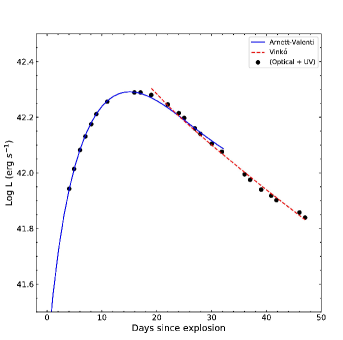
In SE-SNe the bolometric luminosity peak is mainly dominated by the decay of 56Ni and the shape is determined by kinetic energy () and total mass of the ejecta (). To derive explosion parameters for ASASSN-16fp we followed the analytical model originally proposed by Arnett (1982) and later updated by Valenti et al. (2008a). This model is valid only during the photospheric phase where ejecta is optically thick. The model involve various assumptions such as spherically symmetric and homologous expansion of the ejecta, centrally located and unmixed 56Ni, small stellar radius (at the onset of explosion), and a constant opacity ().
The model comprises two free parameters and . The timescale () of the light curve is represented by
| (1) |
In the equation, is a constant of integration (Arnett, 1982) and c is speed of light. The optical opacity is adopted as 0.07 cm2 g-1 (eg. Chugai, 2000; Toy et al., 2016). For a uniform density (Arnett, 1982, 1996), the kinetic energy of ejecta can be expressed as
| (2) |
The bolometric light curve (optical + Swift UV) till 35 days after explosion was used for fitting the analytical model. The best fit values obtained using model fit are = 0.10 0.01 M⊙ and = 15.9 0.1 days. The photospheric velocity around the bolometric maximum is estimated as = 16000 1000 km s-1 (see Section 4.1). Using equations (1) and (2), the values of and are estimated as 4.50 0.33 M⊙ and 6.87 1051 erg, respectively. The best-fit model is shown in Figure 7.
In order to verify the consistency of the derived parameters, the observed bolometric light curve (optical + Swift UV) is also fit with the analytical model proposed by Vinkó et al. (2004). Similar to the Arnett-Valenti model, this model has also several assumptions e.g. homologous expansion of the ejecta, spherical symmetric explosion and constant opacity etc. This model is applicable only during the post-maximum phase. We used their model C which assumes a core-shell density structure with a constant density core of fractional radius (), and density of the surrounding shell decreasing outward as a power law with exponent . With a fixed (= 0.15), the best fit (Fig. 7) physical explosion parameters are = 0.12 0.01 M⊙, = 4.3 0.2 M⊙ and = 7.0 1.3 1051 erg. , , -ray opacity (), positron opacity (), and were kept as free parameters for the fitting. The explosion parameters estimated by both methods are mutually consistent.
It should be noted that no correction has been applied for the missing flux in the IR-bands. Near-infrared (NIR) flux contribution to the bolometric flux is found to be significant and varying with SN age, e.g. near the maximum brightness NIR contributes to 20 – 25% which increases to 40–50% one month later (Tomita et al., 2006; Valenti et al., 2008a; Cano et al., 2011). Including an NIR contribution of 20% in pre-maximum, 25% between 0 to +10 days and 31 to 45% between +10 to +35 days in the UV-optical bolometric light curve of ASASSN-16fp, both analytical models were re-fitted. The explosion parameters including the NIR are i.e. Arnett-Valenti model: = 0.15 0.01 M⊙, = 5.8 0.5 M⊙ and = 8.9 1.6 1051 erg and Vinkó model: = 0.15 0.01 M⊙, = 5.4 0.2 M⊙ and = 8.8 1.9 1051 erg.
4 Spectral analysis
In the following sections we present the spectral evolution of ASASSN-16fp, thanks to densely sampled spectroscopic data obtained during the photospheric phase (cf. Table 5). Spectral comparison with other well studied events at different epochs is also presented. The spectroscopic data of SN 2007gr used for comparison purpose in this study have been obtained with HCT and these are unpublished.
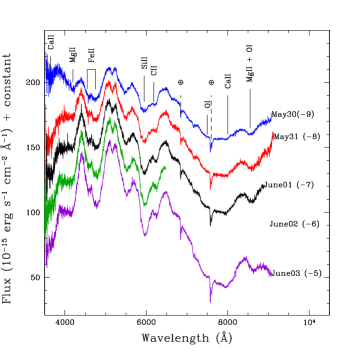
4.1 Pre-maximum spectral evolution
Supernova ASASSN-16fp was monitored extensively during the pre-maximum and early post-maximum phases. The spectral evolution during the pre-maximum phase is presented in Figure 8. The first spectrum obtained at –9 d shows a blue continuum, with well developed features due to Ca ii H & K, Mg ii, Fe ii, O i, Ca ii NIR triplet. The features due to various species are broad, indicating high expansion velocity of the ejecta. The pre-maximum spectra of ASASSN-16fp also show a shallow absorption at 5150 Å, and broad absorptions at 5500, 6000 and 6250 Å . The shallow absorption at 5150 Å was also noticed in the spectrum of SN 2004aw obtained around maximum light (Taubenberger et al., 2006), which was unidentified. The absorption at 6000 Å can be associated with Si ii 6355Å (Foley et al., 2003; Valenti et al., 2008a; Hunter et al., 2009; Sahu et al., 2009; Pignata et al., 2011; Drout et al., 2016). The absorption blue-ward of Si ii line has been identified with Na i possibly contaminated by He i in other BL-Ic SNe (Pandey et al., 2003; Valenti et al., 2008a; Hunter et al., 2009; Sahu et al., 2009).
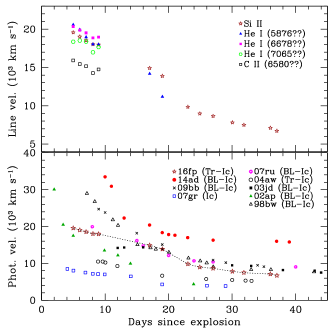
The absorption feature at 6250 Å redward of Si ii 6355Å is prominently seen in the pre-maximum spectra obtained till d. The next spectrum taken at +2 d shows only a small kink and beyond that the feature is not seen. This absorption feature was also detected in the early-phase spectrum of SN 2007gr (Valenti et al., 2008b), SN 2004aw (Taubenberger et al., 2006) and SN 2013ge (Drout et al., 2016). In SN 2004aw and SN 2013ge its possible association with C ii 6580 Å has been indicated. In some other cases this line has also been identified with He i 6678 Å line. It is argued by Valenti et al. (2008b) that due to increased diffusion of -rays with time (Mazzali & Lucy, 1998), the intensity of lines due to He i is expected to increase. The fact that this line was seen in the pre-maximum spectra of SN 2007gr and disappeared in the spectra taken close to maximum, led them to identify this line as C ii 6580 Å . They have confirmed detection of carbon by identifying C ii 7234 Å in the early phase optical spectra of SN 2007gr and strong C i line (at 8335, 9094 and 9405 Å ) in the optical and (at 10400 Å ) NIR spectrum at around two weeks past -maximum. As the expected position of C ii 7234 Å line in ASASSN-16fp is very close to the telluric absorption, it is difficult to identify this line. However, we do see a broad absorption around 9000 Å in the spectra of around two weeks after maximum light (see Section 4.2). It is suggested by Hunter et al. (2009) that the broad absorption seen 9000 Å in the spectrum of SN 2004aw and SN 2003jd may be due to blending of the C i lines (at 8335, 9094 and 9405 Å ). If the absorption redward to Si ii is identified with C ii 6580 Å the velocity estimated using this line is always found to be lower than the velocity measured using Si ii 6355 Å line (c.f. Figure 9, top panel).
In the early phase spectra, the absorption features at 5500, 6300 and 6850 Å are identified as He i (5876, 6678 and 7065 Å ) by Yamanaka et al. (2017) at an expansion velocity of 18000 km sec-1. Assuming this identification, the velocities estimated from our spectra are plotted in the top panel of Figure 9. It is evident from the figure that the velocities estimated using these lines match well with those inferred using the Si ii 6355 Å line. It is shown by Parrent et al. (2016) that ambiguity is always present in identifying the absorptions at 5500 Å with Na i and He i, at 6200 Å with Si ii and H i, at 6300 Å with C ii and He i. This degeneracy can partially be removed with the help of NIR spectra. Unfortunately, we do not have NIR spectra of ASASSN-16fp for a firm identification.
The Fe ii lines provide a good estimate of the photospheric velocity, but usually, these are blended. Therefore, Si ii 6355 Å line is considered as the tracer of the photospheric velocity of the ejecta (though, contamination of some ions may persist e.g. detached He i 6678 Å, detached C ii 6580 Å and detached Hα, see, Clocchiatti et al., 1996; Branch et al., 2006; Elmhamdi et al., 2006). We used Si ii line to estimate the photospheric velocity by fitting Gaussian profile to the absorption trough in the redshift corrected spectra. The resulting velocities of ASASSN-16fp along with other well observed SNe are over-plotted in Figure 9 (bottom panel). It is worth mentioning that among BL-Ic, SN 1998bw (GRB associated), 2002ap and 2014ad show very high expansion velocities (reaching around 30000 km s-1) few days after the explosion. In the post-maximum phase (20 d), the velocity dispersion is small and a majority of the BL-Ic events stay around 8000 km s-1. The photospheric velocity of ASASSN-16fp declined from 19500 km s-1 to 14000 km s-1 during 5 d to 20 d after the explosion and beyond 25 d, it flattens around 8000 km s-1. The photospheric velocities of SN 2004aw and SN 2007gr are low, and evolve at a slower rate as compared to BL-Ic. Among the sample presented here, the velocity of ASASSN-16fp lies between BL-Ic and Ic (normal and transitional) events.
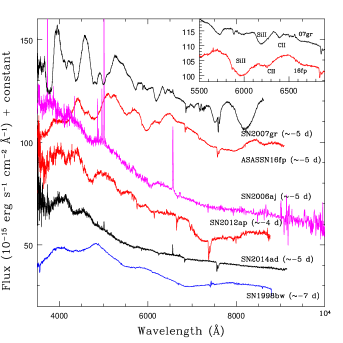
In Figure 10, the spectrum of ASASSN-16fp at –5 d is compared with the similar epoch spectra of other BL-Ic and Ic SNe. Though ASASSN-16fp has been classified as BL-Ic, the difference between the spectrum of ASASSN-16fp and other BL-Ic SNe is obvious. The spectra of other BL-Ic events, obtained –5 day, show just a few broad absorption features, superimposed on a blue continuum. In the spectrum of ASASSN-16fp, features due to various species are well developed and the continuum is relatively red. The spectral features of ASASSN-16fp appears to be broader than the normal Type Ic SN 2007gr and narrower than other BL-Ic SNe. However, because of the high expansion velocity of the ejecta, features of ASASSN-16fp are more blue-shifted and the O i and Ca ii NIR triplet are heavily blended. The O i and Ca ii NIR triplet are not developed in the spectra of SN 1998bw, SN 2006aj and SN 2014ad taken around the same epoch. The spectrum of SN 2002ap shows some signature of these lines at – 4 d.
4.2 Post-maximum spectral evolution
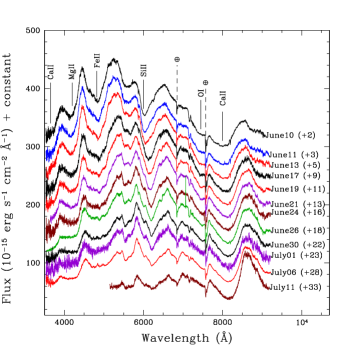
The post-maximum spectral evolution of ASASSN-16fp is displayed in Figure 11. It includes spectra obtained between +2 to +33 days relative to -band maximum. The spectral evolution during this phase is characterized by the presence of continuum and absorption troughs. The appearance of such features in the last spectrum presented here (+33 d) implies that the SN remained in the photospheric phase until then. Similar to the light curve, the spectral evolution is also found to be slow. Most of the features observed in the pre-maximum spectra continue to be present. The feature redward of Si ii 6355 Å line disappeared in the spectra obtained during the post-maximum phase. The Si ii 6355 Å absorption starts becoming narrow. The blending of O i with Ca ii NIR triplet reduces and by 30 days, both lines appear separated, though the O i line is contaminated by the telluric absorption. The blend of Fe ii lines (4924, 5018 and 5169 Å ) seen as broad absorption at 5000 Å in the pre-maximum spectra is getting resolved into its components. Similarly the absorption at 5500 Å, starts splitting possibly into He i and Na i. After +15 d, some new lines start appearing around the Si ii 6355 Å line, which have been identified by Parrent et al. (2016) as due to O i, Fe ii and Ne i (Valenti et al., 2008b). In the red part of the spectrum, the Ca ii NIR triplet is dominating the spectrum and progressively the emission component becomes stronger.
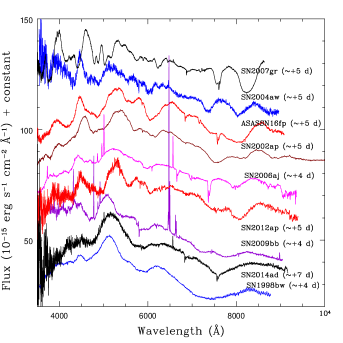
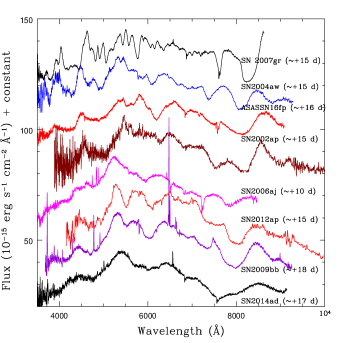
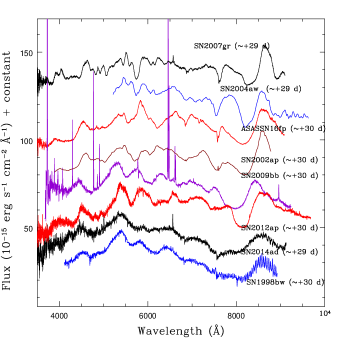
In Figures 12, 13 and 14 the post-maximum spectra of ASASSN-16fp obtained at +5 d, +15 d and +30 d have been compared with other well studied Type Ic and BL-Ic SNe. As ASASSN-16fp evolved, the difference between its spectra and other less energetic BL-Ic events reduces. The spectrum of ASASSN-16fp obtained at +5 day is overall very similar to the spectrum of SN 2002ap, SN 2009bb and SN 2012ap. All the spectral lines in ASASSN-16fp are broader than those in SN 2007gr and narrower than SN 1998bw and SN 2014ad. This trend continues until the last spectrum presented here. The features in the spectrum of ASASSN-16fp are better resolved than in other BL-Ic SNe and are marginally broader and blended than in SN 2004aw. The spectra of ASASSN-16fp at +15 d and +30 d continue to show the strong feature at 6300 Å identified with Si ii in the pre-maximum spectrum. In the spectra of other objects, the width and strength of this feature is relatively weak. The Na i line in the BL-Ic SNe +30 d shows broad absorption, while SN 2007gr and SN 2004aw show a sharp absorption feature. The width of Na i line in ASASSN-16fp seems to lie in between the BL-Ic and transitional Type Ic SN 2004aw.
5 Summary and conclusions
We have presented the results based on photometry (optical and Swift UV) and optical spectroscopy of the transitional Type Ic supernova ASASSN-16fp. The pre-maximum rise and early decline of the light curves are slow, making them broader in all the bands. There is no established co-relation between rise and decay time for SE-SNe. However, the light curve evolution of ASASSN-16fp follows a general trend of slow risers being also slow decliners (see, also Prentice et al., 2016).
The peak in -band is significantly delayed (7 d) with respect to -band maximum, which is found to be longer than the offset between and band maximum for Type Ic and BL-Ic SNe (c.f. Drout et al., 2011; Taddia et al., 2015). In case of SN 2004aw the delay was 8 d (Taubenberger et al., 2006). It is noticed that light curve evolution of ASASSN-16fp and transitional Ic SN 2004aw (Taubenberger et al., 2006) exhibit similarities in all bands (cf. Figure 3) including the similar m15 values in bands (see Section 3). In addition to ASASSN-16fp and SN 2004aw, there are just a handful of SE-SNe that have remarkably broad light curves with much longer rise times. The BL-Ic SN 1997ef (Iwamoto et al., 2000; Mazzali et al., 2004), normal Type Ic SN 2011bm (Valenti et al., 2012) and iPTF15dtg (Taddia et al., 2016) have a rise time of 35 d. The long rise time in these events suggests large ejecta mass, indicating massive Wolf-Rayet stars as their progenitor.
A combination of gradual cooling of the expanding ejecta and variation in the ionization states of different species result in flux change, which consequently appear in the form of temporal evolution of the colour. The colour evolution of SE-SNe shows large dispersion (cf. Figure 5). The slow evolution and relatively redder colour of ASASSN-16fp suggests low photospheric temperature and/or slower cooling rate of the ejecta. The absolute luminosity of SE-SNe also shows large variation, the BL-Ic are generally found to be brighter than the normal Ic events (c.f. Lyman et al., 2016; Prentice et al., 2016). The absolute -band luminosity of ASASSN-16fp lies towards the fainter end of the absolute luminosity distribution of BL-Ic SNe. Its luminosity is comparable to transitional Type Ic SN 2004aw and brighter than normal Type Ic SN 2007gr. A detailed discussion on the bulk photometric properties of SE SNe can be found elsewhere (e.g. Drout et al., 2011; Bianco et al., 2014; Taddia et al., 2015; Prentice et al., 2016). It appears that the light curve evolution pattern does not have direct impact on colour curves and absolute luminosity values. Nonetheless, such distribution points towards different progenitor channels and explosion mechanisms.
The spectral evolution of ASASSN-16fp exhibits a similarity with the transitional Type Ic SN 2004aw. The width of the spectral lines of ASASSN-16fp are intermediate between transitional Type Ic SN 2004aw and BL-Ic SN 2002ap (Gal-Yam et al., 2002; Mazzali et al., 2002; Foley et al., 2003). Most of the well developed spectral features were present in the first spectrum obtained –9 d and were found to evolve slowly. The initial photospheric velocity of ASASSN-16fp was moderately high (20000 km s-1), comparable to SN 2007ru at similar epochs. In the pre-maximum phase, C i lines were detected but with weaker strength than SN 2007gr.
Recently, Yamanaka et al. (2017) have presented their results on ASASSN-16fp. They have identified He i lines in their pre-maximum spectra and classified this event as broad-lined Type Ib SN. However, they also mentioned that in many respects ASASSN-16fp is similar to a BL-Ic SN (see their Section 3.1). The classification of SNe Ib and Ic (BL-Ic) is based on presence or absence of He i lines in their spectra, though it is debatable. Some theoretical models predict that progenitors of Ic SNe may contain helium (e.g., Dessart et al., 2012), but others argue in favor of helium-free SN Ic progenitors (e.g. Hachinger et al., 2012; Frey et al., 2013). In some of the Ic and BL-Ic SNe, He i lines have been detected e.g. SN 1994I (Clocchiatti et al., 1996), SN 2004aw (Taubenberger et al., 2006), SN 2009bb (Pignata et al., 2011) and SN 2012ap (Milisavljevic et al., 2015). In case of SN Ib, the strength of the He i lines increases with time (Mazzali & Lucy, 1998; Matheson et al., 2001). Yamanaka et al. (2017) have shown that around 15 d after explosion, the He i lines became very weak in ASASSN-16fp. The identification of He i 20587 Å in the NIR spectrum is another strong clue to confirm the presence of the helium (Taubenberger et al., 2006). A better follow-up of NIR spectrum along with non-LTE spectral codes (to properly treat non-thermal excitations) could help identify the helium features more robustly, shedding some light on evolutionary stages of massive stars (e.g. Yoon & Langer, 2005; Langer, 2012).
The light curve and spectral evolution of ASASSN-16fp indicate that it is a transitional Type Ic supernova (similar to SN 2004aw), having spectral properties between normal Type Ic and broad-lined Type Ic. The synthesized radioactive 56Ni powers the SN light curve. The 56Ni mass in BL-Ic/GRB-SNe is generally high (Drout et al., 2011; Cano, 2013; Lyman et al., 2016; Prentice et al., 2016), making them more luminous than other SE-SNe. However, it may also be possible that even if a similar amount of 56Ni is produced, the slow expanding SNe may be fainter (Cano, 2016). Furthermore, the location and degree of mixing of nickel will also affect the observational features. The occurrence of late peak and slow evolution of the light curve of ASASSN-16fp may possibly be due to the shallow distribution and deeply located 56Ni in the ejecta (see Piro & Nakar, 2013).
The explosion parameters of ASASSN-16fp were estimated by fitting Arnett-Valenti analytical model to the bolometric light curve (see Section 3.4). The derived value of mass of the ejecta () 4.5 0.3 M⊙ and kinetic energy () 6.9 1051 erg, are comparable to those of other BL-Ic events (Lyman et al., 2016). However, mass of 56Ni () 0.10 0.01 M⊙ for ASASSN-16fp is found to be lower than the median value estimated for BL-Ic SNe (Cano, 2013; Lyman et al., 2016). We also estimated physical parameters of ASASSN-16fp using Vinkó’s analytical model and the derived values were found to be consistent with those obtained from Arnett-Valenti model.
The observed diversity in Ic/BL-Ic SNe has been attributed to the asphericity of the ejecta and/or jet induced explosions (e.g. Khokhlov et al., 1999; Kawabata et al., 2002). The spectropolarimetric/polarimetric data will be helpful in constraining the geometry of the explosion. The spectral evolution during the nebular phase will reveal the deeper layers of the ejecta. The line profile in the nebular phase also provides clues about the geometry of the ejecta. Mazzali et al. (2005) suggested that double-peaked emission-line profiles of [O i] may be indicative of asymmetric geometry of the explosion. Such features have been found in many SNe (Maeda et al., 2008; Modjaz et al., 2008; Taubenberger et al., 2009; Milisavljevic et al., 2010). A critical analysis of the nebular phase spectra of ASASSN-16fp will be useful for understanding the observed properties in greater detail.
Acknowledgments
The authors thank the referee for his/her critical review and constructive suggestions that helped to improve the contents and presentation of the paper. BK acknowledges the Science and Engineering Research Board (SERB) under the Department of Science & Technology, Govt. of India, for financial assistance in the form of National Post-Doctoral Fellowship (Ref. No. PDF/2016/001563). We are grateful to the observers at HCT who provided their valuable time and support for the observations of this event. We thank T. P. Prabhu for various discussions during the preparation of this manuscript. We also acknowledge the Weizmann interactive supernova data repository - http://wiserep.weizmann.ac.il. This work has made use of the public data in the Swift data archive and the NASA/IPAC Extragalactic Database (NED) which is operated by Jet Propulsion Laboratory, California Institute of Technology, under contract with the National Aeronautics and Space Administration (NASA).
References
- Argo et al. (2016) Argo M. K., Romero-Canizales C., Beswick R., Prieto J. L., 2016, The Astronomer’s Telegram, 9147
- Arnett (1982) Arnett W. D., 1982, ApJ, 253, 785
- Arnett (1996) Arnett D., 1996, Supernovae and Nucleosynthesis: An Investigation of the History of Matter from the Big Bang to the Present. Princeton Univ. Press, Princeton, NJ
- Barbon et al. (1990) Barbon R., Benetti S., Rosino L., Cappellaro E., Turatto M., 1990, A&A, 237, 79
- Bessell et al. (1998) Bessell M. S., Castelli F., Plez B., 1998, A&A, 333, 231
- Bianco et al. (2014) Bianco F. B., et al., 2014, ApJS, 213, 19
- Branch et al. (2006) Branch D., Jeffery D. J., Young T. R., Baron E., 2006, PASP, 118, 791
- Brown et al. (2009) Brown P. J., et al., 2009, AJ, 137, 4517
- Cano (2013) Cano Z., 2013, MNRAS, 434, 1098
- Cano (2016) Cano Z., 2016, LPI Contributions, 1962, 4116
- Cano et al. (2011) Cano Z., et al., 2011, ApJ, 740, 41
- Chugai (2000) Chugai N. N., 2000, Astronomy Letters, 26, 797
- Clocchiatti & Wheeler (1997) Clocchiatti A., Wheeler J. C., 1997, ApJ, 491, 375
- Clocchiatti et al. (1996) Clocchiatti A., Wheeler J. C., Brotherton M. S., Cochran A. L., Wills D., Barker E. S., Turatto M., 1996, ApJ, 462, 462
- Clocchiatti et al. (2011) Clocchiatti A., Suntzeff N. B., Covarrubias R., Candia P., 2011, AJ, 141, 163
- Dessart et al. (2012) Dessart L., Hillier D. J., Li C., Woosley S., 2012, MNRAS, 424, 2139
- Dessart et al. (2016) Dessart L., Hillier D. J., Woosley S., Livne E., Waldman R., Yoon S.-C., Langer N., 2016, MNRAS, 458, 1618
- Drout et al. (2011) Drout M. R., et al., 2011, ApJ, 741, 97
- Drout et al. (2016) Drout M. R., et al., 2016, ApJ, 821, 57
- Elias-Rosa et al. (2016) Elias-Rosa N., et al., 2016, The Astronomer’s Telegram, 9090
- Elmhamdi et al. (2006) Elmhamdi A., Danziger I. J., Branch D., Leibundgut B., Baron E., Kirshner R. P., 2006, A&A, 450, 305
- Filippenko (1997) Filippenko A. V., 1997, ARA&A, 35, 309
- Foley et al. (2003) Foley R. J., et al., 2003, PASP, 115, 1220
- Frey et al. (2013) Frey L. H., Fryer C. L., Young P. A., 2013, ApJ, 773, L7
- Gal-Yam et al. (2002) Gal-Yam A., Ofek E. O., Shemmer O., 2002, MNRAS, 332, L73
- Galama et al. (1998) Galama T. J., et al., 1998, Nature, 395, 670
- Grupe et al. (2016) Grupe D., Brown P., Dong S., Shappee B. J., Holoien T., Stanek K., Prieto J. L., Margutti R., 2016, The Astronomer’s Telegram, 9088
- Hachinger et al. (2012) Hachinger S., Mazzali P. A., Taubenberger S., Hillebrandt W., Nomoto K., Sauer D. N., 2012, MNRAS, 422, 70
- Heger et al. (2003) Heger A., Fryer C. L., Woosley S. E., Langer N., Hartmann D. H., 2003, ApJ, 591, 288
- Holoien et al. (2016) Holoien T. W.-S., et al., 2016, The Astronomer’s Telegram, 9086
- Hunter et al. (2009) Hunter D. J., et al., 2009, A&A, 508, 371
- Iwamoto et al. (1998) Iwamoto K., et al., 1998, Nature, 395, 672
- Iwamoto et al. (2000) Iwamoto K., et al., 2000, ApJ, 534, 660
- Kawabata et al. (2002) Kawabata K. S., et al., 2002, ApJ, 580, L39
- Khokhlov et al. (1999) Khokhlov A. M., Höflich P. A., Oran E. S., Wheeler J. C., Wang L., Chtchelkanova A. Y., 1999, ApJ, 524, L107
- Landolt (1992) Landolt A. U., 1992, AJ, 104, 340
- Langer (2012) Langer N., 2012, ARA&A, 50, 107
- Liu et al. (2016) Liu Y.-Q., Modjaz M., Bianco F. B., Graur O., 2016, ApJ, 827, 90
- Lyman et al. (2016) Lyman J. D., Bersier D., James P. A., Mazzali P. A., Eldridge J. J., Fraser M., Pian E., 2016, MNRAS, 457, 328
- Maeda et al. (2008) Maeda K., et al., 2008, Science, 319, 1220
- Matheson et al. (2001) Matheson T., Filippenko A. V., Li W., Leonard D. C., Shields J. C., 2001, AJ, 121, 1648
- Mazzali & Lucy (1998) Mazzali P. A., Lucy L. B., 1998, MNRAS, 295, 428
- Mazzali et al. (2000) Mazzali P. A., Iwamoto K., Nomoto K., 2000, ApJ, 545, 407
- Mazzali et al. (2002) Mazzali P. A., et al., 2002, ApJ, 572, L61
- Mazzali et al. (2004) Mazzali P. A., Deng J., Maeda K., Nomoto K., Filippenko A. V., Matheson T., 2004, ApJ, 614, 858
- Mazzali et al. (2005) Mazzali P. A., et al., 2005, Science, 308, 1284
- Milisavljevic et al. (2010) Milisavljevic D., Fesen R. A., Gerardy C. L., Kirshner R. P., Challis P., 2010, ApJ, 709, 1343
- Milisavljevic et al. (2015) Milisavljevic D., et al., 2015, ApJ, 799, 51
- Minkowski (1941) Minkowski R., 1941, PASP, 53, 224
- Mirabal et al. (2006) Mirabal N., Halpern J. P., An D., Thorstensen J. R., Terndrup D. M., 2006, ApJ, 643, L99
- Modjaz et al. (2008) Modjaz M., Kirshner R. P., Blondin S., Challis P., Matheson T., 2008, ApJ, 687, L9
- Modjaz et al. (2014) Modjaz M., et al., 2014, AJ, 147, 99
- Mooley et al. (2016) Mooley K. P., et al., 2016, The Astronomer’s Telegram, 9134
- Nayana & Chandra (2016) Nayana A. J., Chandra P., 2016, The Astronomer’s Telegram, 9201
- Olivares E. et al. (2012) Olivares E. F., et al., 2012, A&A, 539, A76
- Pandey et al. (2003) Pandey S. B., Anupama G. C., Sagar R., Bhattacharya D., Sahu D. K., Pandey J. C., 2003, MNRAS, 340, 375
- Parrent et al. (2016) Parrent J. T., Milisavljevic D., Soderberg A. M., Parthasarathy M., 2016, ApJ, 820, 75
- Patat et al. (2001) Patat F., et al., 2001, ApJ, 555, 900
- Pian et al. (2006) Pian E., et al., 2006, Nature, 442, 1011
- Pignata et al. (2011) Pignata G., et al., 2011, ApJ, 728, 14
- Piro & Nakar (2013) Piro A. L., Nakar E., 2013, ApJ, 769, 67
- Podsiadlowski et al. (1992) Podsiadlowski P., Joss P. C., Hsu J. J. L., 1992, ApJ, 391, 246
- Poole et al. (2008) Poole T. S., et al., 2008, MNRAS, 383, 627
- Poznanski et al. (2011) Poznanski D., Ganeshalingam M., Silverman J. M., Filippenko A. V., 2011, MNRAS, 415, L81
- Prentice et al. (2016) Prentice S. J., et al., 2016, MNRAS, 458, 2973
- Pritchard et al. (2014) Pritchard T. A., Roming P. W. A., Brown P. J., Bayless A. J., Frey L. H., 2014, ApJ, 787, 157
- Puls et al. (2008) Puls J., Vink J. S., Najarro F., 2008, A&A Rev., 16, 209
- Richardson et al. (2006) Richardson D., Branch D., Baron E., 2006, AJ, 131, 2233
- Richardson et al. (2014) Richardson D., Jenkins III R. L., Wright J., Maddox L., 2014, AJ, 147, 118
- Sahu et al. (2009) Sahu D. K., Tanaka M., Anupama G. C., Gurugubelli U. K., Nomoto K., 2009, ApJ, 697, 676
- Sahu et al. (2017) Sahu D. K., et al. 2017, MNRAS, submitted
- Schlafly & Finkbeiner (2011) Schlafly E. F., Finkbeiner D. P., 2011, ApJ, 737, 103
- Smartt (2009) Smartt S. J., 2009, ARA&A, 47, 63
- Smith & Owocki (2006) Smith N., Owocki S. P., 2006, ApJ, 645, L45
- Sollerman et al. (2006) Sollerman J., et al., 2006, A&A, 454, 503
- Stalin et al. (2008) Stalin C. S., Hegde M., Sahu D. K., Parihar P. S., Anupama G. C., Bhatt B. C., Prabhu T. P., 2008, in Astron. Soc. India Conf. Ser., 36, 111
- Stetson (1987) Stetson P. B., 1987, PASP, 99, 191
- Stetson (1992) Stetson P. B., 1992, in Worrall D. M., Biemesderfer C., Barnes J., eds, ASP Conf. Ser. Vol. 25, Astronomical Data Analysis Software and Systems I. Astron. Soc. Pac., San Francisco. p. 297
- Taddia et al. (2015) Taddia F., et al., 2015, A&A, 574, A60
- Taddia et al. (2016) Taddia F., et al., 2016, A&A, 592, A89
- Taubenberger et al. (2006) Taubenberger S., et al., 2006, MNRAS, 371, 1459
- Taubenberger et al. (2009) Taubenberger S., et al., 2009, MNRAS, 397, 677
- Tomita et al. (2006) Tomita H., et al., 2006, ApJ, 644, 400
- Toy et al. (2016) Toy V. L., et al., 2016, ApJ, 818, 79
- Turatto et al. (2003) Turatto M., Benetti S., Cappellaro E., 2003, in Hillebrandt W., Leibundgut B., eds, Proc. ESO-MPA-MPE Workshop, From Twilight to Highlight: The Physics of Supernovae. Springer, Berlin, p. 200.
- Valenti et al. (2008a) Valenti S., et al., 2008a, MNRAS, 383, 1485
- Valenti et al. (2008b) Valenti S., et al., 2008b, ApJ, 673, L155
- Valenti et al. (2012) Valenti S., et al., 2012, ApJ, 749, L28
- Vinkó et al. (2004) Vinkó J., et al., 2004, A&A, 427, 453
- Wheeler & Levreault (1985) Wheeler J. C., Levreault R., 1985, ApJ, 294, L17
- Woosley & Weaver (1986) Woosley S. E., Weaver T. A., 1986, ARA&A, 24, 205
- Yamanaka et al. (2016) Yamanaka M., et al., 2016, The Astronomer’s Telegram, 9124
- Yamanaka et al. (2017) Yamanaka M., et al., 2017, ApJ, 837, 1
- Yoon & Langer (2005) Yoon S.-C., Langer N., 2005, A&A, 443, 643
- Yoon et al. (2010) Yoon S.-C., Woosley S. E., Langer N., 2010, ApJ, 725, 940
- Yoshii et al. (2003) Yoshii Y., et al., 2003, ApJ, 592, 467