Service Providers of the Sharing Economy: Who Joins and Who Benefits?
Abstract.
Many “sharing economy” platforms, such as Uber and Airbnb, have become increasingly popular, providing consumers with more choices and suppliers a chance to make profit. They, however, have also brought about emerging issues regarding regulation, tax obligation, and impact on urban environment, and have generated heated debates from various interest groups. Empirical studies regarding these issues are limited, partly due to the unavailability of relevant data. Here we aim to understand service providers of the sharing economy, investigating who joins and who benefits, using the Airbnb market in the United States as a case study. We link more than 211 thousand Airbnb listings owned by 188 thousand hosts with demographic, socio-economic status (SES), housing, and tourism characteristics. We show that income and education are consistently the two most influential factors that are linked to the joining of Airbnb, regardless of the form of participation or year. Areas with lower median household income, or higher fraction of residents who have Bachelor’s and higher degrees, tend to have more hosts. However, when considering the performance of listings, as measured by number of newly received reviews, we find that income has a positive effect for entire-home listings; listings located in areas with higher median household income tend to have more new reviews. Our findings demonstrate empirically that the disadvantage of SES-disadvantaged areas and the advantage of SES-advantaged areas may be present in the sharing economy.
1. Introduction
Online peer-to-peer marketplaces, such as Uber, Airbnb, and TaskRabbit, connect sellers with buyers through the exchange of goods or services (Azevedo and Weyl, 2016; Einav et al., 2016; Luca, 2016). Widely referred to as examples of the “sharing economy” (Cusumano, 2015; Malhotra and Alstyne, 2014), they provide suppliers with new sources of income and consumers diverse choices of products, and have become increasingly important in the digital economy. They have also brought about emerging issues such as regulation, tax obligation, and impact on neighborhood. Although there have been intense debates from various interest groups on these issues, empirical studies are limited, partly due to the unavailability of relevant data, impeding timely evidence-based policy making.
In this work, we bring empirical data to bear on a key issue—service providers—in the current debates around the sharing economy. Service providers are, for example, driver-partners who provide ride-sharing services on Uber, or hosts who provide accommodations on Airbnb, or “taskers” who provide labors to do the errand on TaskRabbit. Recent years have seen an exponential growth of the number of service providers in sharing economy markets (e.g., Uber (Hall and Krueger, 2016) and Airbnb (Ke, 2017)). Such fast growth may be because participation in these markets has the potential to generate new sources of income. Another reason may be that online markets offer service providers a great flexibility, in the sense that they could decide when to work, work for how long, and which task request to accept, etc. A recent study showed that flexible work schedules make Uber drivers earn more than twice compared to traditional work arrangements (Chen et al., 2017).
Understanding service providers in the sharing economy has interested researchers across many disciplines. A great effort has been put into the analysis of demographics, such as age, gender, and race (Hall and Krueger, 2016; Kooti et al., 2017), as well as the demonstration of the existence of a gender gap (Kricheli-Katz and Regev, 2016) and of gender and racial bias and discrimination in online marketplaces (Edelman and Luca, 2014; Hannák et al., 2017). Despite these efforts, our understanding is still limited by the lack of empirical and large-scale analysis on the social-economic status aspect. This work contributes to the understanding of service providers of the sharing economy by studying how social-economic status (SES) affects the participation in and benefit from the sharing economy. In particular, we aim to answer the following research questions:
-
(1)
RQ1: How are SES characteristics associated with service providers of the sharing economy? Does such association vary across different forms of sharing (e.g., entire home vs. private room)?
-
(2)
RQ2: How does the association change over time?
-
(3)
RQ3: How are SES characteristics associated with service providers who actually benefit from the sharing economy?
Here as a first step, we focus on Airbnb hosts in the United States as a case study. This is based on two reasons. First, although Airbnb is a pioneering example of the sharing economy, there have been few empirical studies about its service providers. Second, currently US is Airbnb’s largest market (Ke, 2017), and extensive SES and other characteristics data are available, allowing us to approach our questions systematically.
Our research questions are important due to several theoretical and practical reasons. First, participation in the sharing economy may be more appealing to people with lower-income than to richer ones, as it may provide potential revenue stream. Several studies have already pointed out that monetary compensation is one of the main motivations for participation in the sharing economy (Lampinen and Cheshire, 2016; Ikkala and Lampinen, 2015; Teodoro et al., 2014). Second, many sharing economy platforms greatly reduce the costs associated with joining the markets. For instance, they have provided a system to make the payment safe, have verified registered customers, and have made it easy for would-be workers to join the platform. Therefore, they may attract workers from across the income spectrum. Third, there are still entry barriers to participate, such as having an underutilized room located in a neighborhood where would-be guests are willing come, and having the ability to deal with issues involved in managing listings. Therefore, certain groups of individuals may not afford becoming a host. Fourth, heterogeneous housing characteristics, such as location and decoration, together with the existence of racial discrimination on Airbnb as demonstrated recently (Edelman and Luca, 2014; Edelman et al., 2017), may make some listings more profitable, while others not, which may affect the joining of Airbnb. On the practical side, Airbnb has repeatedly claimed that it has been employed mainly by lower-income residents as their revenue supplement, which is yet to be verified.
To answer our research questions, we use data crawled from Airbnb between May and August, and employ standard regression methods to control for other characteristics, such as housing and attractiveness. Our modeling results show that after controlling for demographic, housing, and attractiveness characteristics, income has a strong negative effect on the participation in Airbnb; areas with lower median household income tend to have more hosts. We also find that education is another influential factor; areas where there are a larger portion of residents with higher education degrees are associated with more hosts. However, when we consider the performance of listings, as measured by the number of newly received reviews, we find that income has a positive effect on entire-home listings, even after controlling for listing- and host-level characteristics. This means that entire-home listings located in areas with higher income tend to have more new reviews. Our findings therefore may suggest the disadvantage of SES-disadvantaged areas and the advantage of SES-advantaged areas.
2. Related Work
In this section, we set the context for our work. First, we present existing work analyzing service providers of the sharing economy. We then briefly overview general analysis on sharing economy platforms.
2.1. Analysis of Service Providers
The question of why service providers join sharing economy platforms has been one focus of several studies. An early work by Teodoro et al. used interviews to understand the motivations behind becoming workers on Gigwalk and TaskRabbit (Teodoro et al., 2014). Later studies focused on other markets, such as Uber (Lee et al., 2015) and Airbnb (Ikkala and Lampinen, 2015; Lampinen and Cheshire, 2016). All these studies have pointed out that monetary compensation is one of the main motivations for participation in the sharing economy. This finding plays a major role in motivating our work presented here.
Another line of work has focused on potential issues and challenges associated with being service providers. First, one requirement for service providers is to establish trust, because it is a key prerequisite for many online markets (Luca, 2016). Ma et al. examined self-descriptions of Airbnb hosts on their profiles and how they are related to perceived trustworthiness (Ma et al., 2017). Second, certain groups of service providers may be faced with discriminations. On Airbnb, black hosts charged less than non-black hosts for the equivalent rental (Edelman and Luca, 2014). On eBay, women sellers received a smaller number of bids and lower prices for the same product (Kricheli-Katz and Regev, 2016). On TaskRabbit, workers’ gender and race were correlated with their evaluations such as reviews and ratings (Hannák et al., 2017).
One closely related thread of research is recent work that started to ask the question of who service providers of the sharing economy are. These works have focused on the demographic perspective. Hall and Krueger, for example, presented a comprehensive analysis of Uber’s active driver-partners in the US and found that their age and education are similar to the general workforce (Hall and Krueger, 2016). Using email receipt data, Kooti et al. also examined demographics of Uber drivers (Kooti et al., 2017). In contrast to these work, our work here only not focuses on Airbnb, a primary yet less studied example of the sharing economy, but also emphasizes the SES aspect.
Regarding the SES perspective, although there are some discussions (Dillahunt et al., 2016) and participatory-design based studies (Dillahunt and Malone, 2015) on how sharing economy platforms can benefit low-income service providers, we still lack a quantitative and large-scale empirical analysis.
The SES of geographic areas where the service will be performed is also a factor. A study by Thebault-Spieker et al. found that task requests from the low-SES south side of the Chicago metropolitan area were less likely to be accepted by TaskRabbit workers (Thebault-Spieker et al., 2015).
2.2. General Analysis of Sharing Economy Platforms
A relatively dearth of work has considered analysis on different aspects of online markets. Using email receipt data about Uber rides, Kooti et al. found that, among others, homophilous matches between riders and drivers contributed to higher ratings of drivers and that an accurate prediction of which riders or drivers will become active Uber users can be obtained using early rides information (Kooti et al., 2017). Chen et al. investigated Uber’s surge pricing algorithm and reported the existence of short-lived spikes of “surge multiplier” (Chen et al., 2015).
Focusing on Airbnb, Ke presented a comprehensive statistical analysis of listings on the entire Airbnb market and investigated factors related to listings’ success (Ke, 2017). An important conclusion from that study is the prevalence of commercial hosts who own multiple listings on Airbnb (Ke, 2017). This has motivated us to exclude those hosts from our analysis. Quattrone et al., studied how geographic and demographic characteristics contributed to the grow of Airbnb in London (Quattrone et al., 2016).
3. The Airbnb Platform
Our empirical study is set in the context of Airbnb, an online marketplace for accommodation. Here we briefly describe how Airbnb works. Founded in , Airbnb allows hosts to rent their underutilized rooms to guests. To become a host, one can sign up as a host and then set up their listing by filling out description, uploading photos, and setting a price and the calendar. A listing can be one of three types of rooms, namely entire home, private room, and shared room. Guests can find out listings mainly through Airbnb’s search engine and request to book the listing they intend to stay. After the conclusion of stays, both hosts and guests can review and rate each other. However, reviews and ratings are simultaneously revealed to avoid retaliation.
4. Data and Methods
4.1. Airbnb Data
We obtain the Airbnb data directly from a previous work (Ke, 2017). Here we briefly describe the data collection process, and refer to the original study for more details (Ke, 2017). Our data was crawled from the Airbnb website. At the time of the crawl, Airbnb provided site maps with links to web pages of search results of listings in all regions within countries that were covered by the service. The crawling process first repeatedly queried those search result pages to accumulate listings and then visited the web page of each listing to obtain relevant information (e.g., host, ratings, and reviews). A large fraction of listings was visited for three times during May and August, , therefore we know how certain information such as ratings and number of reviews change over time. This allows us to study the performances of listings presented in § 5.3.
Overall, the data collection process resulted in more than million listings—a number comparable to the official one as of the time data were collected—on the entire Airbnb platform. Among them, () are located in the US, making it the largest Airbnb market in the world.
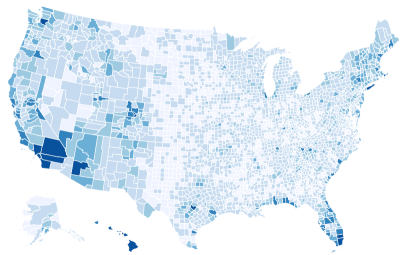
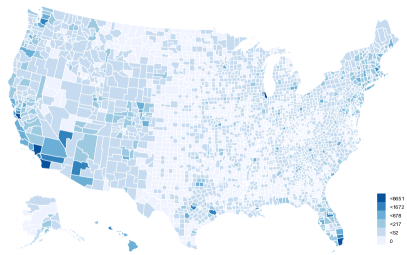
To explore geolocations of listings, Fig. 1 displays the number of entire home listings (left) and private and shared room listings (right) in each county. Listings are heavily located along the east and west coast, and there are many mid-west counties without any listings.
| Total | This analysis | |
|---|---|---|
| Listings | () | |
| Hosts | () |
4.1.1. Exclusion of Commercial Hosts
A key feature of many online peer-to-peer markets is that on their supply side, there are not only ordinary players who, in the context of Airbnb, rent out their apartments, but also commercial hosts who operate business on the platform. Commercial hosts, also referred to as professional hosts, are often identified as those who own multiple listings on Airbnb. Currently they are amid the focuses of the ongoing debates and one of the main targets of regulations in many cities. They are, however, not the main subjects of our study, as we are interested in how SES of local residents affect their joining in Airbnb. We therefore need to exclude commercial hosts from our analysis.
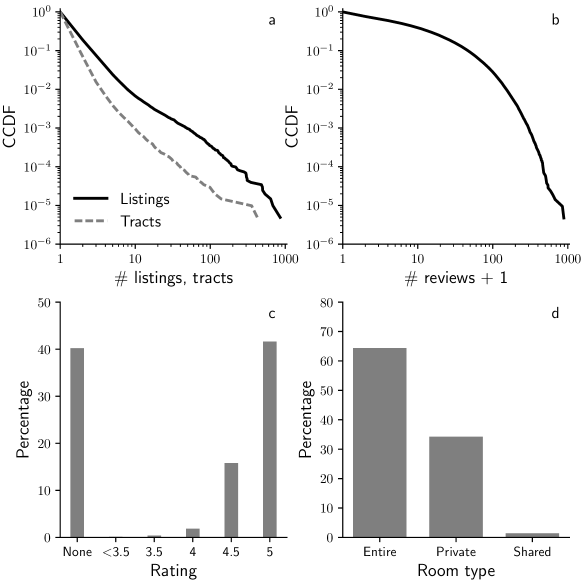
To demonstrate the existence of commercial hosts, we show in Fig. 2(a) the survival distribution of the number of listings owned by a host and the number of unique census tracts (CT, a geographic region, cf. § 4.2.1) where these listings are located. We clearly see heavy-tailed distributions; among the hosts in total, () and () of them own one and two listings, respectively, the remaining hosts own listings, and one host even has listings. The number of CTs where a host’s listings are located can reach . These results, consistent with previous observations focusing on the global scale (Ke, 2017), indicate the existence of commercial hosts.
Based on this observation, we exclude hosts who have more than two listings and exclude their listings before further analysis. In this way, we are still able to include a majority () of hosts who are most likely to be ordinary residents rather than commercial operators. After the exclusion, there are only () hosts whose listings are located in two different CTs. Table 1 summaries basic statistics of our dataset.
4.1.2. Listing Characteristics
We then present a basic summary of listing characteristics. Figure 2(b) shows the heterogeneously distributed number of reviews across listings. The mean (median) number of reviews received by a listing is (). Figure 2(c) demonstrates a bimodal distribution of ratings. There are roughly the same number of no-rating listings and five-star listings, while listings with low ratings rarely exist on the market. Figure 2(d) shows that more than of listings are entire homes.
4.2. Dependent Variables
We now introduce the dependent variables and show their distributions.
4.2.1. RQ1
RQ1 asks how SES characteristics are associated with service providers who provide accommodations on the Airbnb platform. The ideal unit of analysis is individual. This is, however, unrealistic, because doing so would not only require detailed individual SES data that are difficult to obtain but also raise privacy concerns.
We choose to perform our analysis at the census tract (CT) level.111https://www.census.gov/geo/reference/gtc/gtc_ct.html CT is a geographic region within a county and specifically designed to present statistical data such as median household income that shall be used extensively in our study. The primary advantage of CT is that it is a small, relatively homogeneous, and stable geographic area, which allows for statistical comparisons between different censuses. By focusing on the CT level, we are making two assumptions: (1) hosts are local residents of the CT where their listings are located; and (2) the SES characteristics of a CT is representative of its residents.
The dependent variable for RQ1 is then the number of unique hosts in a CT. To obtain the number, we map each US listing to the CT it is located, using its latitude and longitude information and the Geocoder API222https://geocoding.geo.census.gov/geocoder/ provided by the US Census Bureau.
Since Airbnb distinguishes between different types of rooms, we also investigate variations among rooms types by looking at the number of hosts of entire rooms and of private and shared rooms. In summary, we use three dependent variables for RQ1: (1) number of unique hosts, (2) number of unique hosts of entire home listings, and (3) number of unique hosts of private and shared rooms.
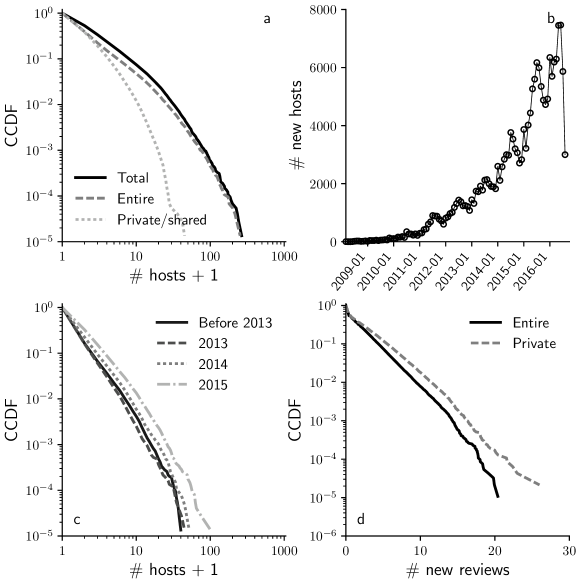
Figure 3(a), which shows the survival distributions of the three variables, suggests that Airbnb has heterogeneous popularities among CTs. The mean (median) number of hosts in a CT is (), and the maximum number is less than . By contrast, the average total population in a CT is , suggesting that the overall adoption rate of Airbnb is not high.
4.2.2. RQ2
| Variable | Definition | Source | Mean | Median |
| Total population | S0101 | |||
| Fraction of residents aged between – | S0101 | |||
| Fraction of non-white residents | B02001 | |||
| Fraction of foreign-born residents | B05003 | |||
| Median household income | S1903 | |||
| Fraction of 25+ years old residents with | B15003 | |||
| Bachelor’s and higher degree | ||||
| Employment rate | B23025 | |||
| Fraction of employed residents working in arts, | S2404 | |||
| entertainment, etc | ||||
| Fraction of owner-occupied housing units | B25003 | |||
| Median price of housing units occupied by owner | B25077 | |||
| Median rent of housing units occupied by renter | B25064 | |||
| Number of hotels | OSM | |||
| Number of attractions, retails, bars, and | OSM | |||
| restaurants, etc |
Note: For the source column, OSM means OpenStreetMap and for all others, we show the Table IDs used to retrieve corresponding data from the American FactFinder website.
RQ2 asks how the impact of SES factors on participation in the sharing economy changes over time. To introduce dependent variables, we first show in Fig. 3(b) the number of newly joined hosts in each month from March, to August, . We see that Airbnb has experienced rapid growth since around year . As we only have partial data for , we exclude them when answering RQ2 and divide the entire – period into four periods, namely, before , , , and . The number of hosts for each period are as follows: before : ; : ; : ; and : . The dependent variables are the number of newly joined hosts in each period. Figure 3(c) shows the distribution of the number of unique hosts in a CT for each period.
For both RQ1 and RQ2, we use negative binomial model, since the number of unique hosts is a count variable.
4.2.3. RQ3
So far, we have only considered who participate in the sharing economy. However, not all listings are equally profitable, corroborated by the heterogeneous distribution of the number of reviews across listings (Fig. 2(b)). RQ3 asks who actually benefit from the sharing economy. A straightforward measure of such benefit is the amount of revenues generated by renting out listings. The calculation of revenues, however, requires not only the proprietary listing occupancy data, but also historical price information that are hard to obtain. Another measure could be the number of reviews a listing has already received. This is also related to many time-evolving factors that we have not observed, e.g., when a host became a superhost, a special type of host who satisfies a series of requirements.
To answer RQ3, we take advantage of the fact that the dataset contains three snapshots of Airbnb listings. We then measure the performance as the number of new reviews received between the first and third snapshots, and use it as the dependent variable. As the number of days between the two snapshots varies across listings, we further normalize performance into the number of new reviews in a month, treating it as a continuous variable. We then regress performance on the independent variables measured at the first snapshot using ordinary least squares (OLS) regression.
Figure 3(d) shows the distribution of monthly new reviews of entire home listings and private room listings.
4.3. Independent Variables
We now describe the list of independent variables used in our study. To understand how SES factors are associated with the participation in the sharing economy, we need to control for other factors such as demographics, housing, and attractiveness. We rely on two sources—American Community Survey (ACS) and OpenStreetMap (OSM)—to obtain these independent variables. Table 2 lists all these variables used in our analysis and their basic statistics. Below we describe them in detail.
4.3.1. Demographic, SES, and Housing Variables
We collect demographic, SES, and housing variables about CTs from the – -Year Estimates of American Community Survey (ACS). These data are directly accessible through the American FactFinder website at https://factfinder.census.gov by providing Table IDs. To improve reproducibility, the “Source” column in Table 2 lists the Table IDs that were used to retrieve these variables from the website.
We include four variables characterizing the demographic features of a CT. They are: (1) total population (), which accounts for the effect that populous CTs tend to have more hosts by pure chance, (2) fraction of residents whose age is between and (), (3) fraction of non-white residents (), which is included based on previous results showing discrimination in online markets (Edelman and Luca, 2014; Hannák et al., 2017; Kricheli-Katz and Regev, 2016), and (4) fraction of foreign-born residents ().
SES measures are often based on income, education, and occupation. We include four variables into our analysis: (1) median household income (), which has been shown to be one factor in joining various platforms (Teodoro et al., 2014; Lee et al., 2015; Ikkala and Lampinen, 2015; Lampinen and Cheshire, 2016), (2) fraction of 25+ years old residents with Bachelor’s or higher degrees (), (3) employment rate (), and (4) fraction of employed residents working in arts, entertainment, and other tourism-related industries ().
We include three variables characterizing housing conditions in a CT. They are (1) fraction of owner-occupied housing units (), (2) median price of housing units occupied by owner (), and (3) median rent of housing units occupied by renter ().
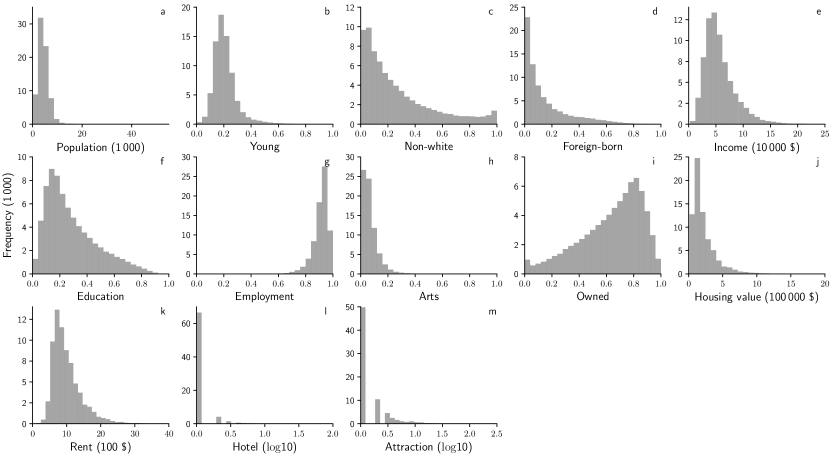
Figures 4(a)–(k) show the distributions of these variables. As we can see, they are not extremely heavily-tailed, since they are statistics of summary statistics in a CT.
4.3.2. Tourism Variables
As the attractiveness of a CT may also impact its residents’ tendency to join Airbnb, we need to control for such attractiveness. Furthermore, Airbnb has claimed that listings are located outside main hotel areas. To test the claim and to study how Airbnb listing locations are different from hotel locations, we collect hotel and attraction data from OpenStreetMap (OSM). In particular, we use OSM Overpass API333http://wiki.openstreetmap.org/wiki/Overpass_API and make queries, for each state, using its bounding box and the querying tags. For hotel data, we use the following tags: “tourism=hotel”, “tourism=hostel”, “tourism=motel”, and “building=hotel”; and for attraction data: “tourism=aquarium”, “tourism=artwork”, “tourism=attraction”, “tourism=museum”, “tourism=zoo”, “building=retail”, “amenity=bar”, and “amenity=restaurant”. We then map the set of returned hotels and attractions to CTs using the Geocoder API, and count the number of hotels and attractions in each CT, denoted as and , respectively. Figures 4(l)–(m) shows the distributions of the two variables. Most CTs do not have any hotels or attractions.
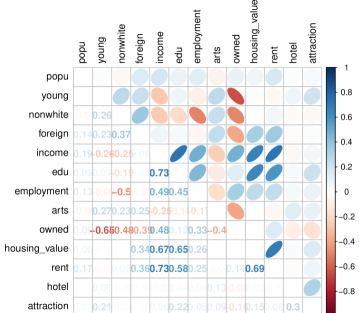
Figure 5 reports correlations between these independent variables. As expected, some of them are correlated, such as rent and income, and rent and housing value. For ease of interpretation and comparison across them, we standardize all independent variables.
5. Results
5.1. RQ1
| Dependent variable: Number of hosts | |||
| All | Entire home | Private/shared room | |
| (0.006) | (0.007) | (0.006) | |
| (0.005) | (0.006) | (0.005) | |
| (0.006) | (0.007) | (0.005) | |
| (0.008) | (0.010) | (0.008) | |
| (0.008) | (0.010) | (0.008) | |
| (0.008) | (0.010) | (0.008) | |
| (0.011) | (0.014) | (0.012) | |
| (0.009) | (0.011) | (0.008) | |
| (0.010) | (0.012) | (0.010) | |
| (0.014) | (0.018) | (0.014) | |
| (0.010) | (0.012) | (0.010) | |
| (0.008) | (0.010) | (0.009) | |
| (0.006) | (0.008) | (0.006) | |
| Constant | (0.006) | (0.007) | (0.007) |
| Observations | |||
| Log Likelihood | |||
| () | () | () | |
| AIC | |||
Note: ; ;
The “All” column in Table 3 reports the results from negative binomial regression where the dependent variable is the number of unique hosts in a CT and the independent variables characterize demographic, SES, housing, and tourism features of that CT. Unsurprisingly, total population is positively associated with the number of hosts, and so is the attractiveness of CTs measured by number of hotels and attractions. CTs with lower fraction of young, non-white, or foreign-born residents tend to have more hosts. In terms of housing conditions, CTs with higher fraction of housing units occupied by owners, higher median housing price, or higher rent on average have larger number of hosts. Finally, after controlling for all these variables, income is negatively correlated with number of hosts, indicating that, all else equal, CTs with lower median household income tend to have more residents who have joined Airbnb as hosts. Note that income is the most influential predictor; CTs with median household income that is one standard deviation below the average have more host. The overall education level of a CT has the second largest effect on joining Airbnb; areas where there are a larger portion of residents with higher education degree have more hosts.
We further investigate whether the association patterns discussed above vary across room types. To do so, we repeat the same procedure above but separate hosts of entire homes and hosts of private and shared rooms. The last two columns in Table 3 display the results. Most association patterns persist. Income and education remain to have the largest effects. Housing price, rent, and fraction of residents working in arts and other related industries are still positively correlated with number of hosts regardless of room type. Demographics factors exhibit opposite patterns for entire home hosts and private/shared room hosts; CTs with higher fraction of young, nonwhite, or foreign-born residents have more hosts of private and shared rooms, but less hosts of entire homes.
5.2. RQ2
Next, we discuss how the association patterns change over time. Table 4 and 5 report the results from negative binomial regressions where dependent variables are, respectively, the number of entire home hosts and private/shared room hosts in a CT who joined Airbnb in different periods, and the independent variables are demographic, SES, housing, and tourism features of that CT.
Table 4 reports the results for entire home hosts. First, we note that the directions of association for all variables are the same as the case where we lump together all entire home hosts joining Airbnb in different years (the “Entire home” column in Table 3), and are consistent across years. Income and education remain to be the two most influential factors across years. All else equal, CTs with lower median household income or higher fraction of residents with Bachelor+ degrees tend to have more hosts. Housing value has the third largest effect and is positively linked to the number of hosts. Such pattern is consistent across years, although the coefficient steadily decreases over time. The coefficient for the rent variable keeps rising, which may suggest that Airbnb is increasingly adopted in areas with higher rents.
| Dependent variable: Number of hosts (entire home) | ||||
| Before 2013 | 2013 | 2014 | 2015 | |
| (0.013) | (0.013) | (0.011) | (0.009) | |
| (0.009) | (0.009) | (0.008) | (0.007) | |
| (0.009) | (0.009) | (0.008) | (0.007) | |
| (0.016) | (0.016) | (0.014) | (0.012) | |
| (0.019) | (0.019) | (0.016) | (0.013) | |
| (0.018) | (0.018) | (0.015) | (0.013) | |
| (0.024) | (0.024) | (0.021) | (0.018) | |
| (0.016) | (0.016) | (0.015) | (0.013) | |
| (0.020) | (0.020) | (0.017) | (0.015) | |
| (0.029) | (0.029) | (0.026) | (0.022) | |
| (0.020) | (0.020) | (0.018) | (0.015) | |
| (0.018) | (0.018) | (0.016) | (0.013) | |
| (0.012) | (0.012) | (0.011) | (0.009) | |
| Constant | (0.015) | (0.015) | (0.012) | (0.010) |
| Observations | ||||
| Log Likelihood | ||||
| (0.007) | (0.008) | (0.007) | (0.006) | |
| AIC | ||||
Note: ; ;
Table 5 provides the regression results for private/shared room hosts. Consistent with all previous results, income and education are the two most important predictors. We also find temporal changes of the association patterns for some variables. For instance, Airbnb has become popular among areas with higher fraction of young residents.
| Dependent variable: Number of hosts (private/shared room) | ||||
| Before 2013 | 2013 | 2014 | 2015 | |
| (0.012) | (0.012) | (0.009) | (0.007) | |
| (0.009) | (0.009) | (0.007) | (0.006) | |
| (0.008) | (0.008) | (0.007) | (0.006) | |
| (0.016) | (0.016) | (0.013) | (0.011) | |
| (0.018) | (0.019) | (0.016) | (0.012) | |
| (0.017) | (0.017) | (0.014) | (0.011) | |
| (0.024) | (0.025) | (0.020) | (0.016) | |
| (0.015) | (0.015) | (0.013) | (0.011) | |
| (0.020) | (0.020) | (0.017) | (0.013) | |
| (0.028) | (0.029) | (0.024) | (0.019) | |
| (0.020) | (0.021) | (0.017) | (0.014) | |
| (0.020) | (0.021) | (0.017) | (0.013) | |
| (0.012) | (0.013) | (0.010) | (0.008) | |
| Constant | (0.016) | (0.017) | (0.013) | (0.010) |
| Observations | ||||
| Log Likelihood | ||||
| (0.023) | (0.029) | (0.027) | (0.029) | |
| AIC | ||||
Note: ; ;
5.3. RQ3
Table 6 provides the results from OLS regressions where the dependent variables are monthly new reviews received by listings and the independent variables are characteristics about the listing, its host, and the CT where it is located. We include listing- and host-level features because the number of new reviews is likely affected by, in addition to geolocation, factors such as the number of amenities in the room, the length of membership of the host, etc. We therefore need to control for these effects.
Regarding listing-level effects, listings tend to gain more new reviews if they already have a larger number of existing reviews, a higher rating, or an instant-book feature that allows guests to book the room directly without host’s approval. Regarding host-level variables, listings with a higher response rate or faster response time tend to receive more new reviews. However, after controlling for these effects, we find that entire home listings in CTs with a higher median household income tend to accumulate more new reviews, suggesting an advantage for SES-advantaged areas. Such association is negative but not statistically significant for private/shared rooms.
| Dependent variable: Number of monthly new reviews | ||
| Entire home | Private room | |
| (0.007) | (0.013) | |
| (0.008) | (0.014) | |
| (0.007) | (0.013) | |
| (0.007) | (0.012) | |
| (0.007) | (0.012) | |
| (0.007) | (0.013) | |
| (0.007) | (0.012) | |
| (0.007) | (0.013) | |
| (0.007) | (0.014) | |
| (0.008) | (0.014) | |
| (0.007) | (0.012) | |
| (0.011) | (0.020) | |
| (0.008) | (0.015) | |
| (0.009) | (0.016) | |
| (0.015) | (0.028) | |
| (0.011) | (0.020) | |
| (0.008) | (0.015) | |
| (0.007) | (0.013) | |
| (0.013) | (0.024) | |
| (0.011) | (0.020) | |
| (0.012) | (0.021) | |
| (0.007) | (0.012) | |
| (0.008) | (0.013) | |
| Constant | (0.007) | (0.012) |
| Observations | ||
| R2 | ||
| Adjusted R2 | ||
| Residual Std. Error | (df = 75461) | (df = 37478) |
| F Statistic | (df = 23; 75461) | (df = 23; 37478) |
Note: ; ;
6. Concluding Discussion
In this paper, we study how social-economic statuses affect the participation of service providers in the sharing economy and who actually benefit from it. We focused on Airbnb—a pioneer yet less studied example of sharing economy platforms—in the US as a case study. We used a large number of listings located in the US and linked them with US Census data that contain demographic, SES, and housing characteristics of census tracts.
We found that income has the most significant effect on residents’ participation in Airbnb; CTs with lower median household income are likely to have more residents becoming Airbnb hosts. This association is persistent across different forms of sharing (i.e., entire home or private/shared room) and across years.
However, when examining the performance of hosts—measured by number of new reviews in a month—we found that entire-home listings that are located in areas with higher income have received more reviews, even after controlling for listing- and host-level characteristics. These findings empirically demonstrate that the advantage of SES-advantaged areas and the disadvantage of SES-disadvantaged areas are present in the sharing economy.
Our work contributes to the literature on the understanding of supply side actors of online markets. First, we provide the first extensive large-scale quantitative analysis of the supply side of online markets from the SES perspective. This is crucial to a comprehensive understanding of how these markets function, especially given that existing studies either focus predominantly on demographics, or are mainly qualitative, or of a small-scale. Second, in line with previous interview-based studies which argue the incentive role of monetary compensations, we demonstrate empirically that Airbnb indeed appeal particularly to people in lower-income areas. Third, our results also uncover that hosts in lower-income areas may not benefit from the market as much as those in higher-income areas.
More broadly, our work also contributes to the studies examining the broader societal impacts of online markets and digital platforms in general. Be these impacts positive (Chen et al., 2017) or negative (Chan and Ghose, 2014; Chan et al., 2016), on established industries (Cramer and Krueger, 2016; Guttentag, 2015) or on individuals (Chan and Ghose, 2014), it is incumbent upon researchers to continue this line of work to gradually open these black-boxes and to provide empirical evidences that can inform policy. Our work highlights a positive effect that Airbnb has attracted more people from lower income areas.
On a related note, despite some critiques around sharing economy platforms like Airbnb, they have various potentials to benefit the society. From the customer’s perspective, they make accommodations potentially more affordable to tourists and have positive impact on local economic activities through touristic related activities such as shopping, dining, and sightseeing. From the service provider’s perspective, they provide a way to allow people to generate additional revenues. This may be more important for people from lower-SES, corroborated by our results showing that Airbnb has attracted more hosts in lower income areas.
We have focused on Airbnb in the US as a case study to examine how SES factors impact the participation of service providers in the sharing economy and who actually benefit from it. It remains to be seen whether our results can be generalized to other countries or other marketplaces. As many online marketplaces are alternatives to traditional markets but with a relatively low entry barrier for service providers, we hypothesize that the potential monetary gain will make them universally attractive to the lower-income community. Their distinctions, however, may introduce some delicate differences. For example, from a service provider’s point of view, Airbnb and Uber may require different levels of commitment of time, energy, or personal space, making one of them more costly than the other, affecting participation.
Our work has clear policy implications. First, our results provide empirical evidence that sharing economy platforms such as Airbnb may be particularly attractive to low-SES individuals and provide additional revenue streams for them. Although there have been studies showing the disruptive impact on established industries (Cramer and Krueger, 2016; Guttentag, 2015), policy makers who are currently debating whether and how to accommodate these online platforms may find our results valuable when considering their potential benefits. Second, that the advantage of SES-advantaged areas might make hosts in higher-income areas benefit more calls for a closer look before making any decisions on whom to tax and how much to tax.
Our work also speaks to platform design. Platform designer may provide online trainings for how to better use of the platform and how to deal with various situations associated with managing listings, and more aim the platform at those hosts with lower income. While having an instant-book feature helps listings attract new reviews, enabling that for all listings would require much work from the platform’s side to ease any safety concerns hosts may have.
Our work is subject to the following limitations. First, despite that the sample of listings analyzed here is the largest ever in the current literature, we cannot ascertain how much it has covered all the active listings in the US market, nor do we know, more importantly, if there is systemic bias in the sample. This issue is raised because the data collection process involved repeated queries of web pages displaying search results of listings in a region, which were returned by Airbnb’s search engine, which is a black-box. Examining potential bias of this opaque, algorithmic system is an interesting line of future work and also contributes to the increasingly important field of algorithm auditing that aims to understand the impact of those systems on their end-users (e.g. (Chen et al., 2015)).
Second, the listings that are available to us are the ones that were active during the data collection process. This means that, when examining how association patterns change over time, we cannot observe listings that entered and then exited the market before the time when data was collected, which may to some extent dictate our results. Moreover, such limitation also means that we cannot observe the group that either could not afford becoming a host or choose not to. While this suggests that the lowest-income community might not be better off, future work that incorporates decision to enter the market might enhance our understanding.
Third, we have chosen to perform our analysis on the census tract level, given the difficulty in accessing detailed demographic, SES, and housing data of each individual host, although in theory we are interested in the association at the individual level. If those data were available, more involved regression designs that control for unobservable individual fixed effects might have been used. While individual-level variables have larger variances than their CT-level summaries, we expect our results to hold as regressions capture average effects. Considering that individual-level data bring not only more information but also noise, focusing on the census tract level may provide a good balance.
Acknowledgements.
We thank the anonymous referees for their helpful comments and suggestions and Filippo Radicchi for excellent computing resources.References
- (1)
- Azevedo and Weyl (2016) Eduardo M. Azevedo and E. Glen Weyl. 2016. Matching markets in the digital age. Science 352 (2016), 1056–1057. Issue 6289. https://doi.org/10.1126/science.aaf7781
- Chan and Ghose (2014) Jason Chan and Anindya Ghose. 2014. Internet’s Dirty Secret: Assessing the Impact of Online Intermediaries on HIV Transmission. MIS Quarterly 38 (2014), 955–976. Issue 4.
- Chan et al. (2016) Jason Chan, Anindya Ghose, and Robert Seamans. 2016. The Internet and Racial Hate Crime: Offline Spillovers from Online Access. MIS Quarterly 40 (2016), 381–403. Issue 2.
- Chen et al. (2015) Le Chen, Alan Mislove, and Christo Wilson. 2015. Peeking Beneath the Hood of Uber. In Proceedings of the 2015 Internet Measurement Conference. 495–508. https://doi.org/10.1145/2815675.2815681
- Chen et al. (2017) M. Keith Chen, Judith A. Chevalier, Peter E. Rossi, and Emily Oehlsen. 2017. The Value of Flexible Work: Evidence from Uber Drivers. (2017). https://doi.org/10.3386/w23296 NBER Working Paper No. 23296.
- Cramer and Krueger (2016) Judd Cramer and Alan B. Krueger. 2016. Disruptive Change in the Taxi Business: The Case of Uber. American Economic Review 106, 5 (2016), 177–82. https://doi.org/10.1257/aer.p20161002
- Cusumano (2015) Michael A. Cusumano. 2015. How Traditional Firms Must Compete in the Sharing Economy. Commun. ACM 58, 1 (2015), 32–34. https://doi.org/10.1145/2688487
- Dillahunt et al. (2016) Tawanna Dillahunt, Airi Lampinen, Jacki O’Neill, Loren Terveen, and Cory Kendrick. 2016. Does the Sharing Economy Do Any Good?. In Proceedings of the 19th ACM Conference on Computer Supported Cooperative Work & Social Computing Companion. 197–200. https://doi.org/10.1145/2818052.2893362
- Dillahunt and Malone (2015) Tawanna R. Dillahunt and Amelia R. Malone. 2015. The Promise of the Sharing Economy Among Disadvantaged Communities. In Proceedings of the 33rd Annual ACM Conference on Human Factors in Computing Systems. 2285–2294. https://doi.org/10.1145/2702123.2702189
- Edelman and Luca (2014) Benjamin G. Edelman and Michael Luca. 2014. Digital Discrimination: The Case of Airbnb.com. (2014). https://doi.org/10.2139/ssrn.2377353 Harvard Business School NOM Unit Working Paper No. 14–054.
- Edelman et al. (2017) Benjamin G. Edelman, Michael Luca, and Dan Svirsky. 2017. Racial Discrimination in the Sharing Economy: Evidence from a Field Experiment. American Economic Journal: Applied Economics 9, 2 (2017), 1–22. https://doi.org/10.1257/app.20160213
- Einav et al. (2016) Liran Einav, Chiara Farronato, and Jonathan D. Levin. 2016. Peer-to-Peer Markets. Annual Review of Economics 8, 1 (2016), 615–635. https://doi.org/10.1146/annurev-economics-080315-015334
- Guttentag (2015) Daniel Guttentag. 2015. Airbnb: disruptive innovation and the rise of an informal tourism accommodation sector. Current Issues in Tourism 18, 12 (2015), 1192–1217. https://doi.org/10.1080/13683500.2013.827159
- Hall and Krueger (2016) Jonathan V. Hall and Alan B. Krueger. 2016. An Analysis of the Labor Market for Uber’s Driver-Partners in the United States. (2016). https://doi.org/10.3386/w22843 NBER Working Paper No. 22843.
- Hannák et al. (2017) Anikó Hannák, Claudia Wagner, David Garcia, Alan Mislove, Markus Strohmaier, and Christo Wilson. 2017. Bias in Online Freelance Marketplaces: Evidence from TaskRabbit and Fiverr. In Proceedings of the 2017 ACM Conference on Computer Supported Cooperative Work & Social Computing. 1914–1933. https://doi.org/10.1145/2998181.2998327
- Ikkala and Lampinen (2015) Tapio Ikkala and Airi Lampinen. 2015. Monetizing Network Hospitality: Hospitality and Sociability in the Context of Airbnb. In Proceedings of the 18th ACM Conference on Computer Supported Cooperative Work & Social Computing. 1033–1044. https://doi.org/10.1145/2675133.2675274
- Ke (2017) Qing Ke. 2017. “Sharing Means Renting?: An Entire-marketplace Analysis of Airbnb.” In Proceedings of the 2017 ACM on Web Science Conference. 131–139. https://doi.org/10.1145/3091478.3091504
- Kooti et al. (2017) Farshad Kooti, Mihajlo Grbovic, Luca Maria Aiello, Nemanja Djuric, Vladan Radosavljevic, and Kristina Lerman. 2017. Analyzing Uber’s Ride-sharing Economy. In Proceedings of the 26th International Conference on World Wide Web Companion. 574–582. https://doi.org/10.1145/3041021.3054194
- Kricheli-Katz and Regev (2016) Tamar Kricheli-Katz and Tali Regev. 2016. How many cents on the dollar? Women and men in product markets. Science Advances 2, 2 (2016), e1500599. https://doi.org/10.1126/sciadv.1500599
- Lampinen and Cheshire (2016) Airi Lampinen and Coye Cheshire. 2016. Hosting via Airbnb: Motivations and Financial Assurances in Monetized Network Hospitality. In Proceedings of the 2016 CHI Conference on Human Factors in Computing Systems. 1669–1680. https://doi.org/10.1145/2858036.2858092
- Lee et al. (2015) Min Kyung Lee, Daniel Kusbit, Evan Metsky, and Laura Dabbish. 2015. Working with Machines: The Impact of Algorithmic and Data-Driven Management on Human Workers. In Proceedings of the 33rd Annual ACM Conference on Human Factors in Computing Systems. 1603–1612. https://doi.org/10.1145/2702123.2702548
- Luca (2016) Michael Luca. 2016. Designing Online Marketplaces: Trust and Reputation Mechanisms. (2016). https://doi.org/10.3386/w22616 NBER Working Paper No. 22616.
- Ma et al. (2017) Xiao Ma, Jeffery T. Hancock, Kenneth Lim Mingjie, and Mor Naaman. 2017. Self-Disclosure and Perceived Trustworthiness of Airbnb Host Profiles. In Proceedings of the 2017 ACM Conference on Computer Supported Cooperative Work & Social Computing. 2397–2409. https://doi.org/10.1145/2998181.2998269
- Malhotra and Alstyne (2014) Arvind Malhotra and Marshall Van Alstyne. 2014. The Dark Side of the Sharing Economy . . . and How to Lighten It. Commun. ACM 57, 11 (2014), 24–27. https://doi.org/10.1145/2668893
- Quattrone et al. (2016) Giovanni Quattrone, Davide Proserpio, Daniele Quercia, Licia Capra, and Mirco Musolesi. 2016. Who Benefits from the “Sharing” Economy of Airbnb?. In Proceedings of the 25th International Conference on World Wide Web. 1385–1394. https://doi.org/10.1145/2872427.2874815
- Teodoro et al. (2014) Rannie Teodoro, Pinar Ozturk, Mor Naaman, Winter Mason, and Janne Lindqvist. 2014. The Motivations and Experiences of the On-demand Mobile Workforce. In Proceedings of the 17th ACM Conference on Computer Supported Cooperative Work & Social Computing. 236–247. https://doi.org/10.1145/2531602.2531680
- Thebault-Spieker et al. (2015) Jacob Thebault-Spieker, Loren G. Terveen, and Brent Hecht. 2015. Avoiding the South Side and the Suburbs: The Geography of Mobile Crowdsourcing Markets. In Proceedings of the 18th ACM Conference on Computer Supported Cooperative Work & Social Computing. 265–275. https://doi.org/10.1145/2675133.2675278