∎
Peking University, Beijing, China
22email: smitha@pku.edu.cn 33institutetext: M. Marengo 44institutetext: Iowa State University
Department of Physics and Astronomy, Ames, IA, USA
44email: mmarengo@iastate.edu 55institutetext: A. Bhardwaj 66institutetext: European Southern Observatory
85748, Garching, Germany
66email: abhardwaj@eso.org 77institutetext: Yang Huang 88institutetext: Department of Astronomy,
Kavli Institute for Astronomy & Astrophysics,
Peking University, Beijing, China
88email: yanghuang@pku.edu.cn 99institutetext: L. Inno 1010institutetext: Max-Planck-Institut für Astronomy
69117, Heidelberg, Germany
1010email: inno@mpia.de 1111institutetext: A. Nakagawa 1212institutetext: Kagoshima University, Faculty of Science
Korimoto 1-1-35, Kagoshima 890-0065, Japan
1212email: nakagawa@sci.kagoshima-u.ac.jp 1313institutetext: J. Storm 1414institutetext: Leibniz-Institut für Astrophysik Potsdam (AIP)
An der Sternwarte 16, 14482 Potsdam, Germany
1414email: jstorm@aip.de
Young and Intermediate-age Distance Indicators
Abstract
Distance measurements beyond geometrical and semi-geometrical methods, rely mainly on standard candles. As the name suggests, these objects have known luminosities by virtue of their intrinsic proprieties and play a major role in our understanding of modern cosmology. The main caveats associated with standard candles are their absolute calibration, contamination of the sample from other sources and systematic uncertainties. The absolute calibration mainly depends on their chemical composition and age. To understand the impact of these effects on the distance scale, it is essential to develop methods based on different sample of standard candles. Here we review the fundamental properties of young and intermediate-age distance indicators such as Cepheids, Mira variables and Red Clump stars and the recent developments in their application as distance indicators.
Keywords:
stars: distances, stars: variables: Cepheids, stars: AGB and post-AGB, stars: horizontal branch stars, Cosmology: distance scale1 Introduction
Distance to celestial objects is one of the key astrophysical parameters. Measurements of many fundamental properties, such as luminosities, masses, sizes and ages, depend on distances. Moreover, distance measurements play an important role in our understanding of modern cosmology. We have various methods based on geometrical, semi-geometrical, photometric and kinematic methods, to estimate the distances to celestial objects. Each method has limited range of applicability, such as the radar techniques for solar system objects, parallax methods for stars within a few kpc, Cepheids standard candles to a few Mpc and Type Ia supernovae to several 1000 Mpc. So each method which makes each rung in the distance ladder, is used to calibrate the next most distant method. This approach enables us to determine the scale of the Universe.
The parallax method of determining distance is the most direct and fundamental to all others. As the Earth revolves around the Sun, there is an apparent change in position of nearby stars with respect to the distant stars. This apparent change in position is a measure of the distance to that object. These distances are purely based on geometrical calculation and no assumptions about the physical or chemical properties of the sources are required. Hence, parallax distances are considered to be highly reliable measurements. However, the parallax measurements of giant stars which have large radius are not very precise. For distant sources, the parallax becomes smaller and this limits the application of parallax method to very nearby objects.
Distance measurement using eclipsing binaries, which is based on a semi-geometrical method, can reach up to the edge of the Local Group with an accuracy of 5%. We can measure the sizes of the stars from the velocities and the eclipse durations, the luminosities from the radii and surface temperatures, and the distance to the system from the magnitudes. This requires good modelling of the binary system. For early-type stars, this is a challenge due to the problems with accurate flux calibration and due to the degeneracy between stellar temperature and reddening. For late-type stars, these problems are minimal as very accurate flux calibration is available and accurate measurements of linear and angular sizes are possible. Thus, we can derive a distance which is primarily limited by the accuracy with which we can measure the light curve and the radial velocities. Such a distance is completely independent of the usual distance ladder. The most accurate distances, to date, to the Magellanic Clouds are estimated using eclipsing binaries (Pietrzyński et al. 2013, Graczyk et al. 2014).
Beyond the distances which can be reached using the geometrical and semi-geometrical methods, objects with known luminosity are adopted. They are called standard candles and they include Cepheids, RR Lyrae stars, Mira stars and Red Clump (RC) stars. Whereas, Type Ia supernovae are standardisable candle as their luminosities are not known. What we know from nearby Type Ia supernovae is that there is a specific relation between their peak brightness and the time it takes for them to decay (Phillips, 1993). Intrinsically bright supernovae shine longer than faint supernovae. From the ratio of peak to width of their light curve, we can determine their absolute magnitude. Here, we restrict our review to distance indicators whose luminosities are known, which are standard candles. The main problems associated with standard candles are their calibration, selection and other systematic uncertainties. To mitigate these issues, several detailed studies are going on.
In this chapter we review the fundamental properties of young and intermediate-age stellar populations such as, Cepheids (15 – 300 Myr), Mira variables (1 – 7 Gyr) and RC stars (2 – 9 Gyr) and the recent developments in their application as distance indicators.
2 Cepheids
Since Henrietta Leavitt discovered their Period-Luminosity (PL) relation (Leavitt law, Leavitt & Pickering 1912), Classical Cepheid variables have assumed a fundamental role as primary distance indicators. The Leavitt law was indeed the crucial ingredient allowing Edwin Hubble to determine the first reliable distance to M31 (Hubble, 1929a). In doing so he established the technique that in short order would lead to the discovery of the eponymous Hubble law (Hubble, 1929b), and modern cosmology.
Almost a century later, Cepheids PL relations are still the cornerstone of the cosmological distance ladder. Cepheids in the Large Magellanic Cloud (LMC), the Small Magellanic Cloud (SMC) and other Local Group galaxies, provide the link between the local universe, distant standard candles (e.g. Supernovae Type Ia) and the Hubble Flow. The Hubble Space Telescope (HST) Key Project on the Extragalactic Distance (Freedman et al., 2001), in particular, tied all this together by delivering the first precise (10% accuracy) determination for the value of the Hubble constant.
Despite their importance, Cepheid distances are still challenged by several factors. On the observational side, in addition to the statistical photometric uncertainties related to the measurement of Cepheid’s mean magnitudes, the main errors in Cepheid distances are due to interstellar extinction and the systematic errors in the chosen PL relation. These systematic errors are related to the uncertainty in the PL slope and zero point, as well as its intrinsic scatter , which in turn is the consequence of PL relations not taking into account the width in temperature of the Cepheid Instability Strip (IS). Due to this intrinsic scatter, PL relations should be really considered as statistical relations that can be correctly applied only to a statistical ensemble of stars, and not to individual Cepheids. As such, when Cepheids are used as galactic tracers to derive the three-dimensional structure of an underlying stellar population, the PL relation becomes the dominant source of error. Instead when we measure the distance of a group of Cepheid stars (such as when using Cepheids to derive the distance of a galaxy used to calibrate the next step in the cosmological distance ladder) interstellar extinction and the empirical calibration of the PL zero point remain the largest uncertainties.
The last decade has seen great progress to overcome these limitations, with observations moving towards infrared wavelengths (where extinction is reduced) and the adoption of HST parallaxes for a number of Cepheid calibrators. Great progress has also been made in bringing under control issues regarding the linearity of the PL relation, and its dependence on metallicity. This has allowed a new determination of the Hubble constant, anchored on Cepheids, with accuracy better than 3% (Freedman et al., 2012). The adoption of Period-Wesenheit (PW) relations has reduced the uncertainties related to the and to extinction at optical and near-infrared wavelengths, while templates have been produced to allow greater photometric accuracy even for sparsely sampled Cepheids light-curves. These developments were crucial for allowing Cepheids to assume the important role as galactic tracers described above.
In the theoretical arena the outstanding issue directly affecting the accuracy of Cepheid distances is the so-called “Cepheids mass discrepancy” between evolutionary models and Cepheid masses determined from pulsation theory and in binary systems. If this discrepancy is related to mass loss, it could lead to the formation of dusty circumstellar clouds, that would increase local extinction in the visible, and/or excess thermal emission in the infrared. Detailed calculations of the projection factor and limb darkening, necessary to precisely measure the distance of nearby individual Cepheid calibrators with variants of the the Baade-Wesselink method, such as the infrared brightness method, had also become available (Marengo et al. 2002, 2003; Storm et al. 2011a; Ngeow et al. 2012 and references therein).
In this section we discuss how these issues are dealt with modern measurements of Cepheid distances. In section 2.1 we discuss the techniques enabling the measurement of accurate distances for individual Cepheids in the near-IR, with particular emphasis to PW relations, independent determinations of reddening and the use of light curve templates. In section 2.2 we analyse the status of mid-infrared Cepheid distances as part of new efforts to improve the cosmological distance scale. In section 2.3 we explore the issue of linearity in the PL relation and its role for the determination of the Hubble constant. In section 2.4 we discuss the effect of metallicity in the slope of the PL relation of Galactic and Magellanic Clouds Cepheids.
2.1 Accurate individual Cepheid distances from near-infrared observations
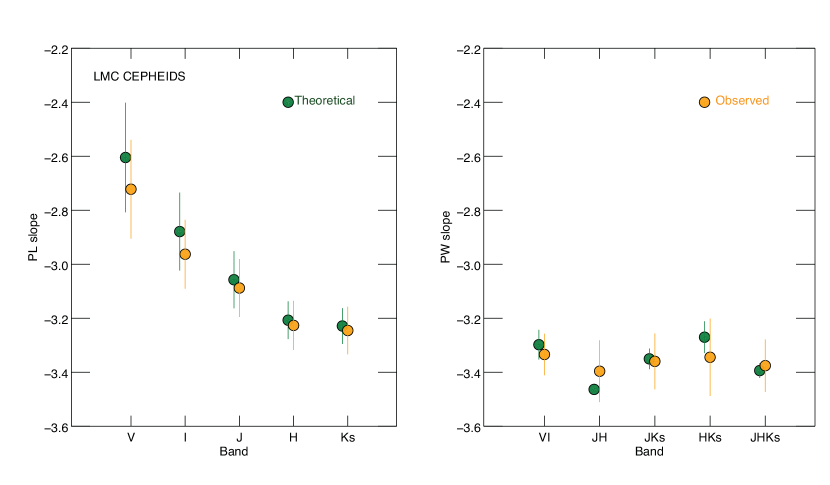
A comprehensive theoretical framework has been developed over the past 20 years to account for all the phenomenological features of pulsating stars (Bono et al., 1999a, b, 2000a; Marconi et al., 2005; Fiorentino et al., 2013; Marconi et al., 2015). These models allow us to predict and, in turn, to pinpoint the best tool to derive Cepheids’ individual distances. The left panel of Figure 1 shows the predicted slope (green dots) of PL relations in optical () and near-infrared (NIR, ) bands for 1,300 synthetic Cepheids in the LMC presented in Inno et al. (2016). We note that non-linearity in the PL relations is not considered here. As we can see later (section 2.3), the implications of non-linearity on the distance scale or the value of Hubble constant is not statistically significant. The LMC is indeed a perfect workbench to test the accuracy of PL relations, since it is the closest star-forming galaxy almost face-on (inclination 25∘ – 35∘: Jacyszyn-Dobrzeniecka et al. 2016; Inno et al. 2016; Subramanian & Subramaniam 2013), with a relatively small extension along the line-of-sight (0.5–10 kpc, Subramanian & Subramaniam 2009), and for which more than 3,000 Cepheids are known, thanks to the extensive observational campaigns of micro-lensing surveys (e.g. MACHO: Alcock et al. 2001, EROS: Beaulieu et al. 1995, OGLE: Soszyński et al. 2008, 2010). Moreover, the metallicity content of the LMC young stellar population is well constrained Romaniello et al. (2008), and we can adopt the mean metallicity to produce a synthetic population of Cepheids. The green error-bars in Figure 1 indicate the dispersion around each relation. In the case of the theoretical PL relations, the dispersion corresponds exactly to . The error bars clearly show how decreases when moving from optical to the NIR bands. This trend is a simple consequence of the dependence of bolometric corrections on temperature, which produces a narrowing of the IS in the Colour–Magnitude–Diagram (CMD) at longer wavelengths. In the same figure, the observed slopes and dispersions for the LMC Cepheids are also shown (Inno et al., 2016). While the slopes are remarkably in agreement with theoretical predictions, especially in the NIR bands, the observed dispersions are systematically larger. Such difference is due to the additional sources of scatter that affect the observed mean magnitudes: the photometric error, the uncertainty on the reddening correction and the dispersion due to the line-of-sight depth of the LMC. The scatter contributing to the latter term is indeed the quantity we want to measure. Thus, by reducing the scatter due to the PL intrinsic dispersion to the reddening effects and to the photometric error, we are able to improve the accuracy on the Cepheid’s individual distances.
2.1.1 Period–Wesenheit relations in the NIR
Reddening corrections can be performed by adopting different approaches. If the reddening law for a given galaxy or line of sight is known, then multi-band photometry of Cepheids allows us to obtain their distances and colour excess. For instance, we can use the and band PL relations to obtain the , and then use the predicted total to selective extinction ratio , to determine . The above approach is similar to the use of the so-called PW relations, where Wesenheit magnitudes (van den Berg, 1975; Madore, 1982) are constructed to be reddening-free. In fact, if we combine the two observed magnitudes m and m, into the Wesenheit magnitude
| (1) |
where is the total to selective extinction for the given filters, we find that the observed Wesenheit magnitude is identical to the de-reddened one. Wesenheit magnitudes can be defined with any combination of photometric bands, but recent theoretical predictions (Bono et al., 2000a; Marconi et al., 2005; Fiorentino et al., 2007) and empirical results (Bono et al., 2010; Inno et al., 2013, 2016) show that NIR PW relations are indeed the best suited tool to derive accurate Cepheids’ distances. In fact, they are linear over the entire period range and, because they mimic a period-luminosity-colour relation, they have a smaller when compared to optical and NIR PL relations, as demonstrated by comparing the right and left panel of Figure 1. In the right panel the predicted slopes (green dots) of the optical () and NIR PW relations are plotted together with their intrinsic dispersions (error bars). We find that the predicted dispersion around the ( mag) and the ( mag) PW relations are 30–60% smaller than the one around the band PL relation ( mag).
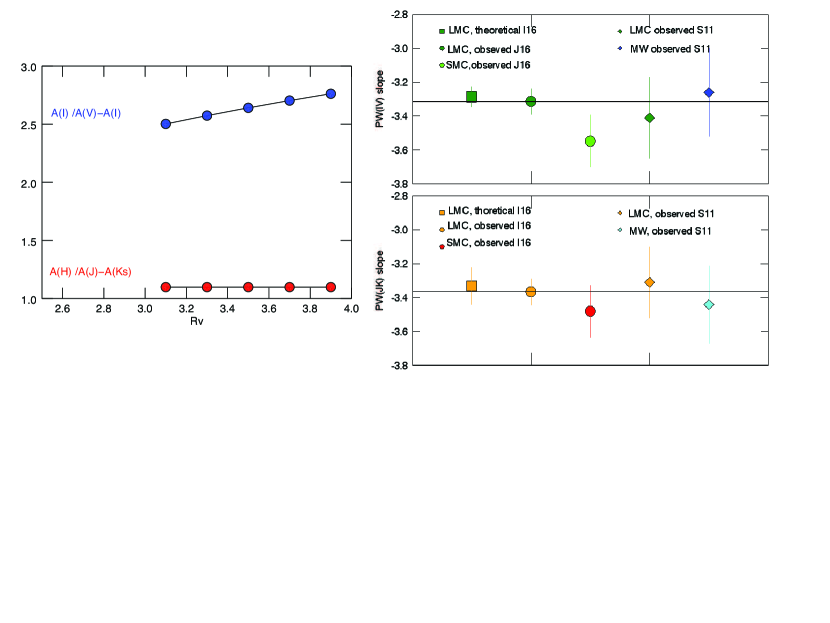
Moreover, when comparing optical to NIR PW relations, we also find that they are minimally affected by uncertainties on the adopted reddening law and marginally affected by metallicity effects (Bono et al., 2010; Freedman, 2010a). For instance, in the left panel of Figure 2 we show the change of the Wesenheit coefficients with values of the total-to-selective absorption ratio (), ranging from 3.1 to 4 (McCall, 2004; De Marchi et al., 2016), in the case of Cardelli’s reddening law (Cardelli et al., 1989). Because the ratio is independent of for m (Cardelli et al., 1989) and the reddening law can then be approximated by a power law, the NIR coefficient results do not change, while the optical coefficient changes by 10%. In the right panel of Figure 2 the comparison between slopes of PW relations for the Milky Way (Storm et al., 2011b) and the Magellanic Cloud Cepheids (Jacyszyn-Dobrzeniecka et al., 2016; Inno et al., 2016) for the optical (top) and the NIR (bottom) is also shown. In the case of the NIR PW () relation, the slopes are common within the error given by their scatter, thus indicating a small (if any) dependence on the metallicity, at least in the metallicity range covered by these galaxies.
In the right panel of Figure 1 the observed slopes and dispersion of optical and NIR PW relations for LMC Cepheids (orange dots) are also shown Inno et al. (2016). Once again, we find that the observed dispersions ( 1) are larger than the predicted ones. In fact, while the uncertainty on the reddening correction vanishes for the PW relations, the photometric error becomes larger, since it propagates on the mean colour, which appears on the right side of Equation 1. Improving the photometric accuracy on NIR measurement is then a crucial step in order to take full advantage of the use of NIR PW relations as tools to derive accurate Cepheids’ individual distances.
2.1.2 Independent reddening estimates
An alternative approach based on the use of multi-band photometry of Cepheids is the so-called reddening-law fitting method (Freedman et al., 1985; Rich et al., 2014; Inno et al., 2016), which allows to derive individual Cepheids’ distances and extinction independently at the same time. The above method is based on the following expression of the Cepheid true distance modulus as a function of wavelength:
| (2) |
where , and are the coefficients of the adopted reddening law. Thus, if we obtain in different filters by using the PL relations, the fit will provide simultaneously and the extinction . However, these quantities would still be affected by systematics due to the degeneracy in intrinsic colour and extinction.
Reddening maps can also be used to predict the amount of extinction in a given band for a specific line-of-sight. In the case of an external system, such as the Magellanic Clouds, two-dimensional reddening maps can be adopted to correct the observed magnitude for the individual reddening. This method was applied in (Haschke e al., 2012; Macri et al., 2015; Ripepi et al., 2016; Bhardwaj et al., 2016b), who used the reddening maps from Haschke et al. (2011). In the Galaxy, individual reddening along the line-of-sight can be obtained from up-to-date three-dimensional reddening maps (Marshall et al., 2006; Green et al., 2015; Schlafly et al., 2016). This approach is very promising, especially when accurate three-dimensional map of the dust distribution in the Milky Way will become available thanks to Gaia (Rezaei et al., 2016). Individual reddening of Cepheids can also be determined from their spectra, by using empirically calibrated relations between the equivalent width of Diffuse Interstellar Bands (DIB) and (Friedman et al., 2011). For instance, this method has been applied to derive de-reddened magnitudes of Cepheids in the inner disk by (Martin et al., 2015; Andrievsky et al., 2016). Note that all above methods still rely on the assumption of the reddening law and thus total-to-selective absorption ratio, thus they are still prone to systematic errors.
2.1.3 NIR templates as tools to optimize NIR variability surveys
The main drawback in using NIR PL or PW relations to determine Cepheid distances is that NIR light curves are available for a limited number of stars. For instance, in the Galaxy only 200 (Laney et al., 1992; Monson et al., 2011) out of 600 (Dambis et al., 2015) known Cepheids have accurate NIR photometry. The reasons is that variability surveys have been traditionally performed in optical bands, where the pulsation amplitude is typically larger, (e. g. 1.2 mag in vs. 0.2 mag in ), thus allowing a more robust classification of the variables. On the other hand, the lower amplitudes in the NIR bands enable us to determine accurate mean magnitudes from a smaller number of phase points (10–12 vs. 30). This is a sensitive issue, especially for surveys aiming at discovering new Cepheids in the most extincted region of the Galaxy, where NIR photometry is necessary to cope with such high extinction (e.g. VISTA Variables in the Via Lactea (VVV), Minniti et al. 2010, InfraRed Survey Facility (IRSF), Matsunaga et al. 2011, 2013, 2016). However, NIR ground–based observations are still more time-consuming than optical observations, because of sky subtraction. A cheap solution to this problem in terms of observing time, is the use of light-curve templates to determine accurate NIR mean magnitudes from a few or even only one measurement. Such templates are available in the literature for both RR Lyrae (Jones et al., 1996; Sesar et al., 2010) and classical Cepheids (Soszyński et al., 2005; Pejcha & Kochanek, 2012; Inno et al., 2015; Ripepi et al., 2016) and rely on empirical calibrations.
NIR templates to fit sparsely sampled light-curves.
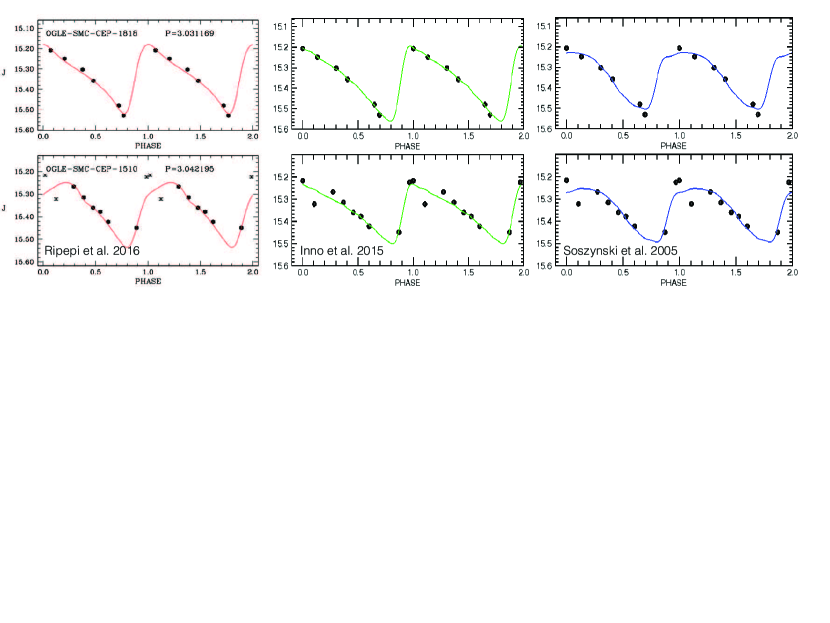
Recent and ongoing surveys, such as the VVV, the VISTA Survey of Magellanic Clouds System (VMC, Cioni et al. 2011), the NIR Synoptic Survey (Macri et al., 2015) and the IRSF surveys, use NIR bands to access farther or more obscured stars. In order to optimise their scientific outcome respect to the surveyed area and the cadence, these surveys collect sparsely sampled light-curves in one or more NIR bands. However, if the period of a given Cepheid is known with sufficient accuracy, it is possible to perform a template-fitting to the multi-epoch observations in order to accurately determine their mean magnitudes. For instance, VMC provides NIR magnitudes measured at on average 5.7, 6.3 and 16.7 epochs in the , and band respectively, for the SMC Cepheids in the OGLE-III catalog. Ripepi et al. (2016) used the best sampled light-curves in the VMC dataset to build new templates, interpolated the data of the sparsely sampled curves with splines and then applied a template-fitting procedure in three steps. They obtained first the optical-to-NIR scaled amplitudes, then the phase-lags between the OGLE optical and the NIR light curves and finally the mean magnitudes. Inno et al. (2016) applied directly the templates from Inno et al. (2015) to similar VMC data for LMC Cepheids and solved independently for amplitudes, mean magnitudes and phase-lags at the same time. A comparison between of the two mentioned template-fitting techniques applied to the VMC light curves for Cepheids in the SMC is shown in the left and middle panels of Figure 3. The templates allow to predict the shape of the light curve and then determine accurate mean-magnitudes from six epochs. Differences on the mean magnitude obtained by adopting the templates by Ripepi et al. (2016) (red line) and the ones by Inno et al. (2016) (green line) are smaller than 0.01 mag, or 0.5% in distance to the SMC. The template-fitting approach is also to be preferred when the photometric error on individual observations is so large (0.1 mag) to introduce spurious features in the light-curve shape. This is for instance the case of light curves from the Near-Infrared Synoptic Survey. Macri et al. (2015) uses the templates by Soszyński et al. (2005) and a template-fitting procedure similar to the one described above to determine LMC Cepheids , and mean magnitudes. For completeness, we also applied the same approach to the VMC data in Figure 3 (right panel). The fit obtained by using the templates by Soszyński et al. (2005) (blue line) seems to be less accurate in reproducing the light-curve shape of the SMC Cepheids, with a difference on the mean magnitude of 0.03 mag, or 1.5% in distance to the SMC.
NIR templates to correct for random-phase effects.
If the light curve in the optical band is available, the NIR templates can also be used to obtain mean-magnitude from NIR single-epoch observations (Soszyński et al., 2005; Inno et al., 2015). The accuracy on these mean-magnitudes is limited by the photometric error on the NIR single-epoch observation; the precision to which we can predict the phase of the NIR observation and the NIR amplitude; and the accuracy of the template itself. Indeed, the templates by Inno et al. (2015) provide mean magnitude with an error lower than 2% for single-epoch measurements with 1% photometric precision or better. Thus, the uncertainty on Cepheid’s individual distance determination is already dominated by the ( 3%). This means that these templates allow us to already reach the precision limit of the method, even with single-epoch NIR observations, if the photometric precision is sufficient.
2.1.4 Summary
NIR PW relations allow us to derive Cepheid distances with the accuracy to meet the precision of ongoing cosmological experiments. In fact, they appear to be linear over the entire period range and their slopes appear to be common between the Magellanic Clouds, indicating that they are universal in the considered metallicity range (see section 2.3 and 2.4 for an in-depth discussion of the linearity of the NIR PL relations and their dependence on metallicity). Moreover, PW relations are minimally affected by uncertainties in the adopted reddening law. For instance, by using NIR PW relations, Inno et al. (2013) obtained the most precise estimate of distances to the Magellanic Clouds based on Cepheids, with random errors at 1% level and systematics at 5% level. The systematic errors are dominated by the uncertainties in the PW zero point. This means that the new independent calibrations from Gaia and HST will play a crucial role to reach a better accuracy.
Moreover, new NIR light-curve templates can provide accurate mean magnitudes from a few or even one observation, allowing a significant saving of telescope time and an optimal usage of data already available (e.g. from 2MASS, VVV, VMC, etc.). The use of templates to predict the amplitude and the shape of the variation of physical quantities of Cepheids along the pulsation cycle, such as luminosity and radial velocity, is a powerful tool. In fact, this approach (single-epoch photometry and spectroscopy + light and radial velocity curve templates for Cepheids) is very efficient to investigate the spatial distribution and the kinematics of the resolved stellar population in nearby galaxies, especially in the approaching E-ELT era, since we will be able to apply it to more distant spiral galaxies in the Local Group and beyond (4Mpc).
2.2 Mid-infrared Cepheid distances and the cosmological distance scale
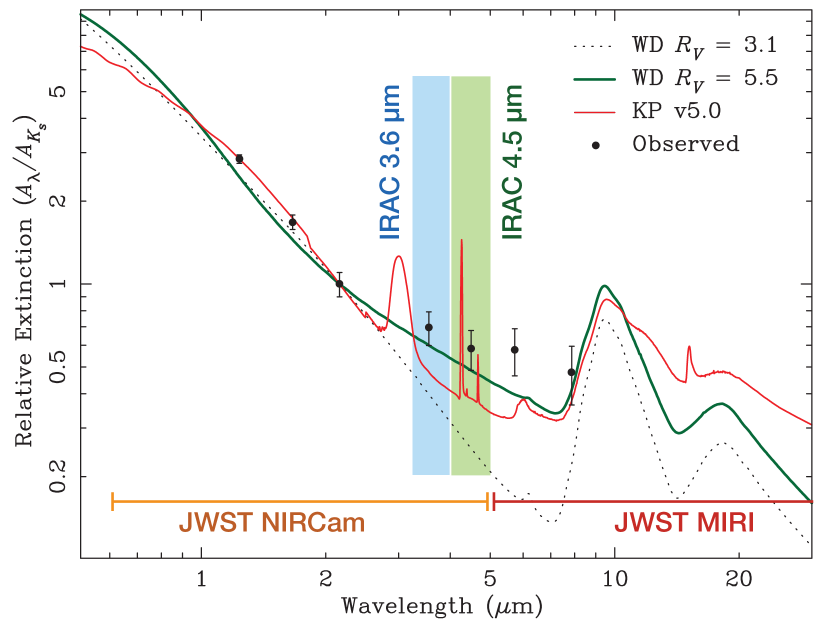
Observing Cepheids in the mid-infrared (MIR, , , and photometric bands) leads to significant advantages with respect to optical wavelengths. Recent determinations of the interstellar and extragalactic extinction curve (see e.g. Chapman et al. 2009; Rieke & Lebofsky 1985; Indebetouw et al. 2005; Flaherty et al. 2007; Román-Zúñiga et al. 2007; Nishiyama et al. 2009, Figure 4) show that in the thermal infrared, the dust extinction is reduced by more than an order of magnitude compared to the band ( and in the and spectral bands respectively Indebetouw et al. 2005). Furthermore, for stars with G and K spectral type the shape of the spectrum closely follows the temperature-independent Rayleigh-Jeans distribution. As a consequence, the brightness variations related to the pulsations are largely insensitive to the effective temperature variation, being dominated by the smaller changes in surface area consequence of the stars’ radial pulsations. This leads to small amplitudes for wavelengths longer than the band (-0.4 mags for the average 10 days period), which reduces the number of epochs necessary to measure accurate average magnitudes. Finally, infrared Cepheid spectra are mostly free from line blanketing, in principle reducing the dependence of the Leavitt law from metallicity, even though CO absorption can still play a significant role (see discussion in section 2.2.2 below). For these reasons the last decade has seen multiple efforts aimed to develop robust Cepheid distance determinations using their PL relation at MIR wavelengths.
2.2.1 Empirical PL relations and the CHP program
Mid-infrared astronomy received a boost in sensitivity and accuracy by many orders of magnitude with the launch of the Spitzer space telescope Werner et al. (2004), and in particular its InfraRed Array Camera (IRAC, Fazio et al. 2004). IRAC is currently operating in the extended “warm mission” following the exhaustion of its cryogenic liquid Helium (LHe), still acquiring images and providing better than 1% photometry in its 3.6 and 4.5 m bands. IRAC enabled obtaining accurate magnitudes of Cepheid stars as far as the Magellanic Clouds, in addition to the Milky Way Galaxy. These capabilities have been exploited by several teams that derived an empirical calibration of MIR Cepheids PL relations (Ngeow & Kanbur, 2008; Marengo et al., 2010; Scowcroft et al., 2011; Monson et al., 2012; Ngeow et al., 2015b).
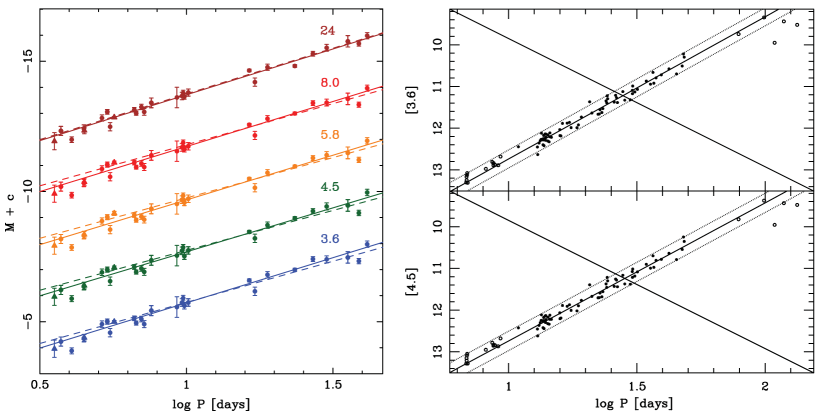
Figure 5 shows the 3.6 to 24 m Leavitt law (Marengo et al. 2010) measured for Galactic Classical Cepheids with IRAC and MIPS (Rieke et al., 2004) during the Spitzer cryogenic mission. Each star was observed in two random epochs six months apart. The PL relation zero point was then determined using parallaxes measured with the HST Fine Guidance Sensors (Benedict et al., 2007) and Hipparcos (for Polaris, van Leeuwen et al. 2007a), or distances derived with the InfraRed Surface Brightness (IRSB) technique by Fouqué et al. (2007) (see detailed description of the method in section 2.4.1). The calibration of the Classical Cepheids PL relation was then refined at 3.6 and 4.5 m during the Spitzer/IRAC warm mission with the Carnegie Hubble Program (CHP, Freedman et al. 2011). As part of this program Monson et al. (2012) measured well sampled (24 epochs) light-curves of 37 Galactic Classical Cepheids with accurate astrometric or IRSB distances, calibrating the PL zero points with a % accuracy. Scowcroft et al. (2011, 2016b) then used the Galactic zero points to measure the distance and geometry of the LMC and SMC with a % accuracy. This provided a new, direct way of anchoring the extragalactic distance scale to Classical Cepheid distances, allowing a new measurement of the Hubble constant and other cosmological parameters (Freedman et al. 2012).
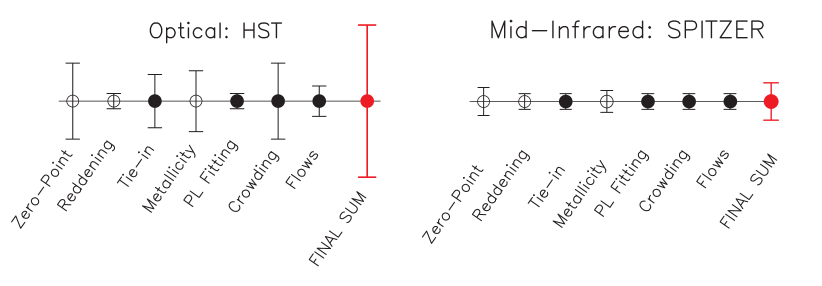
Figure 6 breaks down the error budget in the CHP (right) and HST Key Project determination of . The open symbols indicate the sources of uncertainty more directly related to the change in wavelength from the optical to the MIR range. The largest improvement is in the PL zero point calibration. This is the consequence of being able to use Galactic calibrators with astrometric distances to anchor the Leavitt law, rather than relying to independent estimates of the LMC distance. As mentioned above, this is only possible in the infrared where the extinction of individual calibrator stars is one order of magnitude less than in the visible. The effect of reddening itself on the overall determination is however not dramatically reduced, since it contributes in the form of a statistical uncertainty, and was already limited to less than % in the HST Key Project by observing a large number of distance indicators. The uncertainty due to metallicity effects is instead halved from % to %, again a consequence of being able to directly calibrate the Cepheids PL relation at high metallicity in the Galaxy, rather then relying to the intermediate step of calibrating the zero point using the lower metallicity LMC (see detailed discussion in Freedman et al. 2012).
The overall effect of moving from visible to infrared bands results in both the reduction of the uncertainty in the determination (from % in the HST Key Project to % in the CHP) and an increase in the value of the constant (from to km s-1 Mpc-1 in the HST Key Project and CHP, respectively). The increase, while still within the uncertainties, is significant because it goes in the opposite direction of recent determinations of from the analysis of Planck Cosmic Microwave Background (CMB) radiation and Baryonic Acoustic Oscillations (BAO), which are instead favouring lower values (e.g. km s-1 Mpc-1 and km s-1 Mpc-1 in Planck Collaboration 2016 and Cuesta et al. 2015 respectively). A careful assessment of the systematics present in the “direct” determination of the distance scale (anchored on stellar indicators such as Cepheids and SN Type Ia) vs. the CMB/BAO analysis, reveals that this tension in the value of is approaching (Riess et al., 2016). Solving this issue has important consequences for cosmology, since the CMB analysis is dependent on the specifics of the CDM cosmological model used to fit the data. Any discrepancy with a direct determination of and the other cosmological parameters would be an indication of new physics, such as the number or relativistic species and/or the mass of neutrinos (see e.g. Dvorki et al. 2014; Wyman et al. 2014). For this reason it is worth analysing in detail what are the possible systematics that may still affect the role of Cepheids as infrared standard candles, as well as to develop complementary “direct” routes to the distance scale, anchored to Population II distance indicators such as RR Lyrae and the Tip of red giant branch (RGB) in Globular Clusters, or other standard candles such as RC stars and Miras.
2.2.2 Effects of variable CO absorption on Cepheids infrared distances
The method followed by the CHP to calibrate the Leavitt law for Classical Cepheids relies on the assumption that the PL slope (determined by fitting LMC Cepheids) and zero point (measured from Galactic Cepheids with known distances) do not depend in a significant way from metallicity. An in-depth discussion of metallicity effects on Cepheids PL relations, with special emphasis on the NIR, is presented in section 2.4. In the MIR, as mentioned before, the influence of metallicity is generally believed to be lower, due to the far less importance of line blanketing at wavelengths where the stellar spectrum approaches the Rayleigh-Jeans limit. Indeed, tests performed as part of the CHP showed no significant correlation in the residuals between the adopted PL relations and the 3.6 and 4.5 m magnitudes of individual stars over the metallicity range (see Freedman et al. 2012) of the observed stars.
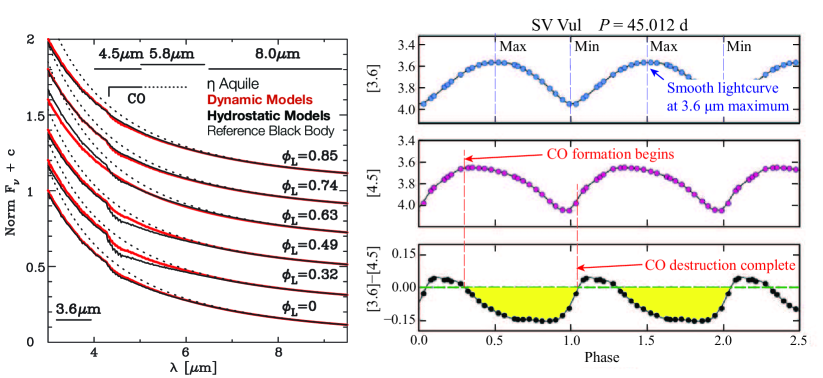
Figure 7 however shows that the spectral brightness in the band (straddling across the IRAC 4.5 and 5.8 m bands) is severely affected by variable CO absorption. Time-dependent hydrodynamic models of pulsating Cepheids (left panel, calculated for Aql by Marengo et al. 2002) reveal that CO absorption is greatly increased for pulsation phases following maximum radius, where the atmosphere is expanding and the effective temperature is at its minimum. As the star approaches minimum radius (corresponding to minimum infrared luminosity) the CO molecule is chemically destroyed, removing a significant fraction of its absorption feature in the star’s spectrum. The effect of this variable CO abundance on the infrared light curve and colour is studied in great detail by Scowcroft et al. (2016a), and shown in the right panel of Figure 7. Since at 3.6 m the stellar spectrum is largely unaffected by CO absorption, the light curve is smooth during the entire pulsation cycle. At 4.5 m, however, the formation of the CO molecule sets a ceiling in how bright the star could become at maximum light, flattening the light curve, until CO is destroyed near minimum radius. This behaviour leads to a well defined negative-slope period-colour-metallicity relation for Classical Cepheids with period between and 60 days (), characterised by Scowcroft et al. (2016a) for stars in the Galaxy, LMC and SMC. For Cepheids with period shorter than 6 days the relation flattens, due to the higher effective temperature () that prevents the formation of CO spectral headbands for the entire pulsation cycle. The period-colour relation for ultra-long period Cepheids ( greater than days) is instead dramatically inverted (large positive slope). The reasons why this happen is not well understood. Several lines of evidence points towards the effects of lower rotation, suppressing rotational mixing that in turn would decrease the abundance of CNO elements in the photosphere (Anderson et al., 2014), as well as the lack of first dredge-up for Cepheids in this period range (Bono et al., 2000b). Both phenomena would prevent the formation of significant amount of CO.
Based on this analysis, Scowcroft et al. (2016a) concluded that the IRAC band at 3.6 m is the safest choice for measuring precision Cepheids distances in the MIR, since at this wavelength the effects of metallicity (in terms of absorption features from CO and other molecules) are minimised. The 4.5 m band dependence on a variable CO absorption, on the other hand, suggests the enticing possibility of adopting the period-colour-metallicity relation as a metallicity indicator. The expected dispersion of such indicator appears to be on the order of dex Scowcroft et al. (2016a), comparable with the current precision in [Fe/H] measurements for individual Cepheids in the Galaxy, LMC and SMC.
2.2.3 Mid-IR excess around Cepheids
Cepheids are intermediate mass stars (typically 4-6 ), and as such they enter the core He-burning phase at a relatively young phase, before they have the chance to wander far from the regions where they form. This means that a large fraction of them is found at small Galactic latitude (of the 10 Cepheid calibrators with HST parallax, all except Dor are found within deg from the Galactic plane). As a consequence, Galactic Cepheids, as well as Cepheids detected in other galaxies seen edge-on, are projected over regions with high extinction (in the visible) or contaminated by “cirrus” of diffuse infrared emission. MIR is the ideal wavelength range to limit the impact of both effects, since at these wavelengths extinction is minimised (see discussion above) while the emission from galactic filaments starts to pick-up only at wavelengths longer than m. The situation is however different in case of circumstellar emission, produced by circumstellar dust heated at temperatures warm enough to emit copious amount of thermal MIR radiation.
Circumstellar dusty envelopes can occur for two different reasons: i) the dust is part of a cloud that formed independently from the star, and it just so happen that the star drifted into it, or ii) the dust condensed in an outflow originating from the star. The existence of outflows from Cepheids is controversial, but can be related to the “Cepheids mass discrepancy” mentioned before. As was first noted more than 40 years ago by Fricke et al. (1972), current evolutionary models predict Cepheid masses 10-15% larger than masses derived from pulsation theory (see e.g. Caputo et al. 2005; Keller et al. 2006) or measured from Cepheids in binary systems (Evans et al., 2008; Pietrzyński et al., 2010; Evans et al., 2013). This discrepancy could be at least in part explained if the mass deficit is the result of mass loss before or during the Cepheid phase (see e.g. Neilson et al. 2012 and references therein). Mass loss during earlier evolutionary phases could result in circumstellar clouds still lingering as the star enters the instability strip, while active outflows would interact with the surrounding interstellar medium (ISM), piling-up ISM dust and gas in a “bow shock” aligned with the direction of motion of the star. It is not clear what could be triggering Cepheids mass loss: perhaps a pulsation-driven wind, or the influence of a close-in binary companion (Anderson et al., 2015). This range of phenomena is however observed in several Cepheids and should be taken into consideration when assessing the accuracy of the Cepheids PL relation (and its calibration with Galactic Cepheids) at MIR wavelengths.
The extreme case of a Cepheid embedded in a thick circumstellar envelope is RS Pup, a long period Classical Cepheid ( days) located at the centre of a well known reflection nebula across (Westerlund, 1961). The nebula is also bright at infrared wavelengths as short as 5.8 m (McAlary et al., 1986; Kervella et al., 2009; Barmby et al., 2011). The bulk of this nebula is believed to be comprised of cold, dusty ISM material, shaped by a stellar wind that originated from the star, possibly in the earlier evolutionary phase when RS Pup was a rapidly rotating B dwarf (Kervella et al., 2009). Warm emission detected at 10 m, however, hints to the possibility of ongoing mass loss (Kervella et al., 2009; Gallenne et al., 2011).
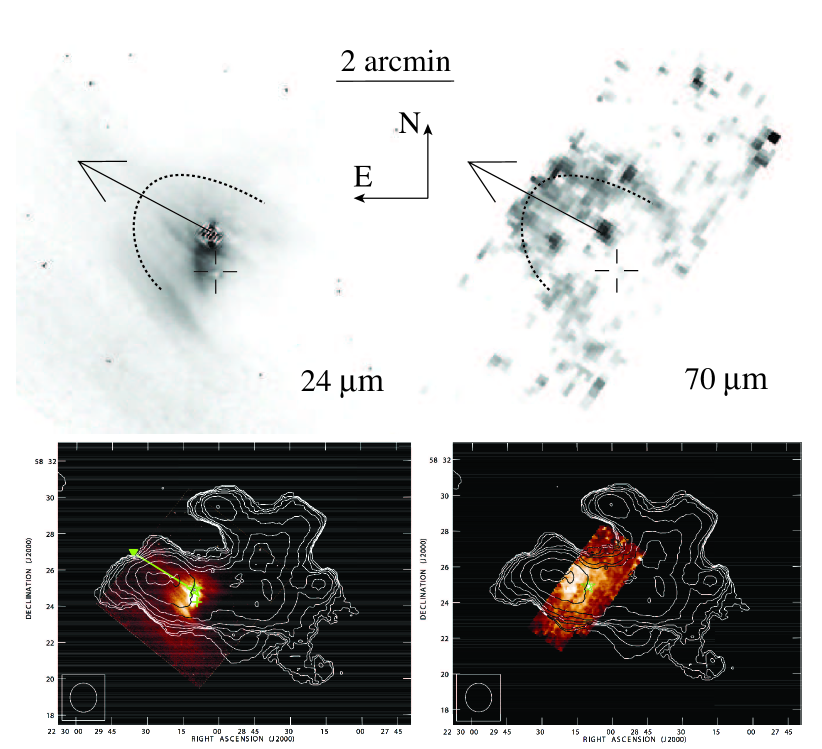
The most convincing case for ongoing mass loss is however offered by the Cepheid class namesake itself, Cep. This star has been found to posses a bright circumstellar nebula, extending as much as ( at the distance of the star; top panels in Figure 8, Marengo et al. 2010). Observed at 70 m, the shape of the nebula resembles a bow shock aligned with the space velocity of the star. Subsequent radio observations with the VLA found that this morphology repeats at much larger spatial scales ( or 1 pc) in the 21-cm H i line (Matthews et al., 2012), consistent with a stellar wind with outflow velocity of km/s. Combined with the infrared observations, this detection suggest the presence of ongoing mass loss with a rate up to –/yr. The estimated gas to dust mass ratio is very high ( Marengo et al. 2010; Matthews et al. 2012), suggesting that the dust-poor wind is originated by some dynamic process different than the dust-driven winds found in Miras. Assuming that a significant portion of this circumstellar gas is originating from the star (as opposed to have been collected from the local ISM), such mass loss rates can help explain the Cepheids mass discrepancy described earlier.
Excess emission, if not taken properly into account, could bias Cepheid distances, or the calibration of the empirical Leavitt law, by artificially increasing the infrared brightness of the stars. However, it appears to be a relatively rare phenomenon, with less than % of Cepheids surveyed with Spitzer showing any evidence of infrared emission Barmby et al. (2011) (this result is supported by a similar rate of detection of H i nebulae in a follow-up VLA survey, Matthews et al. 2016). Even in extreme cases like RS Pup, the infrared excess emission is not detected at wavelengths shorter than 5.8 m: this suggests that any bias due to circumstellar emission is not affecting observations at 3.6 and 4.5 m, which remain safe for determining distances with PL relations with the techniques explained in 2.2.1.
2.2.4 The future of MIR Cepheid distances
The advent of MIR space astronomy has finally opened the possibility of measuring accurate Cepheid distances at wavelengths less affected by interstellar extinction, metallicity effects and contamination from interstellar and circumstellar thermal emission. The band appears to be the ideal wavelength range for this measurements, lacking the presence of variable CO absorption that is instead affecting in the band. The CHP project (Freedman et al., 2011) has demonstrated that the 3.6 m Cepheid PL relation can be effectively used to measure the Hubble constant and other cosmological parameters with a precision comparable to the accuracy (better than %) in Planck’s CMB and BAO analysis (Freedman et al., 2012). A “tension” between Cepheid distances and the Planck analysis, however, remain, and needs to be investigated for its potential to reveal new physics in the accepted CDM model. Accurate (as) parallaxes for hundreds of Galactic calibrators, expected by 2022 with the final Gaia data release, will provide the next significant jump in reducing the systematic errors in the calibration of the Cepheid Leavitt law. Further improvement will come with the launch, in 2018, of the James Webb Space telescope (JWST), whose NIRCam instrument will allow band observation of Cepheids in host galaxies of Supernovæ Type Ia beyond the Local Group. Combined together, these improvement will enable 1% measurements of as well as competitive measurements of other cosmological parameters such as the equation of state of dark energy , key to validate current cosmological models (Gardner, 2012).
2.3 Linearity of the Cepheids PL Relation
The linearity of the Cepheid PL relation has been under debate in the past decade with empirical evidences of fundamental-mode Cepheid PL relation displaying a break at 10 days in optical bands (Tammann et al., 2003; Kanbur & Ngeow, 2005; Ngeow et al., 2005; García-Varela et al., 2013). It was suggested that the LMC Cepheid PL relation is best described by two separate slopes for short ( days) and long ( days) period Cepheids, therefore, a “Non-linear relation”. The argument for a fiducial break period at 10 days was attributed to the resonance , in the normal mode spectrum (Simon & Lee, 1981; Ngeow et al., 2005). The non-linearity analysis of PL relations was extended to multiple wavelengths (Ngeow et al., 2008), advocating that PL relations at longer wavelengths are supposedly linear, being less sensitive to metallicity and extinction. Recently, a statistical framework to study the non-linearity in LMC Cepheid PL relations at multiple wavelengths was developed (Bhardwaj et al., 2016a) and it was found that optical band fundamental-mode Cepheid PL relations are indeed non-linear at 10 days while NIR PL relations provide evidence of a statistically significant non-linearity around 18 days.
In this section, we will discuss the application of a statistical framework on the multiwavelength data for Cepheids in the LMC. We use optical and band mean magnitudes for Cepheids in the LMC from the Optical Gravitational Lensing Experiment (OGLE - III) survey (Soszyński et al., 2008). We include 1849 fundamental (FU) and 1238 first-overtone (FO) mode Cepheids in this analysis. The near-infrared () mean magnitudes for 775 FU and 474 FO mode Cepheids are adopted from LMC near-infrared synoptic survey (Macri et al., 2015). The extinction corrections were applied using reddening maps of Haschke et al. (2011) and Cardelli et al. (1989) extinction law.
2.3.1 The Statistical Framework
We discuss the test-statistics in brief. The detailed mathematical formalism is provided in Bhardwaj et al. (2016a).
F-test :
The F-test works under the null hypothesis that a single regression line over the entire period range is a better model to fit the data. The alternative hypothesis consists of a full model with two different slopes for short and long period Cepheids:
| (3) | |||||
where is the extinction-corrected mean magnitude and is the fiducial break period. The difference in the residual sum of squares of the two fits, given the number of degrees of freedom, is estimated as the observed F-statistics. This F-value is compared with theoretical F-distribution with 95% significance level. An observed F-value greater than the theoretical F-value leads to the rejection of null hypothesis.
Random-walk :
The robust non-parametric random-walk test generates the distribution of the residuals from the data itself. At first, the data is sorted according to the period and a single regression line is fitted over the entire period range. The amplitude of the partial sum of residuals is taken as observed R-statistics. If the partial sums are a random-walk, R will be small, suggesting a linear relation. In order to generate a theoretical R-distribution, the residuals are permuted times to estimate R-values. The fraction of permuted R-values that exceed the observed R-value, gives the probability of acceptance of a linear relation.
Testimator:
For testimator analysis, the sample is sorted and divided into several subsets of period bins. Slope of the PL relation in the first subset is adopted as initial estimate for the next subset. The null hypothesis is that the two slopes under consideration are equal. The standard -test is applied to test the consistency of the slopes. If the slopes are equal, a smoothed slope over the two subsets is adopted as initial estimate for next subset. The process is repeated for all subsets unless the null-hypothesis is rejected.
Segmented lines and the Davies test:
An alternative approach to the problem of identifying the existence of a break point is presented in Muggeo (2003). The method first performs a linear piecewise regression considering the existence of the break. Thereafter, the Davies test is used to evaluate if the two segments are different enough to account for two separate linear behaviours. The method is implemented in the R package segmented (Muggeo, 2008).
2.3.2 Analysis and results
| Band | TM | ||||||||
|---|---|---|---|---|---|---|---|---|---|
| FU | |||||||||
| 1.004 | -2.7430.032 | 0.172 | -2.2850.185 | 0.232 | 0.002 | 0.168 | Reject | 0.006 | |
| 1.014 | -2.9730.022 | 0.117 | -2.6280.127 | 0.161 | 0.001 | 0.128 | Reject | 0.003 | |
| 1.262 | -3.1180.031 | 0.109 | -3.3360.071 | 0.144 | 0.004 | 0.037 | Reject | 0.003 | |
| 1.259 | -3.1060.026 | 0.090 | -3.3200.060 | 0.120 | 0.001 | 0.044 | Reject | 0.000 | |
| 1.275 | -3.1920.022 | 0.079 | -3.3610.055 | 0.111 | 0.003 | 0.076 | Reject | 0.001 | |
| FO | |||||||||
| 0.446 | -3.4100.045 | 0.187 | -2.6880.108 | 0.155 | 0.000 | 0.000 | Reject | 0.000 | |
| 0.449 | -3.4300.032 | 0.132 | -2.8940.078 | 0.112 | 0.000 | 0.000 | Reject | 0.000 | |
| 0.427 | -3.4550.064 | 0.117 | -3.1070.103 | 0.102 | 0.043 | 0.122 | Accept | 0.059 | |
| 0.422 | -3.3220.049 | 0.097 | -3.1170.075 | 0.075 | 0.136 | 0.284 | Accept | 0.156 | |
| 0.019 | -3.3030.042 | 0.087 | -3.1790.062 | 0.062 | 0.376 | 0.277 | Accept | 0.735 | |
Notes: , and refer to the break period, slope and dispersion, respectively. The subscripts and refer to the short period range and long period range, respectively. , and represent the probability of acceptance of null hypothesis i.e. linear relation. “TM” displays the results of testimator analysis: “Accept/Reject” represents a linear/non-linear relation.
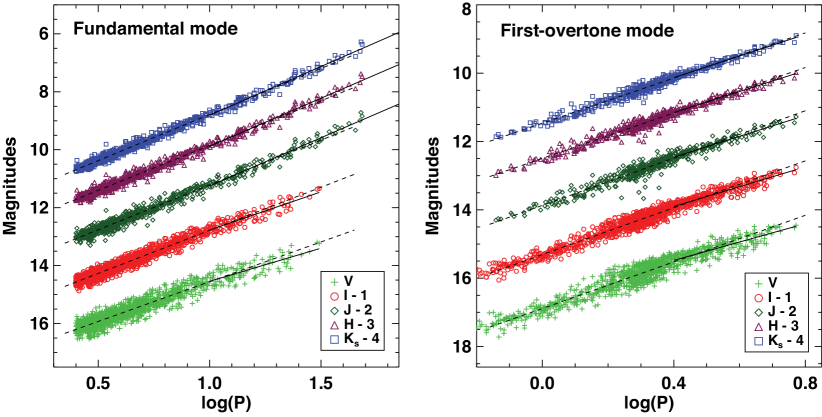
The optical and near-infrared band PL relations for FU and FO mode Cepheids are displayed in Figure 9 and the results of statistical analysis are presented in Table 1. If the probability of the acceptance of null hypothesis is less than 0.05, the PL relation under consideration is non-linear. For FU mode Cepheids, optical band PL relations are found to be non-linear at 10 days, according to the -test, testimator and the Davis test. The random walk does not provide evidence to support a non-linearity at significance level. If more than two statistics suggest a break, we consider the PL relation to be non-linear. At NIR wavelengths, all four test statistics suggest a statistically significant deviation in the slope for short and long period Cepheids, except for random walk in band. Interestingly, the break period is around in the near-infrared PL relations. It is important to note that a distinct variation in Fourier amplitude parameters around 20 days was also observed for redder bands as compared to optical bands Bhardwaj et al. (2015). This suggest that the changes in light curve structure can also be associated with these non-linear features in PL relations. Although the multi-wavelength LMC PL relations exhibit a non-linearity, the SMC PL relations are found to be linear at 10 days (Ngeow et al., 2015a).
We also test the FO Cepheid data in the LMC for possible statistically significant non-linearities. The optical band PL relations present evidence of a non-linearity based on all four test statistics. The Davis test suggests a break at days in PL relations. The evidence of non-linearity decreases for longer wavelengths and bands are found to be linear with all four test-statistics. The robustness of these results was also validated under various assumptions, such as independent and identically distributed random observations, normality of residuals and homogeneity of variances.
The LMC FU mode Cepheid sample was used together with Cepheids in supernovae host galaxies to estimate the impact of these non-linearities on the distance scale (Bhardwaj et al., 2016a). The additional Cepheid and supernovae data was adopted from the SH0ES (Supernovae and for the Equation of State of dark energy) project (Riess et al., 2011). The Cepheids in the LMC were calibrated using the late-type eclipsing binary distance (Pietrzyński et al., 2013) and a global matrix formalism was adopted similar to SH0ES. The global slope of Cepheid PL relations is found to be consistent with linear version of LMC PL relations. However, the two slope model of LMC PL relations provides a stronger constrain on the global slope and the metallicity coefficients. This model was also adopted in recent SH0ES paper with additional supernovae hosts, leading to a 2.4% local determination of Hubble constant.
2.3.3 Conclusions
The statistical analysis of non-linearities in the LMC Cepheid PL relations provides evidence of a break in fundamental-mode Cepheid PL relations at wavelengths. The first-overtone mode Cepheids display a break at 2.8 days, only at optical wavelengths. The observed non-linearities suggest a correlation with sharp changes in the light curve structure of Cepheids. This needs a theoretical investigation to look for additional resonance feature in the light curves for Cepheids. The global slope for Cepheids in SH0ES galaxies using the linear and non-linear versions of the LMC PL relations are found to be very similar. Therefore, these non-linearities will not have any statistically significant impact on the distance scale or the value of Hubble constant. This is due to the fact that the dispersion of the HST-based PL relations for Cepheids in supernovae host galaxies ( mag) is more than three times the dispersion of the calibrator LMC PL relation. Therefore, such small but statistically significant changes in slope of PL relation may only have a major impact on distance parameters with more precise PL relations, for example with the JWST.
2.4 Metallicity Effects
The metallicity of a star usually affects its luminosity to a certain degree and there is no reason to believe that Cepheids should differ from other stars in this regard. The question is if the effect is significant and, if significant, whether it can be properly corrected for. Riess et al. (2011) pointed out that to determine the Hubble constant to better than 2% one of the major obstacles is the effect of metallicity on the Cepheid luminosities.
In preparation for the HST Key project on the extragalactic distance scale (Freedman et al., 2001) the metallicity effect was determined empirically by comparing high metallicity Cepheids in the inner parts of M101 with low metallicity Cepheids in the outer part of the galaxy (Kennicutt et al., 1998). They found an effect of mag/dex in the band, metal-poor stars being brighter. Many different empirical efforts trying different avenues followed in the next years but even the sign of the effect was disputed (e.g. Romaniello et al. 2008).
The approach used by Kennicutt et al. (1998) which relies on extragalactic Cepheids has the obvious advantage that the stars are at the same distance and span a large range of metallicities but it suffers from the problem of disentangling reddening and blending effects and the necessity to infer the metallicities from the local gas in the galaxy. The Gaia satellite will surely provide very accurate distance to galactic Cepheids but the sample will be limited to Cepheids with metallicities not too different from solar, so only a limited metallicity range can be studied and this will eventually limit the accuracy with which the slope of the period-luminosity relation can be determined.
Here we present the status of an alternative approach based on the infrared surface brightness method, which is a Baade-Wesselink type method. In this approach the stellar luminosity is determined directly for each star individually and a PL relation can be constructed on this basis. The added advantage of this method is that it can be applied to Cepheids not only in the Milky Way but also in the Magellanic Clouds (e.g. Storm et al. 2004). In this way we can compare stars spanning a significant range of metallicities in a direct way: in fact we can delineate period-luminosity relations for Cepheids of three different metallicities representing the young populations in the SMC, LMC and solar neighbourhood.
2.4.1 The near-IR surface brightness method
The IRSB method is a geometrical method as it relates the stellar angular diameter, , at a given phase, , with the stellar radius, , and the distance, through
| (4) |
If we can observe the angular diameter, , and the radius variation, at different phases we can solve the equation for the two variables, radius , and distance .
The angular diameter is related to the stellar surface brightness , through the relation . Barnes & Evans (1976) found that a linear relation between colour and stellar surface brightness could be established. Fouqué & Gieren (1997) expanded this to the NIR colour, based on interferometric measurements of static stars. This relation was refined by di Benedetto (1998) and Kervella et al. (2004) first deriving the relation:
| (5) |
based on interferometric measurements of Cepheids.
Next we can measure the absolute radius variation , by integrating the pulsation velocity curve. This differs from the directly observed radial velocity curve as it takes out the systemic velocity , and correct for the projection effect as the radial velocity measures a weighted mean across the surface of the star and not just the velocity exactly on the point nearest to the observer. The projection effect is corrected by multiplying by the so-called -factor. For a more detailed discussion of the calibration of the -factor, see Storm et al. (2011a). This can then be written:
| (6) |
These equations shows that all that is needed is good light curves in and and a good radial velocity curve. These are all obtainable for stars in the Milky Way as well as in the Magellanic Clouds and potentially in M31.
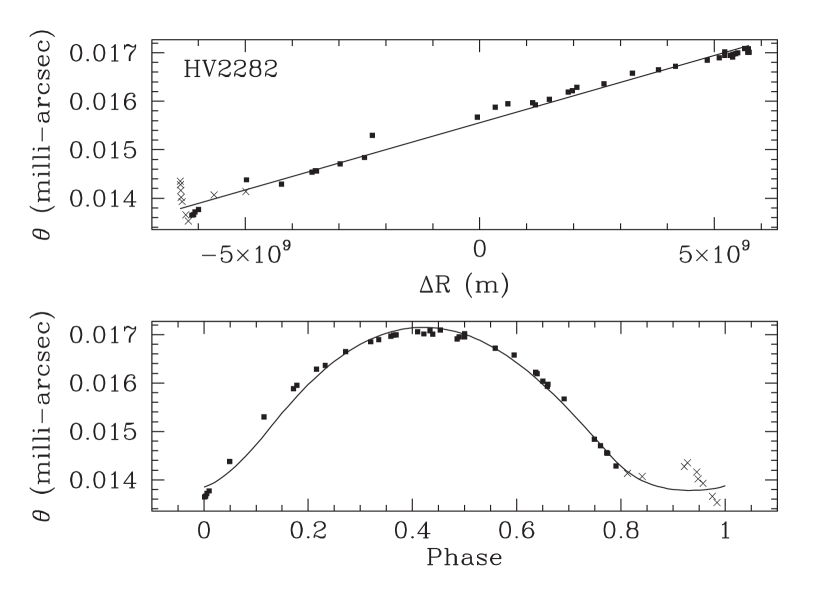
In Figure 11 an example of a fit to Equation 4 for the LMC star HV2282 is shown. We note that the phase interval between 0.8 and 1.0 is usually disregarded as the stars often shows certain spectral lines in emission suggesting shocks passing through the atmosphere. This can lead to the surface-brightness relation being invalid and it can affect the radial velocity measurement at some level.
2.4.2 The data set
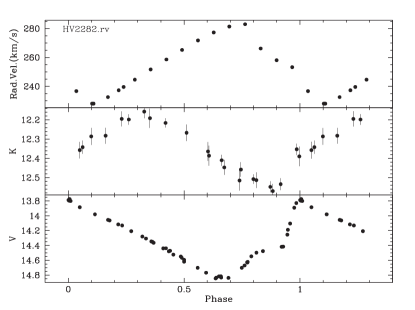
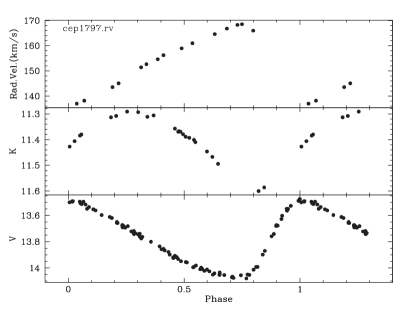
Storm et al. (2011a) presented an analysis based on 76 Milky Way stars, 36 LMC stars and 5 SMC stars. In Figure 11 (left panel) a typical data set for one of these LMC stars is shown. The project has been expanded to include an additional 25 SMC stars to bring down the error bar on the lowest metallicity data point. In Figure 11 (right panel) an example of this new data set is shown. The data acquisition is still in progress so the phase coverage will eventually be better, but the high quality of the data is evident. The optical data is taken from the OGLE-IV Udalski (2015) survey while the band data is being acquired at the ESO-NTT and the radial velocities with HARPS at the ESO 3.6m telescope.
In addition to the work on the SMC Cepheids we have also been acquiring new accurate radial velocity curves for more than 50 Milky Way Cepheids for which good and band light curves exist. This should also further constrain the most metal rich data point.
2.4.3 The Period-Luminosity relations at different metallicities
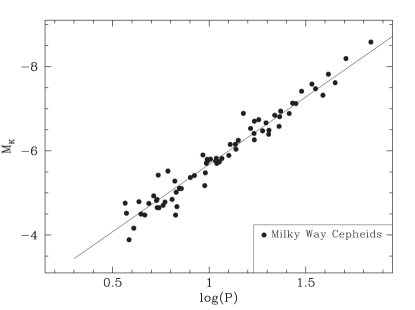
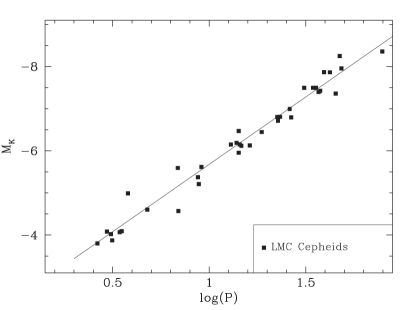
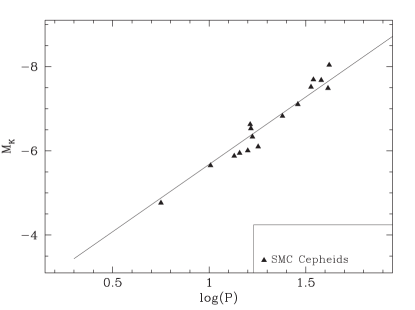
In Figure 12 (top panels) we have plotted the PL relations in the band for the samples of Milky Way and LMC stars from Storm et al. (2011a, b). In both plots the line over-plotted is the best fit to their complete sample of stars. It is evident that the two relations are very similar. In Storm et al. (2011b) only 5 SMC stars with a period of around 15 days were available so the low metallicity relation was poorly constrained. Work is now ongoing to remedy this limitation by extending the sample by an additional 25 stars (PI: Gieren). In the bottom left panel of Figure 12 we plot the preliminary PL relation for the sub-sample of stars where the data is sufficient to perform an initial analysis. Again the over-plotted line represents the fit to the global sample in Storm et al. (2011b). We note that at least the preliminary agreement is very good.
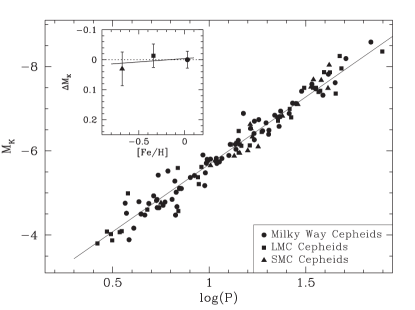
We can then determine the offset for each sample at a period of 10 days with respect to the reference relation in each of the plots. We have adopted metallicities of [Fe/H] =+0.03 for the Milky Way, for the LMC, and for the SMC, following Luck (1998). In the last panel of Figure 12 we have over-plotted all the stars with the reference relation. In the inset the individual offsets for the three samples is plotted against the adopted metallicity. It is evident that the effect of metallicity in the band appears to be small, consistent with zero, and that the error estimate on the slope will be significantly less than 0.1 mag/dex. The final estimate and associated error bar will have to wait the completion of the data acquisition and final analysis, but the preliminary results are looking very promising.
3 Miras
Mira variables are M-type stars pulsating with periods of 100 to 1000 days, showing high mass loss rates (yr-1). They are thought to be experiencing a pulsating phase while on the asymptotic giant branch (AGB) evolutionary phase. Mira variables are also well known for their remarkable periodicity and its large amplitude in V-band magnitude. Mira variables in the LMC exhibit a PL relation between their pulsation period and K-band apparent magnitude (). This PL relation allow these stars to be used as distance estimators, and accurate distance of these sources helps us to understand the nature of their variability.
Although a narrow PL relation for Miras in the LMC was found by Feast et al. (1989), a similar relation for the Galactic Miras has not been precisely obtained because of large errors in absolute magnitudes. Such large errors arise from ambiguities of absolute magnitudes suffering directly from errors in distances estimations. van Leeuwen et al. (1997) reported the relation of Galactic Miras based on the parallax measured with Hipparcos satellite (Perryman et al., 1997). Although the Hipparcos mission has been an historical milestone in astrometry, distances of the Galactic Mira variables are too far for an accurate determination of their parallaxes. Therefore, a calibration of the PL relation based on Galactic Mira variables is not well established even today.
The very long baseline interferometer (VLBI) consists of a number of antennas separated by several thousand Kilometers. Angular resolution of the order of milli-arc seconds is obtained by imaging synthesis of VLBI at radio wave bands of cm to mm wavelength. Because of its high resolution, the VLBI has a strong advantage for parallax measurements compared to other current astronomical instruments. Using absolute magnitudes derived from accurate distances measured with astrometric VLBI observations, we can investigate precise PL relation in the Galaxy. In this sub-section, we present our recent on-going efforts to calibrate the PL relation of Galactic Mira variables using the VLBI Exploration of Radio Astronomy (VERA) array.
3.1 Source selection and single-dish monitoring
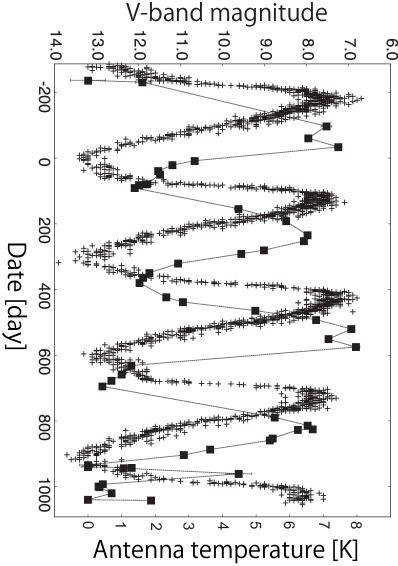
Mira variables show maser emission around them. Maser stands for Microwave Amplification by Stimulated Emission of Radiation and hence is a non-thermal radiation representing very compact structure and high brightness temperature. Many different masers occur in astrophysical environments. SiO, H2O, OH, and CH3OH masers are detected around evolved stars or star forming regions. They are frequently used as probes to study kinematics of matters around the stellar objects. The milli arc second level high resolution achieved by the VLBI technique is well suited for observation of the maser emissions. H2O maser emission around Mira variables is so bright and compact that they can be a good target for VLBI astrometry. But the intensity of the maser emission usually shows large variability. Like the periodic pulsation at optical band, intensity of the maser emission sometimes represents quasi-periodic variability with the same pulsation periods defined in the visible. Figure 13 shows a result from monitoring the Mira variable ‘R UMa’. This is a case that represents a good period consistency in optical ( band) and maser emission (22 GHz).
In order to derive the parallax from maser emission, we have to find sources with bright maser emission (all through their cycle) enough to be detected with the VLBI method. We are monitoring a sample of candidate targets with the IRIKI 20 m telescope in VERA array with one month interval. Early results of the monitoring program are reported by Shintani et al. (2008). The results from the single-dish monitoring are used to select the sample for our VLBI program.
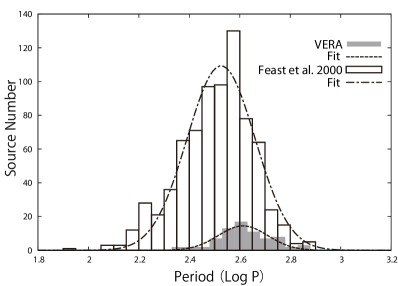
The distribution of the pulsation periods of our targets is presented in Figure 14. Open blocks indicates 800 nearby Mira variables studied by Feast & Whitelock (2000). Filled blocks indicate the sources of our VLBI study which are accompanied by H2O maser emission. We fitted these two distributions with Gaussian models and obtained peak periods of 338 days () and 407 days () for optically defined Miras and maser emitting Miras, respectively. Although there is a difference between two peaks, a selection bias can not be ruled out at present. More careful consideration about both populations is needed before we conclude them as two separate populations.
The diffuse and weak components of the maser emission is resolved by the small synthesised beam of the VLBI. Therefore, it is important to find target sources that have bright and compact components that can be detected with the VLBI method. As a threshold of a total power intensity, 10 Jy is adopted for detection in our VLBI monitoring program. We are observing 250 maser sources to find targets whose maser emission stably shows intensity with 10 Jy. From the point of view of pulsation periods, sampling a wide periods range is required to obtain better solutions of the PL relation.
3.2 Astrometric VLBI observations with VERA
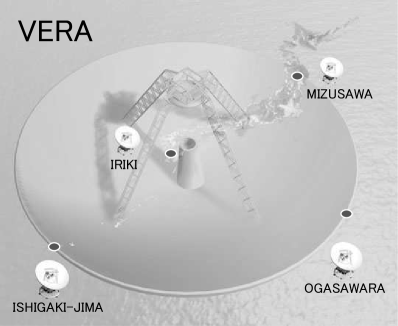
We started a series of VLBI observations with VERA after a careful selection of the targets. The VERA array consists of four antennas with 20 m aperture located in Japan (Kobayashi, 2003). The maximum baseline length is 2300 km (Figure 15).
We observe target maser source and reference continuum source simultaneously using the dual beam system installed in the VERA antenna (Kawaguchi et al., 2000). At first, we solve phase solutions using a reference source, which usually is a bright QSO. Data reduction of the target source can be realised by applying the phase solution from the QSO to the target. Two dimensional Fourier transformation of the data provide a map of the target maser source, from which we measure the positions of the maser spots. Since core emission of QSO can be treated as a position reference fixed to the sky plane in milli arc second scale astrometry, the motion of the maser spots detected on the phase reference map can be considered as a combination of the linear proper motion and parallactic oscillation. As the effect of the solar motion is same in the target and reference source, this motion is cancelled out in the phase referencing technique. By numerical fitting of the data using a function consisting of an oscillating term and a linear term, we derive the parallax. We note that the linear motion term is a combination of internal motion of the maser spots and systemic motion of the star. Both these motions are treated as linear motion in the data analysis. Typically, we need 1.5 to 2.0 years to measure a parallax for one source. As part of this program we have observed 33 sources, with 6 more under monitoring. Table 2 shows the target sources of our study. Coordinates, variable types, pulsation periods, and the logarithms of the periods are also presented.
| ID. | Source | RA | DEC | Period | Maser |
|---|---|---|---|---|---|
| [ h m s ] | [ ∘ ’ ” ] | [day] | |||
| 1 | SY Scl | 00 07 36.25 | 25 29 39.9 | 413 | H2O |
| 2 | WX Psc | 01 06 25.984 | 12 35 53.05 | 660 | H2O |
| 3 | RU Ari | 02 44 45.50 | 12 19 03.0 | 354 | H2O |
| 4 | IK Tau | 03 53 28.87 | 11 24 21.7 | 470 | SiO |
| 5 | V637 Per | 03 54 02.28 | 36 32 17.6 | H2O | |
| 6 | R Tau | 04 28 18.0004 | 10 09 44.770 | 321 | H2O |
| 7 | BX Eri | 04 40 32.754 | 14 12 02.39 | 165 | H2O |
| 8 | T Lep | 05 04 50.84569 | 21 54 16.5172 | 368 | H2O |
| 9 | BW Cam | 05 19 52.56 | 63 15 55.8 | H2O | |
| 10 | RW Lep | 05 38 52.737 | 14 02 26.84 | 145 | H2O |
| 11 | BX Cam | 05 46 44.29 | 69 58 24.2 | 454 | H2O |
| 12 | U Ori | 05 55 49.16994 | 20 10 30.6872 | 368 | H2O |
| 13 | AP Lyn | 06 34 33.92 | 60 56 26.2 | 450 | H2O |
| 14 | U Lyn | 06 40 46.487 | 59 52 01.64 | 434 | H2O |
| 15 | NSV17351 | 07 07 49.38 | 10 44 05.9 | H2O | |
| 16 | Z Pup | 07 32 38.05674 | 20 39 29.0936 | 509 | H2O |
| 17 | OZ Gem | 07 33 57.75 | 30 30 37.8 | 598 | H2O |
| 18 | QX Pup | 07 42 16.947 | 14 42 50.20 | 551 | H2O |
| 19 | V353 Pup | 07 46 34.151 | 32 18 16.26 | H2O | |
| 20 | HU Pup | 07 55 40.160 | 28 38 54.84 | 238 | H2O |
| 21 | R Cnc | 08 16 33.82789 | 11 43 34.4557 | 362 | H2O |
| 22 | X Hya | 09 35 30.26615 | 14 41 28.6002 | 301 | H2O |
| 23 | R LMi | 09 45 34.28304 | 34 30 42.7839 | 372 | H2O |
| 24 | R Leo | 09 47 33.48791 | 11 25 43.6650 | 310 | SiO |
| 25 | R UMa | 10 44 38.47292 | 68 46 32.7016 | 302 | H2O |
| 26 | VX UMa | 10 55 39.88 | 71 52 09.8 | 215 | H2O |
| 27 | HS UMa | 11 35 30.70408 | 34 52 04.1775 | 517 | H2O |
| 28 | S Crt | 11 52 45.09863 | 07 35 48.0810 | 155 | H2O |
| 29 | T UMa | 12 36 23.46459 | 59 29 12.9746 | 257 | H2O |
| 30 | U CVn | 12 47 19.61 | 38 22 30.5 | 346 | H2O |
| 31 | W Hya | 13 49 01.99810 | 28 22 03.4881 | 361 | H2O |
| 32 | RU Hya | 14 11 34.39861 | 28 53 07.4089 | 332 | H2O |
| 33 | RX Boo | 14 24 11.62662 | 25 42 13.4091 | 278 | H2O |
| 34 | RS Vir | 14 27 16.38997 | 04 40 41.1432 | 354 | H2O |
| 35 | FV Boo | 15 08 25.766 | 09 36 18.19 | 306 | H2O |
| 36 | Y Lib | 15 11 41.30861 | 06 00 41.3727 | 276 | H2O |
| 37 | S CrB | 15 21 23.95608 | 31 22 02.5730 | 360 | H2O |
| 38 | WX Ser | 15 27 47.043 | 19 33 51.71 | 425 | SiO |
| 39 | SW Lib | 15 55 33.42 | 12 51 05.5 | 292 | H2O |
| 40 | FS Lib | 16 00 23.76 | 12 20 57.6 | 415 | H2O |
| 41 | IRC10374 | 18 43 36.47 | 13 57 22.8 | 514 | H2O |
| 42 | IRC20540 | 19 08 54.62 | 22 14 19.4 | 510 | H2O |
| 43 | SY Aql | 20 07 05.40 | 12 57 06.3 | 356 | H2O |
| 44 | SV Peg | 22 05 42.08385 | 35 20 54.5280 | 145 | H2O |
| 45 | R Peg | 23 06 39.16689 | 10 32 36.0892 | 378 | H2O |
| 46 | R Aqr | 23 43 49.46201 | 15 17 04.1385 | 387 | SiO |
| 47 | R Cas | 23 58 24.87336 | 51 23 19.7011 | 430 | SiO |
3.3 Results of our observation with VERA
The main goal of our VLBI observations with VERA is measuring the parallaxes (and hence, the distances) to our sources. Once the distance is determined, we study the properties of the target sources and their PL relation. Here, we present some results on stellar properties, such as effective temperature, size of the photosphere, and kinematics of the maser spots. A preliminary result of the PL relation study is also presented.
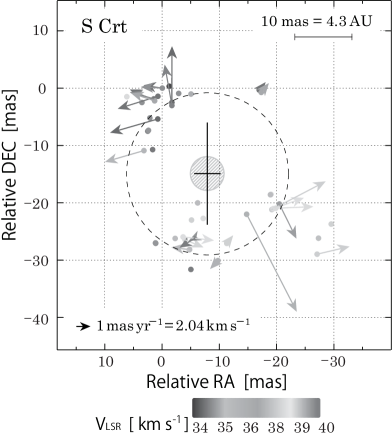
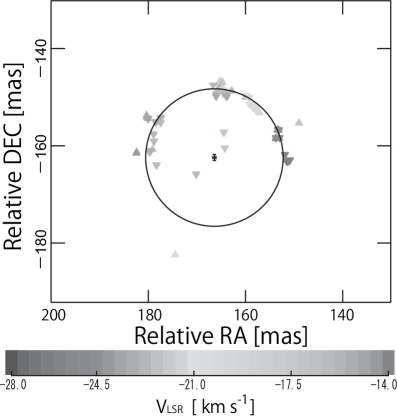
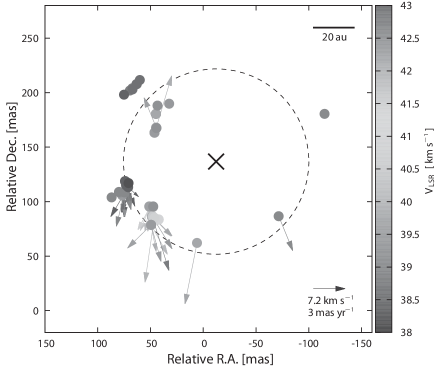
3.3.1 Semi-regular variable S Crt
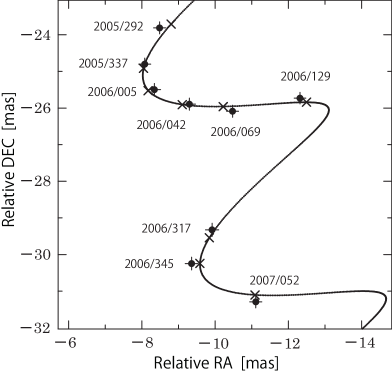
Figures 16 and 17 show the results of our VERA observation of the semi-regular variable S Crt. We see a clear serpentine motion of a maser spot on the sky plane (Figure 16). Since the motion of the maser spot is a combination of the linear proper motion and the parallactic ellipse, a resultant motion is observed as the curvature. A parallax of 2.330.13 mas was obtained, and it was converted to the distance of 430 pc. From these series of our VLBI observations, we also estimated the motion of dozens of maser spots in a fixed system around the central star (Figure 17). This figure shows the distribution of maser spots on an area of 40 40 mas2 ( 17 17 au2). The distribution of the maser spots was found to be relatively compact as much as 10 au in diameter. A cross symbol on the map centre indicates the position of the central star, estimated from the distribution and motions of the maser spots. Outwards motions and inhomogeneous distribution of maser spots are described in Nakagawa et al. (2008). Aringer et al. (1999) determined an effective temperature of the photosphere () of S Crt to be 3097100 K by fitting two blackbodies to its infrared spectrum. Another temperature of 496 K was attributed to the circumstellar gas and dust shell. A shaded circle at the center indicate the photosphere size as estimated from the effective temperature of the photosphere () and observed infrared magnitudes. The estimated photosphere radius () is cm (26020 ). If we assume that the optical magnitude variation is attributed only to the photospheric radius variation and also assume a constant temperature, then an acceptable radius range of 213 – 309 can be estimated. In previous studies by Haniff et al. (1995) and van Leeuwen et al. (1997), the photospheric radii of dozen of Mira variables are reported to be larger than 300 . This suggest that the photospheric radius of S Crt may be close to the lower limits to those of Mira variables reported in the literature. This result shows once more, how accurate distance measurements are important for better understanding of the difference between Mira variables and semi-regular variables.
3.3.2 Mira variable SY Scl
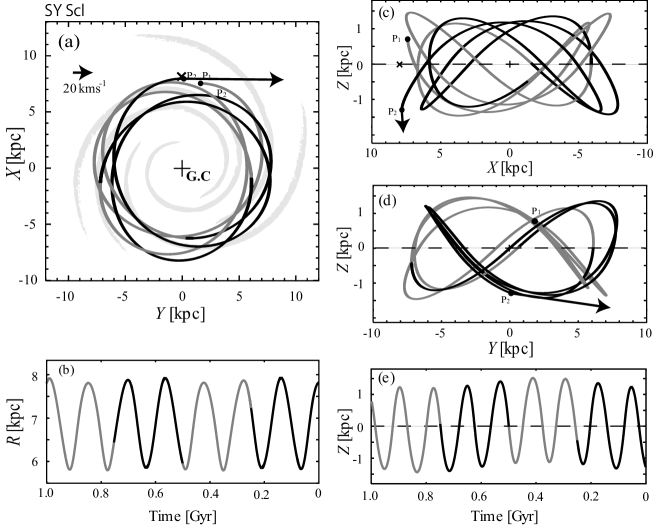
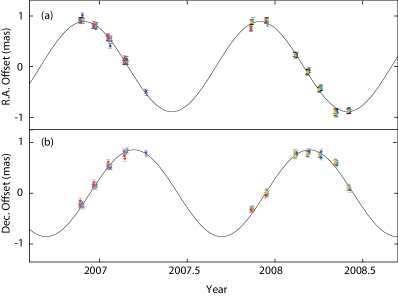
The next example of our study is related to the kinematics of a Mira variable SY Scl. The parallax of this source is measured to be 0.750.03 mas and its corresponding distance is 1.330.05 k pc Nyu et al. (2011). We also derived the source systemic motion () (5.570.04, 7.320.12) [mas yr-1].
Using these results and radial velocity of 22 km s-1 for this source, we obtained a 3-dimensional motion from a numerical simulation. This spatial systemic motion is converted to that with respect to the Local Standard of Rest (LSR), by adopting a solar motion of () (10.00.4, 5.20.6, 7.20.4) [km s-1] (Dehnen & Binney, 1998). We found the star has a motion with respect to the LSR (s, s, s) (5.20.3, 53.82.1, 33.30.3) [km s-1], where points toward the Galactic centre, in the direction of the Galactic rotation, and toward the northern Galactic pole. We can see that SY Scl is moving approximately southward from the Galactic plane with a peculiar velocity of 632 km s-1. Figure 18 illustrates the orbits of SY Scl in the () coordinate system in the last 1 Gyr. One can see that the orbit shows large distortions and oscillations of the order of kpc scale. The radial oscillation has a period of 142 Myr and shows an amplitude of 1.6 kpc (Figure 18 b). The orbit projected in the -direction has an amplitude of 1.5 kpc and the period is 120 Myr (Figure 18 e). This spatial motion suggests that SY Scl is apparently orbiting the Galaxy as a member of the Galactic thick disk rather than the thin disk.
3.3.3 Semi-regular variable RX Boo
Long period variables sometime show multiple pulsation periods. The semi-regular variable RX Boo is an example of this case. We determined a parallax of 7.310.50 mas and its corresponding distance of 136 pc. An apparent band magnitude of 1.85 is converted to an absolute magnitude of mag based on the parallax measurement. This source is reported to have different pulsation periods pulsation periods, which are summarised in table 4 of Kamezaki et al. (2012). We found that they can be classified into two typical values, 160 days and over 320 days. From the position of the source on plane, one can study the stellar structure and pulsation properties. Kamezaki et al. (2012) compared the and dual periods with the P-L relation in the Magellanic Clouds (Ita et al., 2004). Then it was found that RX Boo belongs to the sequence C (pulsating in fundamental mode) at longer period, and belongs to the sequence C’ (pulsating in first-over tone mode) at shorter period. This fact indicates that both periods of RX Boo appear to be related to the properties of RX Boo stellar structure, with each period corresponding to a different pulsation mode. Kamezaki et al. (2012) concluded that the simultaneous enhancement of two modes of pulsation may be evidence for the transient nature of RX Boo between the two modes.
3.3.4 43 GHz observation of a Mira variable R Aqr
Figure 19 represents a result of VLBI observation of SiO maser in the Mira variable R Aqr observed on 24 December 2005 (Kamohara et al., 2010). Although the observing duration of R Aqr was longer than one year, it was difficult to find long-lived maser spots which can be used to solve an annual parallax. Kamohara et al. (2010) fitted the spatial distribution of the maser spots with a ring and derived the center position at each observation. Then, by tracing the ring centres, a parallax of 4.70.8 mas was determined. The method worked well and a distance of 214 pc was derived. Several years later, Min et al. (2014) re-analysed the same data set and successfully detected one long-lived maser spot with a lifetime of 1.1 year. Then, the parallax of R Aqr was revised to the more accurate value of 4.590.24 mas with its corresponding distance of 218 pc. The two measurements show consistency within their errors.
3.4 Combined analysis of VERA and Hipparcos
With our VLBI method, it is very difficult to reveal maser spot motions at a rest frame fixed to the central star because we cannot detect any emission directly from the star. Therefore, we introduce some reasonable assumption in order to reveal the kinematics of the maser spots. For example, the isotropy of the circumstellar kinematics was usually assumed. In this subsection, we show the results obtained from a new method which combines astrometric measurements from the Hipparcos satellite (Perryman et al., 1997) and astrometric VLBI.
In VLBI observations, the detected proper motions of each maser spot (VLBI) consist of three kinds of motions, such as the Galactic rotation, a systemic motion of the star, and their circumstellar motions. As for the Hipparcos data, proper motions (HIP) also include the same kinematics as VLBI except for circumstellar motions of the maser spots. So, if we subtract VLBI from HIP, we can obtain the circumstellar motions of the maser spots on the rest frame fixed to the central star.
Figure 20 shows the distribution and circumstellar motions of maser spots around the Mira variable R UMa derived with the procedure described above. In the revised Hipparcos catalog van Leeuwen et al. (2007b), the proper motion of R UMa is reported to be HIP mas yr-1. By subtracting this value from the proper motions of each maser spot obtained from VERA observations, we obtained circumstellar motions for 38 out of all 72 maser spots in R UMa. The motions are indicated with arrows in the figure. Angular motion of 1 mas yr-1 corresponds to 2.41 km s-1 at the source distance of 508 pc. Parallax of this source was measured to be 1.970.05 mas with its corresponds to the distance of 50813 pc Nakagawa et al. (2016). Figure 21 represents oscillating terms of the parallactic motion in RA (a) and DEC (b) of the 15 maser spots.
| Source | Type | Parallax | Maser | Reference | ||||
|---|---|---|---|---|---|---|---|---|
| [mas] | [day] | [mag] | [mag] | (Parallax, ) | ||||
| RW Lep | SRa | 1.620.16 | 150 | 2.176 | 0.639 | H2O | Kamezaki et al. (2014), a | |
| S Crt | SRb | 2.330.13 | 155 | 2.190 | 0.786 | H2O | Nakagawa et al. (2008), a | |
| RX Boo | SRb | 7.310.5 | 162 | 2.210 | 1.96 | H2O | Kamezaki et al. (2012), b | |
| R UMa | Mira | 1.970.05 | 302 | 2.480 | 1.19 | H2O | Nakagawa et al. (2016) | |
| FV Boo | Mira | 0..970.06 | 340 | 2.531 | 3.836 | H2O | Kamezaki et al. (2016b), a | |
| W Hya | SRa | 10.182.36 | 361 | 2.558 | 3.16 | OH | Vlemmings et al. (2003), c | |
| S CrB | Mira | 2.390.17 | 360 | 2.556 | 0.21 | OH | Vlemmings et al. (2007), c | |
| T Lep | Mira | 3.060.04 | 368 | 2.566 | 0.12 | H2O | Nakagawa et al. (2014), c | |
| R Aqr | Mira | 4.70.8 | 390 | 2.591 | 1.01 | SiO | Kamohara et al. (2010), c | |
| R Aqr | Mira | 4.590.24 | 390 | 2.591 | 1.01 | SiO | Min et al. (2014), c | |
| RR Aql | Mira | 1.580.40 | 396 | 2.598 | 0.46 | OH | Vlemmings et al. (2007), c | |
| U Her | Mira | 3.760.27 | 406 | 2.609 | 0.27 | OH | Vlemmings et al. (2007), c | |
| SY Scl | Mira | 0.750.03 | 411 | 2.614 | 2.55 | H2O | Nyu et al. (2011), b | |
| R Cas | Mira | 5.671.95 | 430 | 2.633 | 1.80 | OH | Vlemmings et al. (2003), c | |
| U Lyn | Mira | 1.270.06 | 434 | 2.637 | 1.533 | H2O | Kamezaki et al. (2016a), a | |
| UX Cyg | Mira | 0.540.06 | 565 | 2.752 | 1.40 | H2O | Kurayama et al. (2005), a | |
| S Per | SRc | 0.4130.017 | 822 | 2.915 | 1.33 | H2O | Asaki et al. (2010), b | |
| PZ Cas | SRc | 0.3560.026 | 925 | 2.966 | 1.00 | H2O | Kusuno et al. (2013), b | |
| VY CMa | SRc | 0.880.08 | 956 | 2.980 | 0.72 | H2O | Choi et al. (2008), b | |
| NML Cyg | — | 0.620.047 | 1280 | 3.107 | 0.791 | H2O | Zhang et al. (2012), a |
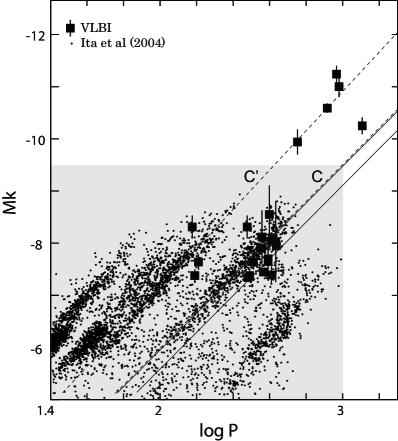
3.5 Period luminosity relation of the Galactic Mira variables
In table 3, we summarise the parallax measurements of the Galactic LPVs derived from astrometric VLBI observations in the order of increasing pulsation period. It include not only Mira variables, but also semi-regular (SRa, SRb) and red supergiants (SRc). Maser molecules used in the parallax measurements are also shown. References for parallaxes and apparent magnitudes, are given in the table 3 footnote. Absolute magnitudes are obtained from the distances and values. Only distance errors were considered for error estimation of .
Here, we define a P-L relation in the form of , where we assume a fixed slope of as determined by Ita et al. (2004). Using Miras and four semi-regular variables (RW Lep, S Crt, RX Boo, and W Hya) in table 3, we solved for the constant . Unweighted and weighted least squares fitting to the data gives of 1.090.14 and 1.450.07, respectively. In this fitting, the periods of semi-regular variables are being ’fundamentalised’ by being multiplied by two (Kamezaki et al., 2012). Since errors of a few sources are quite small compared to other source, it gives a discrepancy of 0.36 between two fittings.
In Figure 22, filled squares represent sources in table 3 on plane. The relation obtained from unweighted (upper) and weighted (lower) fitting is presented with two solid lines. Two dashed lines indicate relations derived by Ita et al. (2004) for sequence C’ (first-overtone) and (fundamental tone), respectively. The LPVs in LMC in Ita et al. (2004) are also presented with small dots in a shaded area. We used a distance modulus of 18.49 (van Leeuwen et al. 2007b, Pietrzyński et al. 2013 and de Grijs et al. 2014) to estimate values of LMC stars. Since R UMa falls on the sequence C, it is likely that the star pulsates in a fundamental mode. We find a consistency of the relations for Mira variables between our Galaxy and the LMC within the accuracy of .
In summary, we have presented the VLBI measured astrometric results of LPVs, mainly focusing on Mira variables in our Galaxy. Better calibration of period-luminosity relation of the Galactic Mira variables is important to estimate their distances free from an assumption that the relation of the LMC and our Galaxy is same. We are continuing our VLBI observations for this purpose.
4 Red Clump Stars
RC stars are intermediate-age ( 2 – 9 Gyr) core helium burning stars, which are easily identifiable in the CMD, close to the RGB, of star clusters and nearby galaxies. The location of RC in the vs CMD of a region in the SMC is shown in the upper panel of Fig 23. The absolute magnitude () vs CMD of Galactic stars which are common in Large Sky Area Multi-Object Fibre Spectroscopic Telescope (LAMOST) survey data and Gaia DR1 Tycho-Gaia Astrometric Solution (TGAS) data, with the location of RC (selection of RC stars is described in Sect.4.2), is shown in the bottom panel of Fig 23. RC stars have a mass range of 1 – 3 solar masses and are the younger and metal-rich counter parts of horizontal branch stars.
Stellar evolutionary models indicate that RC stars should have constant luminosity. The near constancy of the clump absolute magnitude is the result of He ignition in an electron-degenerate core for low mass stars. He burning cannot start until the stellar core mass attains a critical value of about 0.45 M. Hence, all these stars have similar core masses at the beginning of He burning, and hence similar luminosities.
Cannon (1970) compared the observed CMDs of intermediate-age clusters with that derived from stellar evolutionary models and identified RC as a distance indicator. Benefited from the Hipparcos (ESA 1997), the absolute magnitudes of RC stars are well calibrated with accurate parallaxes (typically with errors smaller than 10%) of several hundred local RC stars. Since then, RC stars (which are numerous and bright) have been widely used as standard candles, to estimate distances to the Galactic Centre (Paczyński, B. & Stanek, 1998) and the Local Group of galaxies (e.g. LMC by Laney et al. 2012; SMC by Cole 1998; M31 by Stanek & Garnavich 1998). The study of RC stars in the Galactic Bulge revealed double RC feature, which indicated populations at different distances, implying the X-shaped structure of the Bulge (Wegg & Gerhard, 2013). Apart from being used as absolute distance indicators, RC stars are also used to map the extinction (eg: Haschke et al. 2011; Tatton et al. 2013) and to study the three dimensional structure (eg: Olsen & Salyk 2002; Koerwer 2009; Subramanian & Subramaniam 2010, 2012, 2013) of Magellanic Clouds.
The general method adopted in the estimation of distance using RC stars is by modelling the RC luminosity function (LF) with a Gaussian + quadratic polynomial term. The mean and dispersion of the Gaussian function represent the mean RC magnitude and its dispersion respectively. The quadratic polynomial term is to model the RGB stars. Instead of quadratic polynomial, various studies also use power law or exponential function. The mean RC magnitude is compared with the absolute magnitude of solar neighbourhood sample to estimate the distance to star clusters and nearby galaxies.
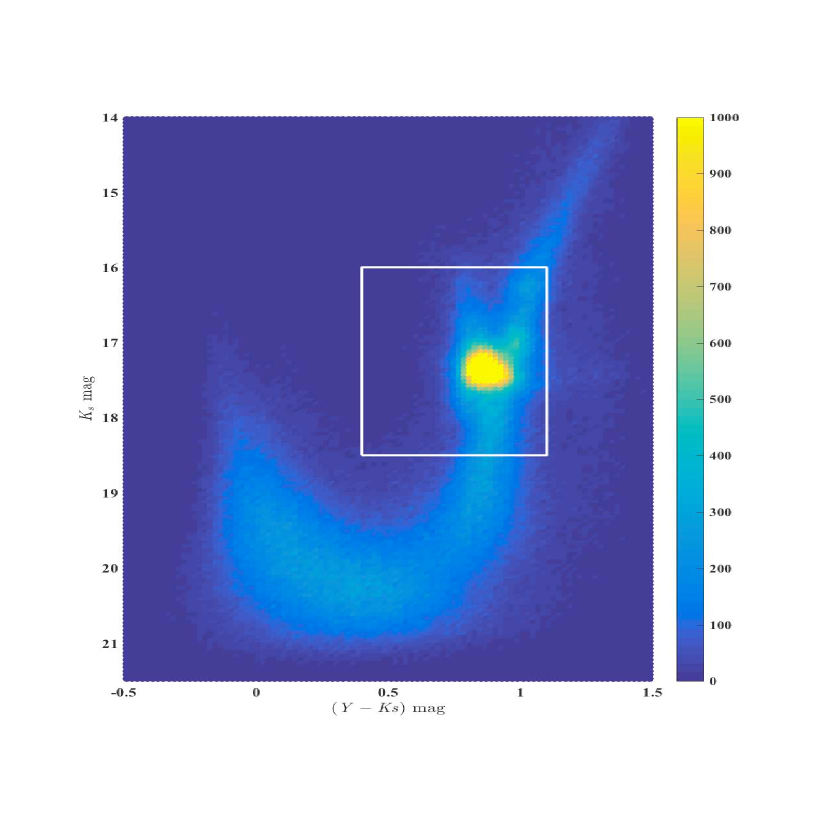
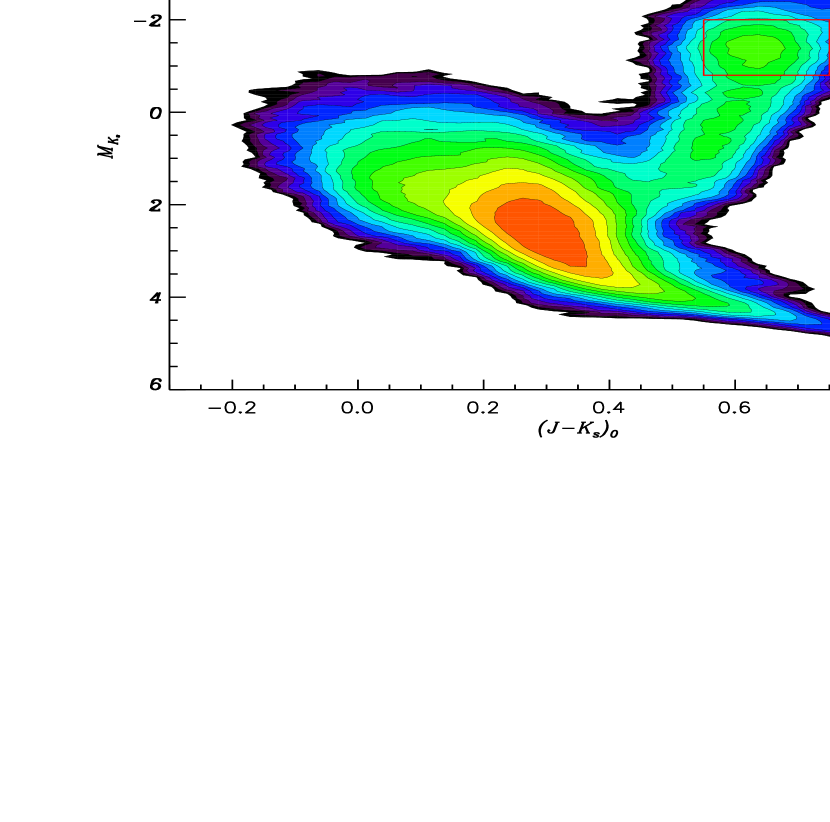
Despite the advantages of being numerous, easily identifiable in the CMD and a simple approach to measure the distances using single epoch photometric data in two bands, distance estimation using RC suffers from various caveats and limitations.
The main caveat of the RC method is the effect on the mean absolute magnitude of RC stars due to the differences in ages and metallicities of the sample with respect to the local Hipparcos sample. This effect is termed as population effect and it is also dependent on the wavelength in which RC stars are observed. One of the earlier striking results from the RC method (with similar modelling of the band LF) was the determination of 15% shorter distance to the Large Magellanic Cloud (LMC) (Stanek et al. 1998; Udalskiet al. 1998) than the values assumed to date. This created concerns on the Cepheid distance scale and determination of Hubble constant. The theoretically predicted population corrections, for the Hipparcos LMC system, in the band were 0.2 – 0.3 mag (Girardi et al. 1998; Cole 1998; Girardi & Salaris 2001) and hence reconciling with the LMC distance of about 50 kpc. This suggests the importance of population correction in the estimation of absolute distance using RC stars.
The other caveat is related to the accuracy of the estimation of the mean RC magnitude from the LF. The LF is contaminated by RGB stars and it is also skewed towards brighter magnitudes due to the presence of large number of young ( 400 Myr) RC stars (which appear as vertical extension above the classical RC in the CMD). The presence of 1 Gyr old secondary clump (Girardi et al. 1998, compared to classical RC they occupy a fainter and bluer location in the CMD) also makes it difficult to accurately measure the mean magnitude of the RC. The secondary RC stars are those in which the He burning is initiated in a non-degenerate core. Refer the detailed review by Girardi (2016) on the properties of RC stars and its use as distance indicator.
Again, the advantage of RC stars as distance indicator using photometric observations is mainly restricted to star clusters, Galactic bulge and local group galaxies, where they are identified as a clear clump feature in CMDs of these regions due to their large number and located nearly at same distance. However, for numerous field stars of the Milky Way, it is not easy to single out individual RC stars. Field RC stars are spread over a wide range of distances along the line of sight causing a vertical structure in the CMD rather than a clump. The differential extinction makes this feature more complicated to be identified easily from the CMD. Spectroscopic surveys are required for the reliable identification and study of Milky Way field RC stars.
In this section we discuss the recent studies in the application of RC method for distance estimation, which addresses some of the above mentioned limitations. In Sect.4.1 we describe a potential method to remove the contamination of the RGB stars from the RC LF. Then we discuss the identification of Milky Way field RC stars using the LAMOST spectroscopic sample in Sect.4.2.
4.1 Modelling the near infrared RC Luminosity function of crowded regions in external galaxies
As afore-mentioned, the main caveats of applying RC method for distance estimation to external galaxies are the population effects on their absolute magnitude calibration and how well we can model the observed RC LF by incorporating the effects of contaminants, especially the RGB stars.
The population correction is estimated as follows: the solar neighbourhood RC sample and the external galaxy RC sample are modelled using stellar population models, assuming the star formation rate and age – metallicity relation of the respective systems. The difference between the theoretically calculated absolute magnitudes of the solar neighbourhood sample and the external galaxy sample is taken as the population correction term. This correction is applied to the observed absolute magnitude of the Hipparcos RC sample and compared with the apparent magnitude of the RC in the external galaxy to estimate the distance modulus. The estimation of population correction term requires knowledge of detailed star formation history of the external galaxy. We note here that the theoretically calculated absolute RC magnitude of external galaxy sample is not directly used as reference for distance estimation due to the limitations in the models (Salaris & Girardi, 2002) and for absolute calibration we still rely on highly precise observational values. These population effects strongly affect both and band magnitudes in a complex way (as demonstrated by Salaris & Girardi 2002; Pietrzyński et al. 2003; Girardi 2016) and hence, limits the application of RC as distance indicator in optical bands.
The population effects of RC stars in near infrared (NIR) bands, especially in -band, are less or even negligible compared to optical bands (Salaris & Girardi 2002; Pietrzyński et al. 2003; Girardi 2016). The effect of extinction is also less in -band. These properties make RC a better standard candle in Ks band. But in the NIR CMDs of crowded regions, the RGB and RC stars are not well separated. Subramanian & Subramaniam (2013) studied the NIR data ( bands) of RC stars in the Large Magellanic Cloud (LMC) and showed that the profile fits to the observed RC LF in the crowded central regions are not satisfactory.
The best way to remove the effect of contaminants in the observed LF of the RC and to obtain their apparent magnitude, is to model the LF using stellar population models, including the star formation rate and age – metallicity relation obtained from the star formation history of the external galaxies. An attempt of such an elaborate modelling of the LF of the RC stars was preformed by Wegg & Gerhard (2013) in their study on X shaped bulge of our Galaxy. Apart from the knowledge of the star formation history of the galaxy, this detailed modelling limits the simple application of the RC stars as standard candles.
In this sub-section we discuss a simple method to remove the contamination of RGB stars from the RC stars, applicable in crowded fields, using the NIR data from the VISTA survey of the Magellanic Cloud system (VMC). Nidever et al. (2013) had used a similar technique to remove the contamination of the RGB stars from RC stars from the optical CMD in sparse outer fields of the SMC.
The VMC survey is a continuous and homogeneous ongoing survey of the Magellanic system in the (central wavelengths, = 1.02 m, 1.25 m and 2.15 m, respectively) near-infrared (NIR) bands using the 4.1 m VISTA telescope located at Paranal Observatory in Chile. The limiting magnitudes with signal-to-noise (S/N) ratio of 5, for single-epoch observations of each tile, in the and bands are 21.1 mag, 20.5 mag and 19.2 mag, respectively, in the Vega system. The stacked images can provide sources with limiting magnitudes of up to 21.5 mag in with S/N = 5. A detailed description of the VMC survey is given by Cioni et al. (2011). The RC feature in the SMC ( 17.3 mag) is around 2 mag brighter than the 5 detection limit of single-epoch observations.
As the colour gives the widest colour separation possible in the VMC data, which allows a better separation between RC and RGB stars, we use the and band photometric data to do the RC selection and further analysis. Hess diagrams, with bin sizes of 0.01 mag in colour and 0.04 mag in , representing the stellar density in the observed vs CMD of one of the central VMC tiles, SMC 4_3 is shown in Figure 23. The RC stars, at 0.7 mag and 17.3 mag, is easily identifiable in the CMD.
First we defined a box with size, 0.5 1.1 mag in colour and 16.0 18.5 mag in magnitude, for the selection of the RC stars from the CMD. The selection box is also shown Figure 23. The range in magnitude was chosen to include the vertical extent (clearly seen in eastern regions of the SMC, refer Subramanian et al. 2017) of the RC regions and also to incorporate the shift towards fainter magnitudes due to interstellar extinction.
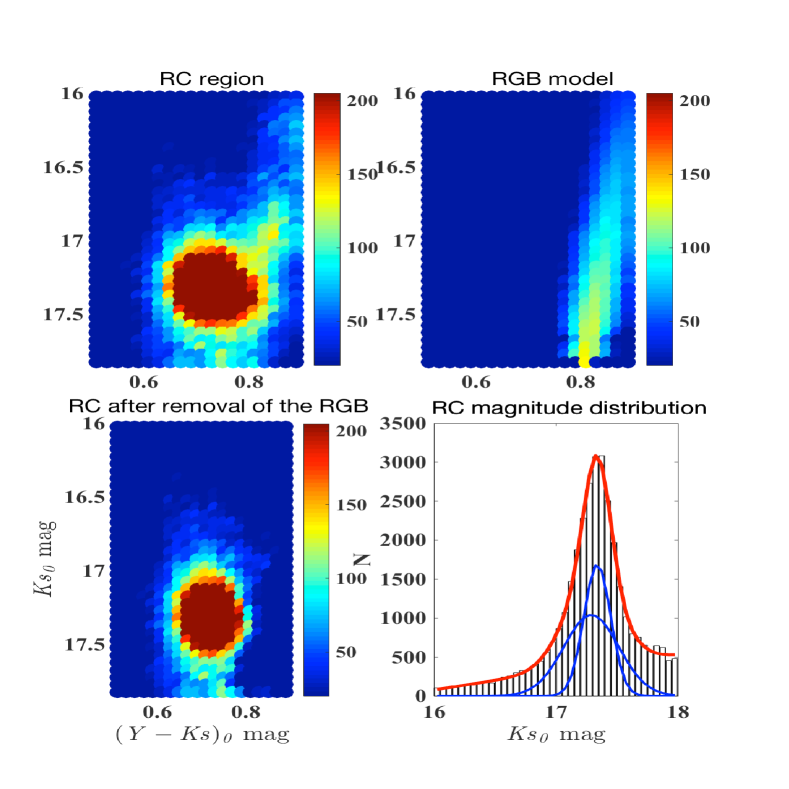
The colour cut which separates the RC and RGB is not very well defined in the CMD of the crowded central region. Hence, RGB stars are also included in the initial selection box. Later we will model the RGB density and subtract it from the Hess diagrams to obtain the RC distribution. Before modelling the RGB stars, the RC region in the CMD is cleaned by removing the closest matching star corresponding to the colour and magnitude of each foreground Milky Way (MW) star from the TRILEGAL MW stellar population model (Girardi et al., 2005) which includes a model of extinction in the Galaxy. The cleaned CMD region is then corrected for foreground and internal extinction using the extinction map of .pdf2015.
We performed a careful analysis to remove RGB contamination in order to analyse the RC LF. Tile SMC 4_3 was divided into four sub-regions. The RC stars in each sub-region were identified and Hess diagrams corresponding to the RC region were constructed. The bin sizes in colour and magnitude were 0.01 mag and 0.04 mag, respectively. The separation of the RC from the RGB based on their colour may not be reliable for the fainter magnitudes and we restrict the analysis of luminosity function up to = 18 mag. This fainter magnitude cut off of = 18 mag is 0.6 – 0.7 mag lower than the peak of the Classical RC. In a given magnitude bin (along a row in the Hess diagram), we performed a double Gaussian profile fit to the colour distribution and obtained the peak colours corresponding to the RC and the RGB distributions. This was repeated for all magnitude bins, over the magnitude range of 16.0 – 18.0 mag in the band. After this first step, we performed a linear least-squares fit to the RGB colours with the magnitude corresponding to each bin. Again, the first step was repeated with the constraint that the colour of the RGB corresponding to each magnitude is the same as that obtained from the linear fit. From the resultant Gaussian parameters corresponding to the RGB, we obtained a model for the RGB density distribution. This model was subtracted from the Hess diagram and a clean RC distribution is obtained. These steps are demonstrated in Figure 24.
The figure clearly demonstrates that the contamination from the RGB stars is minimal in the final RC distribution. The final RC density distribution is summed in the colour range 0.55 0.85 mag to obtain the LF of the RC stars. The resultant LF is initially modelled with a Gaussian profile, representing the RC, and a quadratic polynomial term to include the presence of any remaining RGB component. The fit improves by 30% when an additional broad component is included. The LF and the profile fits are shown in the lower-right panel of Figure 24. The narrow component represents the Classical RC. The broad component could be due to the presence of young stars and/or the intrinsic line of sight depth of the SMC central regions. If the broad component is due to the presence of young stars, further division of the sub-regions into smaller regions would suppress this component owing to the smaller fraction of young stars compared to Classical RC. On the other hand, if this component is due to the intrinsic line of sight depth of the SMC then it would still show up. Earlier studies of the SMC central regions (using the RC as well as other tracers such as RR Lyrae stars, Kapakos & Hatzidimitriou 2012) show large line of sight depth in the central region. So the observed broad component could be due to the line of sight depth effect. In any case, for distance estimation we are only interested in the peak of the Classical RC, which is dominant and represented by the narrow component.
Thus, the method described above effectively removes the contamination of RGB stars, even in the crowded fields, and provides a clean RC distribution to estimate the apparent magnitude of Classical RC. The final step in distance estimation is to apply the population correction term and compare with absolute RC magnitude of Hipparcos sample.
Subramanian et al. (2017) applied the above procedure to the NIR data of 20 deg2 region of the SMC and estimated a mean Ks,0 band peak magnitude corresponding to Classical RC as 17.36 0.01 mag. This magnitude is used to estimate the distance modulus to the central SMC by using the the absolute magnitude of the RC stars provided by Laney et al. (2012). Using high-precision observations of solar neighbourhood RC stars, they provide the absolute RC magnitudes in the , and bands in 2MASS system. We converted them into the VISTA system using the transformation relations provided by Rubele et al. (2015). The absolute magnitude of RC stars in the VISTA band, = 1.6040.015 mag. As indicated earlier, the absolute magnitudes of RC stars in the solar neighbourhood and in the SMC are expected to be different owing to the differences in metallicity, age and star formation rate between the two regions. Salaris & Girardi (2002) estimated this correction term in the band to be mag. We applied this correction and estimated the mean distance modulus to the SMC as 18.89 0.04mag.
Our estimate is higher than the previous estimates of SMC distance based on RC LF in optical bands, including those which incorporated population corrections (Cole 1998). But it is lower than the recent accurate estimates of distance to the SMC (18.96 0.02 mag, Graczyk et al. 2014; de Grijs & Bono 2015). This difference could be mainly due to the inaccuracy of the population correction term. As suggested by Pietrzyński et al. (2003) the population corrections calculated from models are not accurate enough for high-precision distance measurements. Better models and accurate star formation history estimates of the observed galaxy are essential to determine the population correction term and hence use of RC as accurate distance indicators.
Now we have stellar population models (such as PARSEC Bressan et al. 2012) with improved knowledge of opacities, solar abundance and microphysics. Better estimates of star formation history of nearby galaxies, using ground as well as space based deep observations, are now available. Gaia parallaxes and stellar parameters will improve the absolute calibration of the RC. Better estimates of population correction, combined with more accurate absolute RC magnitude will provide better results in future to use RC as a high-precision distance indicator.
The best way to use RC as an accurate standard candle would be to perform complete CMD fitting procedure using improved and complete set of models. This fitting procedure will be naturally driven by the dominant intermediate-age population in the CMD and hence, the RC. This is not a simple procedure and for galaxies like the SMC, which has considerable amount of depth along the line of sight, requires a distance distribution instead of discrete distance grid for better results.
4.2 Selection of Milky Way field RC stars
For Galactic centre or the Local Group of galaxies, the advantage of RC stars as distance indicators is that there is a striking, easily identifiable feature in the CMD of stars in those distant objects due to the presence of a large number of RC stars at nearly the same distance. However, it is not easy to identify individual RC stars from the numerous field stars of the Milky Way. Field RC stars are spread over a wide range of distances and there is no apparent over-density in the CMD of field stars that can be used to identify the RC members.
Fortunately, high-resolution spectroscopic analysis of nearby RC stars show that they distribute in a relative “small box” in the – log diagram (i.e. HR diagram) of K and (e.g. Puzeras et al. 2010). This is simply because is an excellent proxy of stellar colour whereas log is sensitive to the stellar absolute luminosity. Recently, with values of and log available from large-scale spectroscopic surveys for large numbers of field stars, it has become feasible to select a large number of field RC candidates. RC candidates thus selected have been widely used to study the metallicity gradients and stellar kinematics of the Galactic disk(s) (e.g. Bilir et al. 2012; Siebert et al. 2011; Williams et al. 2013; Bienaymé et al. 2014).
However, stars falling inside that “small box” are not purely RC stars and have significant (%; Williams et al. 2013) contamination from RGB. The differences in absolute magnitudes between RC and RGB stars can be larger than 1 mag and this can lead to large systematic errors in distances of the selected RC sample stars. More recently, a new method has been proposed by Bovy et al. (2014) (hereafter B14) to select a clean RC sample from large-scale spectroscopic data. The method first separates the RC-like and RGB stars using cuts on a metallicity-dependent – log diagram, assisted by theoretical stellar isochrones and calibrated using Kepler high quality asteroseismic log (e.g. Creevey et al. 2013), as well as high precision stellar atmospheric parameters from the APOGEE survey (Pinsonneault et al., 2014). Secondary RC stars are then removed from the RC-like stars via cuts on a metallicity () – colour diagram. The expected purity of the final RC sample is % and the typical distance errors are within 5 – 10 %. The key point of this new method in selecting a clean RC sample is the surface gravity log .
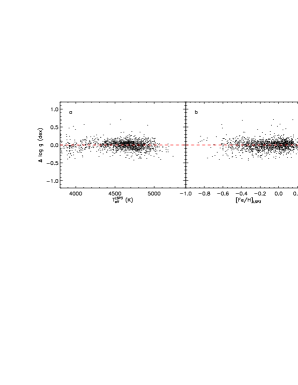
Unfortunately, it is difficult to apply this method to the LAMOST spectroscopic survey of the galactic anti-centre (LSS-GAC, Liu et al. 2014; Yuan et al. 2015) data given the relatively large systematic plus random errors ( 0.2 – 0.4 dex) of log estimates delivered by the LAMOST Stellar Parameter Pipeline at Peking University (LSP3; Xiang et al. 2015), as shown by a recent comparison of LSP3 and asteroseismic log values for common objects in the LAMOST– fields (Ren et al., 2016). To apply the similar method developed by B14 to select pure RC stars from LSS-GAC data, we have improved log measurements using a Kernel Principal Component Analysis (KPCA, Schölkopf et al. 1998) method trained by accurate asteroseismic data from the LAMOST–Kepler fields (Huang et al. 2015, hereafter H15). First, the training sample is constructed by cross-matching our sub-sample of about 50 000 stars in the LAMOST–Kepler fields with the currently available largest asteroseismic log sample (16 000 stars) from Huber et al. (2014). In total, 3562 common sources with SNR 10 are identified. To further select red giant stars and ensure high quality of the stellar parameters yielded by LSP3, we take a sub-sample of 1355 stars from the 3562 common sources. Secondly, we apply the KPCA method to the training sample to construct the relations between seismic log and the LAMOST spectra (see Figure 25). Finally, We apply the constructed relations to the LAMOST spectra and re-determine log values for all LSS-GAC DR2 red giants. The accuracy of the newly estimated KPCA log is as high as 0.1-0.15 dex and has no significant systematic error. With the high accurate, newly estimated KPCA log , we can apply the similar technique developed by B14 to select main RC from LAMOST data. To show how well the technique works for LAMOST data, we present the two steps of the selections as mentioned above in Figs. 26 and 27.
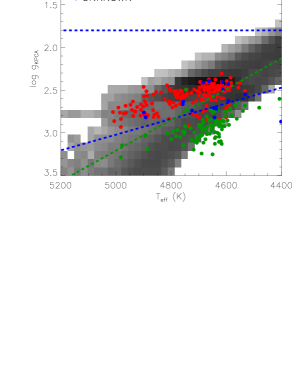
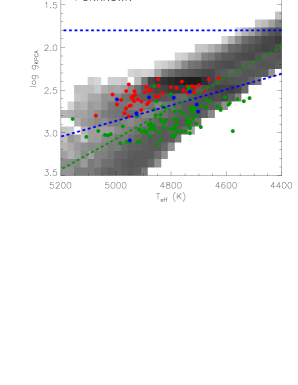
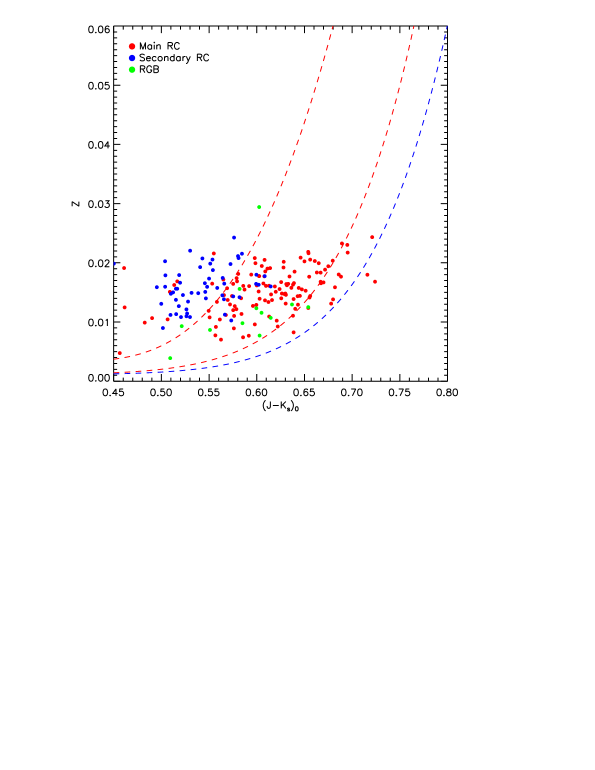
4.2.1 The LSS-GAC RC sample and its applications
With , [Fe/H] estimated with the LSP3, , derived with the KPCA method and calculated from 2MASS photometry111Only stars with ph_qual flagged as ‘A’ in both and bands are included. after corrected for extinction as estimated with the ‘star pair’ method (Yuan et al., 2015), we apply the similar technique developed by B14 to LSS-GAC DR2 red giant sample and obtain a clean RC sample of over 0.11 million stars of S/N (4650 Å) (see Figure 28). The distances of these RC stars are derived using the recent calibration, mag, for nearby RC sample (Laney et al., 2012). Since the intrinsic scatter of absolute magnitudes of RC stars is estimated to be within 0.1 mag, the distances derived are expected to have uncertainties no more than 5 – 10 %, given a typical photometric error of 0.05 mag in -band and an extinction error of 0.04 mag in (see Yuan et al. 2015). Proper motions of the sample stars are taken from the U.S. Naval Observatory CCD Astrograph Catalog (UCAC4, Zacharias et al. 2013) and PPMXL (Roeser et al., 2010) catalogues Given the high distance precision and large spatial coverage (Figure 27) of the current RC star sample, it is very useful to tackle a variety of problems with regard to the Galactic chemistry (e.g. stellar metallicity gradients of Galactic disk, listed below), structures and dynamics (e.g. Galactic rotation curve, listed below). The sample is publicly available at website: (http://162.105.156.249/site/RC_Sample).
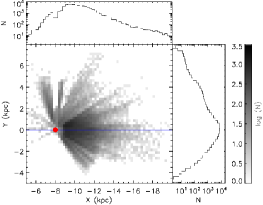
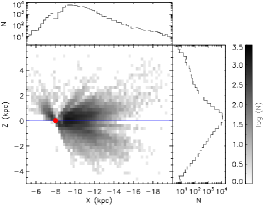
Galactic rotation curve: Using the pure RC sample selected from LSS-GAC and the APOGEE surveys, combined with a sample of halo K giants selected from the SDSS/SEGUE, the Galactic rotation curve (RC) between 8 and 100 kpc in Galactocentric radius has been constructed (Huang et al., 2016). The newly constructed RC has a generally flat value of km s-1 within a Galactocentric radius of 25 kpc and then decreases steadily to km s-1 at 100 kpc. On top of this overall trend, the RC exhibits two prominent localised dips, one at 11 kpc and another at 19 kpc. The dips could be explained by assuming the existence of two massive (dark) matter rings in the Galactic plane. From the newly constructed RC, combined with other data, we have built a mass model of the Galaxy, yielding a virial mass of the Milky Way’s dark matter halo of and a local dark matter density, GeV cm-3.
Metallicity gradients of the Galactic disk: We also have determined the radial and vertical metallicity gradients of the Galactic disk(s), again using the LSS-GAC pure RC sample (H15). Our analysis shows that, near the solar circle ( kpc), the radial metallicity gradient exhibits a negative slope that flattens with increasing . In contrast, in the outer disk ( kpc), the radial metallicity gradient has an essentially constant, much less steep slope at all heights from the mid-plane, suggesting that the outer disk may have experienced an evolutionary path different from that of the inner disk. In addition, the vertical metallicity gradient is found to flatten roughly with increasing . The flattening of the gradient in the lower disk ( kpc) is much quicker than in the upper disk ( kpc).
The parallaxes and stellar parameters of Galaxy RC sample from Gaia will improve the zero-point calibration. Combing the improved zero-point calibration with the results from on-going and future asterosesmic surveys such as PLAnetary Transits and Oscillations of stars (Rauer et al., 2014), the Transiting Exoplanet Survey Satellite (Ricker et al., 2014), and the second phase of Kepler (K2; Stello et al. 2015) will provide large sample of RC stars to perform Galactic archaeology.
5 Final Remarks
We provided an overview of the properties of young and intermediate-age stars, such as Cepheids, Mira stars and RC stars in the context of their application as distance indicators. Below given are the salient points.
-
•
Cepheids
-
–
NIR Cepheid distances
-
*
NIR PW relations allow us to derive Cepheid distances with the accuracy to meet the precision of ongoing cosmological experiments. They are less affected by extinction and metallicity effects. By using NIR PW relations, Inno et al. (2013) obtained the most precise estimate of distances to the Magellanic Clouds based on Cepheids, with random errors at 1% level and systematics at 5% level. Independent calibrations from Gaia and HST will play a crucial role to reach a better accuracy.
-
*
New NIR light-curve templates can provide accurate mean magnitudes from a few or even one observation, allowing a significant saving of observing time and an optimal usage of data already available.
-
*
-
–
MIR Cepheid distances
-
MIR studies of Cepheids lead to significant advantages with respect to optical wavelengths. The band appears to be ideal wavelength range for these measurements, lacking the presence of variable CO absorption that is instead affecting the band.
- *
-
*
Accurate parallaxes for Galactic Cepheids expected with the final Gaia data release, combined with future JWST L band observations of Cepheids in host galaxies of Type Ia Supernovae will enable 1% measurements of H0 as well as competitive measurements of other cosmological parameters.
-
-
–
Linearity of PL relation
-
*
The statistical analysis of non-linearities in the LMC PL relations provides evidence of a break in both fundamental mode and first-overtone mode relations.
-
*
The observed non-linearities suggest a correlation with sharp changes in the light curve structure of Cepheids and needs a theoretical investigation to look for additional resonance features.
-
*
The effect of these non-linearities in the slope of HST-based PL relations is minimal. Hence, does not have any statistically significant effect on the distance scale or the value of Hubble constant. But they will have a significant impact on the accuracies of distance scale with more precise PL relations, for example from James Webb Space Telescope.
-
*
-
–
Metallicity effects in PL relation
-
*
NIR Surface Brightness method which is a geometrical method, enables us to independently estimate the distances to nearby Cepheids.
-
*
The PL relations constructed from these independent distance estimates for Cepheids in Milky Way, LMC and SMC are ideal to investigate the effect of metallicity in Cepheid PL relations.
-
*
Preliminary results indicate that the effect of metallicity, especially in band PL relation, is very small.
-
*
-
–
-
•
Mira variables
-
–
For better calibration of Galactic PL relation of Mira variables and to understand their physical properties, very precise parallax measurements are essential. We present the strategy and initial results of an on-going VLBI astrometric survey of Galactic Miras.
-
–
The initial results show consistent PL relations for Mira variables between our Galaxy and the LMC.
-
–
-
•
Red Clump stars
-
–
Galactic Bulge and External galaxies
-
*
We present a simple method to remove the contamination of RGB stars from the RC LF function in crowded fields and hence provide better measurements of the apparent magnitude of Classical RC. This technique is used to estimate the mean distance modulus of the SMC as 18.89 0.04 mag (including a population correction term). We note that the population correction terms obtained from models may not be accurate enough to use RC as high precision absolute distance indicator.
-
*
New stellar population models, improved star formation history measurements of the galaxies and improved calibration of absolute RC magnitude from Gaia will all together provide better results to use RC as accurate distance indicator.
-
*
Though not simple, another way to use RC as accurate standard candle is to perform complete CMD fitting procedure using improved and complete set of stellar population models.
-
*
-
–
Field RC stars in Milky Way
-
*
Recent spectroscopic surveys allow us to select a large number of field RC stars in Milky Way. A technique to identify a clean sample of RC stars from field stars in Milky Way using LAMOST spectroscopic survey is presented. This sample is used to derive the metallicity gradient and rotation curve of our Galaxy.
-
*
The parallaxes and stellar parameters from Gaia, combined with the results from ongoing and future asterosesmic surveys will provide a large sample of RC stars to perform Galactic archaeology.
-
*
-
–
Acknowledgements.
SS acknowledges research funding support from Chinese Postdoctoral Science Foundation (grant number 2016M590013). YH thanks the support by the by the National Key Basic Research Program of China 2014CB845700, the National Natural Science Foundation of China 11473001 and the LAMOST FELLOWSHIP. LI acknowledge support from the Sonderforschungsbereich SFB 881 The Milky Way System (subproject A3) of the German Research Foundation (DFG).References
- Alcock et al. (2001) Alcock, C., et al., The MACHO Project: Microlensing Detection Efficiency, ApJS, 136, 439 (2001)
- Anderson et al. (2014) Anderson, R. I., et al., On the effect of rotation on populations of classical Cepheids. I. Predictions at solar metallicity, A&A, 564, A100 (2014)
- Anderson et al. (2015) Anderson, R. I., et al., Revealing Cephei’s Secret Companion and Intriguing Past, ApJ, 804, 144 (2015)
- Andrievsky et al. (2016) Andrievsky, S. M. and Martin, R. P. and Kovtyukh, V. V. and Korotin, S. A. and Lépine, J. R. D., Oxygen, -element and iron abundance distributions in the inner part of the Galactic thin disc - II, MNRAS, 461, 4256 (2016)
- Aringer et al. (1999) Aringer, B., Höfner, S., Wiedemann, G., Hron, J., Jørgensen, U. G., Käufl, H. U., & Windsteig, W., SiO rotation-vibration bands in cool giants II. The behaviour of SiO bands in AGB stars, Astron. Astrophys., 342, 799 (1999)
- Asaki et al. (2010) Asaki, Y., Deguchi, S., Imai, H., et al., Distance and Proper Motion Measurement of the Red Supergiant, S Persei, with VLBI H2O Maser Astrometry, Astrophys. J., 721, 267 (2010)
- Barmby et al. (2011) Barmby, P., et al., Galactic Cepheids with Spitzer. II. Search for Extended Infrared Emission, AJ, 141, 42 (2011)
- Barnes & Evans (1976) Barnes, T. G., Evans, D. S., Stellar angular diameters and visual surface brightness - I. Late spectral types., MNRAS, 174, 489 (1976)
- Beaulieu et al. (1995) Beaulieu, J. P., et al., EROS variable stars: fundamental-mode and first-overtone Cepheids in the bar of the Large Magellanic Cloud., A&A, 303, 137 (1995)
- Bono et al. (1999a) Bono, G., et al., Theoretical Models for Classical Cepheids. II. Period-Luminosity, Period-Color, and Period-Luminosity-Color Relations, ApJ, 512, 711 (1999)
- Bressan et al. (2012) Bressan, Alessandro; Marigo, Paola., et al. PARSEC: stellar tracks and isochrones with the PAdova and TRieste Stellar Evolution Code, MNRAS, 427, 127 (2012)
- Tatton et al. (2013) Tatton, B. L.; van Loon, J. Th.; Cioni, M.-R., et al., The VMC survey. VII. Reddening map of the 30 Doradus field and the structure of the cold interstellar medium, A&A, 554, 33 (2013)
- Benedict et al. (2007) Benedict, G. F., et al., Hubble Space Telescope Fine Guidance Sensor Parallaxes of Galactic Cepheid Variable Stars: Period-Luminosity Relations, AJ, 133, 1810 (2007)
- Bhardwaj et al. (2015) Bhardwaj, A., et al., On the variation of Fourier parameters for Galactic and LMC Cepheids at optical, near-infrared and mid-infrared wavelengths, MNRAS, 447, 3342 (2015)
- Bhardwaj et al. (2016a) Bhardwaj, A., et al., Large Magellanic Cloud Near-Infrared Synoptic Survey - III. A statistical study of non-linearity in the Leavitt Laws, MNRAS, 457, 1644 (2016a)
- Bhardwaj et al. (2016b) Bhardwaj, A., et al., Period-Luminosity relations derived from the OGLE-III first-overtone mode Cepheids in the Magellanic Clouds, MNRAS, 458, 3705 (2016b)
- Bienaymé et al. (2014) Bienaymé, O., Famaey, B., Siebert, A., et al., Weighing the local dark matter with RAVE red clump stars, Astron. Astrophys., 571, 92 (2014)
- Bilir et al. (2012) Bilir, S., Karaali, S., Ak, S., et al., Local stellar kinematics from RAVE data - III. Radial and vertical metallicity gradients based on red clump stars, MNRAS, 421, 3362 (2012)
- Bono et al. (1999b) Bono, G., Marconi, M., Stellingwerf, R. F., Classical Cepheid Pulsation Models. I. Physical Structure, ApJS, 122, 167 (1999)
- Bono et al. (2000a) Bono, G., Marconi, M., Stellingwerf, R. F., Classical Cepheid pulsation models — VI. The Hertzsprung progression, A&A, 360, 245 (2000a)
- Bono et al. (2000b) Bono, G., et al., Intermediate-Mass Star Models with Different Helium and Metal Contents, ApJ, 543, 955 (2000b)
- Bono et al. (2010) Bono, G., et al., Insights into the Cepheid Distance Scale, ApJ, 715, 277 (2010)
- Bovy et al. (2014) Bovy, J., Nidever, D. L., Rix, H.-W., et al., The APOGEE Red-clump Catalog: Precise Distances, Velocities, and High-resolution Elemental Abundances over a Large Area of the Milky Way’s Disk, Astrophys. J., 790, 127 (2014)
- Cannon (1970) Cannon, R. D., Red giants in old open clusters, MNRAS, 150, 111 (1970)
- Caputo et al. (2005) Caputo, F., et al., Pulsation and Evolutionary Masses of Classical Cepheids. I. Milky Way Variables, ApJ, 629, 1021 (2005)
- Cardelli et al. (1989) Cardelli, J. A., Clayton, G. C., Mathis, J. S., The relationship between infrared, optical, and ultraviolet extinction, ApJ, 345, 245 (1989)
- Chapman et al. (2009) Chapman, N. L., et al., The Mid-Infrared Extinction Law in the Ophiuchus, Perseus, and Serpens Molecular Clouds, ApJ, 690, 496-511 (2009)
- Choi et al. (2008) Choi, Y. K., Hirota, T., Honma, M., et al., Astrometry of H2O Masers in Nearby Star-Forming Regions with VERA. II. SVS13 in NGC1333, PASJ, 60, 1007
- Cioni et al. (2011) Cioni, M.-R. L., et al., The VMC survey. I. Strategy and first data, A&A, 527, A116 (2011)
- Cole (1998) Cole, Andrew A., Age, Metallicity, and the Distance to the Magellanic Clouds From Red Clump Stars, Astrophys. J., 500, 137 (1998)
- Creevey et al. (2013) Creevey, O. L., Thévenin, F., Basu, S., et al., A large sample of calibration stars for Gaia: log g from Kepler and CoRoT fields, MNRAS, 431,2419 (2013)
- Cuesta et al. (2015) Cuesta, A. J., et al., Calibrating the cosmic distance scale ladder: the role of the sound-horizon scale and the local expansion rate as distance anchors, MNRAS, 448, 3463 (2015)
- Cutri et al. (2003) Cutri, R. M., Skrutskie, M. F., van Dyk, S., et al., VizieR Online Data Catalog 2MASS All-Sky Catalog of Point Sources (Cutri+ 2003), 2246 (2003)
- Dambis et al. (2015) Dambis, A. K. and Berdnikov, L. N. and Efremov, Y. N. and Kniazev, A. Y. and Rastorguev, A. S. and Glushkova, E. V. and Kravtsov, V. V. and Turner, D. G. and Majaess, D. J. and Sefako, R., Classical Cepheids and the spiral structure of the milky way, AstL, 41, 489 (2015)
- de Grijs et al. (2014) de Grijs, R. Richard, Wicker and Bono, G., Clustering of Local Group Distances: Publication Bias or Correlated Measurements? I. The Large Magellanic Cloud, AJ, 147, 122 (2014)
- de Grijs & Bono (2015) de Grijs, R. and Bono, G., Clustering of Local Group Distances: Publication Bias or Correlated Measurements? III. The Small Magellanic Cloud, AJ, 149, 179 (2015)
- Dehnen & Binney (1998) Dehnen, W., & Binney, J. J., Local stellar kinematics from HIPPARCOS data, MNRAS, 298, 387 (1998)
- De Marchi et al. (2016) De Marchi, G., et al., Hubble Tarantula Treasury Project - IV. The extinction law, MNRAS, 455, 4373 (2016)
- di Benedetto (1998) di Benedetto, G. P., Towards a fundamental calibration of stellar parameters of A, F, G, K dwarfs and giants, A&A, 339, 858 (1998)
- Ducati (2002) Ducati, J. R., VizieR Online Data Catalog: Catalogue of Stellar Photometry in Johnson’s 11-color system, VizieR Online Data Catalog, 2237 (2002)
- Dvorki et al. (2014) Dvorkin, C., et al., Neutrinos help reconcile Planck measurements with both the early and local Universe, PhRvD, 90, 083503 (2014)
- ESA (1997) ESA , The HIPPARCOS and TYCHO catalogues. Astrometric and photometric star catalogues derived from the ESA HIPPARCOS Space Astrometry Mission, ESA Special Publication, 1200 (1997)
- Evans et al. (2008) Evans, N. R., et al., Direct Detection of the Close Companion of Polaris with the Hubble Space Telescope, AJ, 136, 1137 (2008)
- Evans et al. (2013) Evans, N. E., et al., Binary Cepheids: Separations and Mass Ratios in 5 Binaries, AJ, 146, 93 (2013)
- Fazio et al. (2004) Fazio, G. G., et al., The Infrared Array Camera (IRAC) for the Spitzer Space Telescope, ApJS, 154, 10 (2004)
- Feast et al. (1989) Feast, M. W., Glass, I. S., Whitelock, P. A., & Catchpole, R. M., A period-luminosity-colour relation for Mira variables, MNRAS, 241, 375 (1989)
- Feast & Catchpole (1997) Feast, M. W., Catchpole, R. M., The Cepheid period-luminosity zero-point from HIPPARCOS trigonometrical parallaxes, MNRAS, 286, L1 (1997)
- Feast & Whitelock (2000) Feast, M. W., & Whitelock, P. A., Hipparcos parallaxes for Mira-like long-period variables, MNRAS, 317, 460 (2000)
- Freedman et al. (2001) Freedman, W. L. and Madore, B. F. and Gibson, B. K. and Ferrarese, L. and Kelson, D. D. and Sakai, S. and Mould, J. R. and Kennicutt, Jr., R. C. and Ford, H. C. and Graham, J. A. and Huchra, J. P. and Hughes, S. M. G. and Illingworth, G. D. and Macri, L. M. and Stetson, P. B., Final Results from the Hubble Space Telescope Key Project to Measure the Hubble Constant, ApJ, 553, 47 (2001)
- Fiorentino et al. (2007) Fiorentino, G., et al., Classical Cepheid pulsation models. XI. Effects of convection and chemical composition on the period-luminosity and period-Wesenheit relations, A&A, 476, 863 (2007)
- Fiorentino et al. (2013) Fiorentino, G., Musella, I., Marconi, M., Cepheid theoretical models and observations in HST/WFC3 filters: the effect on the Hubble constant H0, MNRAS, 434, 2866 (2013)
- Flaherty et al. (2007) Flaherty, K. M., et al., Infrared Extinction toward Nearby Star-forming Regions, ApJ, 663, 1069 (2007)
- Fouqué & Gieren (1997) Fouque, P., Gieren, W. P., An improved calibration of Cepheid visual and infrared surface brightness relations from accurate angular diameter measurements of cool giants and supergiants., A&A, 320, 799 (1997)
- Fouqué et al. (2007) Fouqué, P., et al., A new calibration of Galactic Cepheid period-luminosity relations from B to K bands, and a comparison to LMC relations, A&A, 476, 73 (2007)
- Freedman et al. (1985) Freedman, W. L., Grieve, G. R., Madore, B. F., BVRI photometry of extragalactic cepheids and new insights for the distance scale, ApJS, 59, 311 (1985)
- Freedman (2010a) Freedman, W. L., Madore, B. F., The Hubble Constant, ARA&A, 48, 673 (2010a)
- Freedman et al. (2011) Freedman, W. L., et al., The Carnegie Hubble Program, AJ, 142, 192 (2011)
- Freedman et al. (2012) Freedman, W. L., et al., Carnegie Hubble Program: A Mid-infrared Calibration of the Hubble Constant, ApJ, 758, 24 (2012)
- Fricke et al. (1972) Fricke, K., Stobie, R. S., Strittmatter, P. A., The Masses of Cepheid Variables, ApJ, 171, 593 (1972)
- Friedman et al. (2011) Friedman, S. D., et al., Pairwise Correlations Of Eight Strong DIBs And N(H), N(H2), And E(B-V), AAS, 43, 129.10 (2011)
- Gallenne et al. (2011) Gallenne, A., et al., Spatially extended emission around the Cepheid RS Puppis in near-infrared hydrogen lines. Adaptive optics imaging with VLT/NACO, A&A, 527, A51 (2011)
- García-Varela et al. (2013) García-Varela, A., Sabogal, B. E., Ramírez-Tannus, M. C., A study on the universality and linearity of the Leavitt law in the LMC and SMC galaxies, MNRAS, 431, 2278 (2013)
- Gardner (2012) Gardner, J. P., The James Webb Space Telescope: extending the science, SPIE, 8442, 844228 (2012)
- Green et al. (2015) Green, G. M., et al., A Three-dimensional Map of Milky Way Dust, ApJ, 810, 25 (2015)
- Girardi et al. (1998) Girardi, Leo; Groenewegen, Martin A. T.; Weiss, Achim; Salaris, Maurizio., Fine structure of the red giant clump from HIPPARCOS data, and distance determinations based on its mean magnitude, MNRAS, 301, 149 (1998)
- Girardi & Salaris (2001) Girardi, L. and Salaris, M., Population effects on the red giant clump absolute magnitude, and distance determinations to nearby galaxies, 323, 109 (2001)
- Girardi et al. (2005) Girardi, L. and Groenewegen, M. A. T. and Hatziminaoglou, E. and da Costa, L., Star counts in the Galaxy. Simulating from very deep to very shallow photometric surveys with the TRILEGAL code, MNRAS, 436, 895 (2005)
- Girardi (2016) Girardi, L., ARA&A, Red Clump Stars, 54, 95 (2016)
- Graczyk et al. (2014) Graczyk, D., Pietrzyński, G., Thompson, I. B., et al., The Araucaria Project. The Distance to the Small Magellanic Cloud from Late-type Eclipsing Binaries, ApJ, 780, 59 (2014)
- Haniff et al. (1995) Haniff, C. A., Scholz, M., & Tuthill, P. G., New Diameter Measurements of 10 Mira Variables - Implications for Effective Temperatures Atmospheric Structure and Pulsation Modes, MNRAS, 276, 640
- Haschke et al. (2011) Haschke, R., Grebel, E. K., Duffau, S., New Optical Reddening Maps of the Large and Small Magellanic Clouds, AJ, 141, 158 (2011)
- Haschke e al. (2012) Haschke, R., Grebel, E. K., Duffau, S., Three-dimensional Maps of the Magellanic Clouds using RR Lyrae Stars and Cepheids. I. The Large Magellanic Cloud, AJ, 144, 106 (2012)
- Huang et al. (2015) Huang, Y., Liu, X.-W., Zhang, H.-W., et al., On the metallicity gradients of the Galactic disk as revealed by LSS-GAC red clump stars, Research in Astronomy and Astrophysics, 15, 1240 (2015)
- Huang et al. (2016) Huang, Y., Liu, X.-W., Yuan, H.-B., et al., The Milky Way’s rotation curve out to 100 kpc and its constraint on the Galactic mass distribution, MNRAS, 463, 2623 (2016)
- Hubble (1929a) Hubble, E. P., A spiral nebula as a stellar system, Messier 31., ApJ, 69, (1929a)
- Hubble (1929b) Hubble, E., A Relation between Distance and Radial Velocity among Extra-Galactic Nebulae, Proceedings of the National Academy of Science, 15, 168 (1929b)
- Huber et al. (2014) Huber, Daniel; Silva Aguirre, Victor; Matthews, Jaymie M., et al., Revised Stellar Properties of Kepler Targets for the Quarter 1-16 Transit Detection Run, ApJS, 211, 2 (2014)
- Indebetouw et al. (2005) Indebetouw, R., et al., The Wavelength Dependence of Interstellar Extinction from 1.25 to 8.0 m Using GLIMPSE Data, ApJ, 619, 931 (2005)
- Inno et al. (2013) Inno, L., et al., On the Distance of the Magellanic Clouds Using Cepheid NIR and Optical-NIR Period-Wesenheit Relations, ApJ, 764, 84 (2013)
- Inno et al. (2015) Inno, L., et al., New NIR light-curve templates for classical Cepheids, A&A, 576, A30 (2015)
- Inno et al. (2016) Inno, L., et al., The panchromatic view of the Magellanic Clouds from Classical Cepheids. I. Distance, Reddening and Geometry of the Large Magellanic Cloud disk, ApJ, 832, 1761 (2016)
- Ita et al. (2004) Ita, Y., Tanabé, T., Matsunaga, N., et al., Variable stars in the Magellanic Clouds: results from OGLE and SIRIUS, MNRAS, 347, 720 (2004)
- Jacyszyn-Dobrzeniecka et al. (2016) Jacyszyn-Dobrzeniecka, A. M., et al., OGLE-ing the Magellanic System: Three-Dimensional Structure of the Clouds and the Bridge Using Classical Cepheids, AcA, 66, 149 (2016)
- Jones et al. (1996) Jones, R. V., Carney, B. W., Fulbright, J. P., Template K Light Curves for RR Lyrae Stars, PASP, 108, 877 (1996)
- Kapakos & Hatzidimitriou (2012) Kapakos, E. and Hatzidimitriou, D., RR Lyrae variables in the Small Magellanic Cloud - II. The extended area: chemical and structural analysis, MNRAS, 426, 2063 (2012)
- Kamezaki et al. (2012) Kamezaki, T., Nakagawa, A., Omodaka, T., et al., VLBI Astrometry of the Semiregular Variable RX Bootis, PASJ, 64, 7 (2012)
- Kamezaki et al. (2014) Kamezaki, T., Kurayama, T., Nakagawa, A., et al., Annual parallax measurements of a semi-regular variable star, RW Leporis, PASJ, 66, 107 (2014)
- Kamezaki et al. (2016a) Kamezaki, T., Nakagawa, A., Omodaka, T., et al., Annual parallax measurements of a Mira variable star, U Lyncis, PASJ, 68, 71 (2016a)
- Kamezaki et al. (2016b) Kamezaki, T., Nakagawa, A., Omodaka, T., et al., Annual parallax and a dimming event of a Mira variable star, FV Bootis, PASJ, 68, 75 (2016b)
- Kamohara et al. (2010) Kamohara, R., Bujarrabal, V., Honma, M., et al., VERA observations of SiO maser emission from R Aquarii, Astron. Astrophys., 510, A69 (2010)
- Kanbur & Ngeow (2005) S. Kanbur, C. Ngeow, The Physics Behind the Non-Linearity of the Cepheid Period-Luminosity Relation, in The Three-Dimensional Universe with Gaia, ESA Special Publication, vol. 576, ed. by C. Turon, K.S. O’Flaherty, M.A.C. Perryman (2005), ESA Special Publication, vol. 576, p. 691
- Kawaguchi et al. (2000) Kawaguchi, N., Sasao, T., & Manabe, S., Dual-beam VLBI techniques for precision astrometry of the VERA project, Proc. SPIE, 4015, 544 (2000)
- Keller et al. (2006) Keller, S. C., Wood, P. R., Bump Cepheids in the Magellanic Clouds: Metallicities, the Distances to the LMC and SMC, and the Pulsation-Evolution Mass Discrepancy, ApJ, 642, 834 (2006)
- Kennicutt et al. (1998) Kennicutt, R. C., Jr., et al., The Hubble Space Telescope Key Project on the Extragalactic Distance Scale. XIII. The Metallicity Dependence of the Cepheid Distance Scale, ApJ, 498, 181 (1998)
- Kervella et al. (2004) Kervella, P., et al., Cepheid distances from infrared long-baseline interferometry. III. Calibration of the surface brightness-color relations, A&A, 428, 587 (2004)
- Kervella et al. (2009) Kervella, P., Mérand, A., Gallenne, A., The circumstellar envelopes of the Cepheids Carinae and RS Puppis . Comparative study in the infrared with Spitzer, VLT/VISIR, and VLTI/MIDI, A&A, 498, 425 (2009)
- Knuth (1981) D.E. Knuth, Seminumerical algorithms, 2nd edn. The Art of Computer Programming, vol. 2 (Addison-Wesley, Reading, 1981).
- Kobayashi (2003) Kobayashi, H., et al., VERA Project, ASP Conference Series, 306, 48P (2003)
- Koerwer (2009) Koerwer, Joel F., Large Magellanic Cloud Distance and Structure from Near-Infrared Red Clump Observations, AJ, 138, 1 (2009)
- Kurayama et al. (2005) Kurayama, T., Sasao, T., & Kobayashi, H., Parallax Measurements of the Mira-Type Star UX Cygni with Phase-referencing VLBI, Astrophys. J. Lett., 627, L49 (2005)
- Kusuno et al. (2013) Kusuno, K., Asaki, Y., Imai, H., & Oyama, T., Distance and Proper Motion Measurement of the Red Supergiant, PZ Cas, in Very Long Baseline Interferometry H2O Maser Astrometry, Astrophys. J., 774, 107 (2013)
- Laney et al. (1992) Laney, C. D., Stobie, R. S., JHKL observations of galactic Cepheids, A&AS, 93, 93 (1992)
- Laney et al. (2012) Laney, C. D. and Joner, M. D. and Pietrzyński, G., A new Large Magellanic Cloud K-band distance from precision measurements of nearby red clump stars, MNRAS, 419, 1637 (2012)
- Leavitt & Pickering (1912) Leavitt, H. S., Pickering, E. C., Periods of 25 Variable Stars in the Small Magellanic Cloud., Harvard College Observatory Circular, 173, 1 (1912)
- Liu et al. (2014) Liu, X.-W., Yuan, H.-B., Huo, Z.-Y., et al., LSS-GAC - A LAMOST Spectroscopic Survey of the Galactic Anti-center, in Feltzing, S., Zhao, G., Walton, N., Whitelock, P., eds, Proc. IAU Symp. 298, Setting the scene for Gaia and LAMOST, Cambridge University Press, pp. 310-321 (2014)
- Luck (1998) Luck, R. E., et al., Magellanic Cloud Cepheids - Abundances, AJ, 115, 605 (1998)
- McCall (2004) McCall, M. L., On Determining Extinction from Reddening, AJ, 128, 2144 (2004)
- McAlary et al. (1986) McAlary, C. W., Welch, D. L., Detection of Cepheid variables by the Infrared Astronomical Satellite, AJ, 91, 1209 (1986)
- Macri et al. (2015) Macri, L. M., et al., Large Magellanic Cloud Near-Infrared Synoptic Survey. I. Cepheid Variables and the Calibration of the Leavitt Law, AJ, 149, 117 (2015)
- Madore (1982) Madore, B. F., The period-luminosity relation. IV - Intrinsic relations and reddenings for the Large Magellanic Cloud Cepheids, ApJ, 253, 575 (1982)
- Marconi et al. (2005) Marconi, M., Musella, I., Fiorentino, G., Cepheid Pulsation Models at Varying Metallicity and Y/Z, ApJ, 632, 590 (2005)
- Marconi et al. (2015) Marconi, M., et al., On a New Theoretical Framework for RR Lyrae Stars. I. The Metallicity Dependence, ApJ, 808, 50 (2015)
- Marengo et al. (2002) Marengo, M., et al., Theoretical Limb Darkening for Pulsating Cepheids, ApJ, 567, 1131 (2002)
- Marengo et al. (2003) Marengo, M., et al., Theoretical Limb Darkening for Classical Cepheids. II. Corrections for the Geometric Baade-Wesselink Method, ApJ, 589, 968 (2003)
- Marengo et al. (2010) Marengo, M., et al., Galactic Cepheids with Spitzer. I. Leavitt Law and Colors, ApJ, 709, 120 (2010)
- Marshall et al. (2006) Marshall, D. J., et al., Modelling the Galactic interstellar extinction distribution in three dimensions, A&A, 453, 635 (2006)
- Martin et al. (2015) Martin, R.P., et al., Oxygen, -element and iron abundance distributions in the inner part of the Galactic thin disc, MNRAS, 449, 4071 (2015)
- Marengo et al. (2010) Marengo, M., et al., An Infrared Nebula Associated with Cephei: Evidence of Mass Loss?, ApJ, 725, 2392 (2010)
- Matsunaga et al. (2011) Matsunaga, N., et al., Three classical Cepheid variable stars in the nuclear bulge of the Milky Way, Nature, 477, 188 (2011)
- Matsunaga et al. (2013) Matsunaga, N., et al., Cepheids and other short-period variables near the Galactic Centre, MNRAS, 429, 385 (2013)
- Matsunaga et al. (2016) Matsunaga, N., et al., A lack of classical Cepheids in the inner part of the Galactic disc, MNRAS, 462, 414 (2016)
- Matthews et al. (2012) Matthews, L. D., et al., New Evidence for Mass Loss from Cephei from H I 21 cm Line Observations, ApJ, 744, 53 (2012)
- Matthews et al. (2016) Matthews, L. D., Marengo, M., Evans, N. R., A Search for Mass Loss on the Cepheid Instability Strip using HI 21-cm Line Observations, ApJ, in press, arXiv:1609.06611 (2016)
- Min et al. (2014) Min, C., Matsumoto, N., Kim, M. K., et al., Accurate parallax measurement toward the symbiotic star R Aquarii, PASJ, 66, 38 (2014)
- Minniti et al. (2010) Minniti, D., et al., VISTA Variables in the Via Lactea (VVV): The public ESO near-IR variability survey of the Milky Way, NewA, 15, 433 (2010)
- Monson et al. (2011) Monson, A. J., Pierce, M. J., Near-infrared (JHK) Photometry of 131 Northern Galactic Classical Cepheids, ApJS, 193, 12 (2011)
- Monson et al. (2012) Monson, A. J., et al., The Carnegie Hubble Program: The Leavitt Law at 3.6 and 4.5 m in the Milky Way, ApJ, 759, 146 (2012)
- Muggeo (2003) Muggeo, V. M. R., Estimating regression models with unknown break-points, Statistics in Medicine, 22, 3055 (2003).
- Muggeo (2008) Muggeo, V. R. M., An R Package to Fit Regression Models with Broken-Line Relationships, R News, 8(1), 20 (2008)
- Nakagawa et al. (2008) Nakagawa, A., Tsushima, M., Ando, K., et al., VLBI Astrometry of AGB Variables with VERA — A Semiregular Variable S Crateris —, PASJ, 60, 1013 (2008)
- Nakagawa et al. (2014) Nakagawa, A., Omodaka, T., Handa, T., et al., VLBI astrometry of AGB variables with VERA: A Mira-type variable T Lepus, PASJ, 66, 101 (2014)
- Nakagawa et al. (2016) Nakagawa, A., Kurayama, T., Matsui, M., et al., Parallax of a Mira variable R Ursae Majoris studied with astrometric VLBI, PASJ, 68, 78 (2016)
- Nakanishi & Sofue (2006) Nakanishi, H., & Sofue, Y., Three-Dimensional Distribution of the ISM in the Milky Way Galaxy: II. The Molecular Gas Disk, PASJ, 58, 847 (2006)
- Neilson et al. (2012) Neilson, H. R., et al., Classical Cepheids Require Enhanced Mass Loss, ApJ, 760, L18 (2012)
- Ngeow et al. (2005) Ngeow, C.-C., et al., Further empirical evidence for the non-linearity of the period-luminosity relations as seen in the Large Magellanic Cloud Cepheids, MNRAS, 363, 831 (2005)
- Ngeow et al. (2008) Ngeow, C., Kanbur, S. M., Nanthakumar, A., Testing the nonlinearity of the BVIcJHKs period-luminosity relations for the Large Magellanic Cloud Cepheids, A&A, 477, 621 (2008)
- Ngeow & Kanbur (2008) Ngeow, C., Kanbur, S. M., The Period-Luminosity Relation for the Large Magellanic Cloud Cepheids Derived from Spitzer Archival Data, ApJ, 679, 76-85 (2008)
- Ngeow et al. (2012) Ngeow, C.-C., et al., Calibrating the projection factor for Galactic Cepheids, A&A, 543, A55 (2012)
- Ngeow et al. (2015a) Ngeow, C.-C., et al., Period-Luminosity Relations Derived from the OGLE-III Fundamental Mode Cepheids. II. the Small Magellanic Cloud Cepheids, ApJ, 808, 67 (2015a)
- Ngeow et al. (2015b) Ngeow, C.-C., et al., Updated 24 m Period-Luminosity Relation Derived from Galactic Cepheids, ApJ, 813, 57 (2015b)
- Nidever et al. (2013) Nidever, D. L. and Monachesi, A. and Bell, E. F., et al., A Tidally Stripped Stellar Component of the Magellanic Bridge, ApJ, 779, 145 (2013)
- Nishiyama et al. (2009) Nishiyama, S., et al., Interstellar Extinction Law Toward the Galactic Center III: J, H, KS Bands in the 2MASS and the MKO Systems, and 3.6, 4.5, 5.8, 8.0 m in the Spitzer/IRAC System, ApJ, 696, 1407 (2009)
- Nyu et al. (2011) Nyu, D., Nakagawa, A., Matsui, M., et al., Astrometry of AGB Variables with VERA: Annual Parallax and the Orbit of SY Sculptoris in the Galaxy, PASJ, 63, 63 (2011)
- Olsen & Salyk (2002) Olsen, K. A. G.; Salyk, C., A Warp in the Large Magellanic Cloud Disk?, AJ, 124, 2045 (2002)
- Oz & Yannakakis (1983) W.V. Oz, M. Yannakakis (eds.), in All ACM Conferences (Academic Press, Boston, 1983).
- Paczyński, B. & Stanek (1998) Paczyński, B. & Stanek, K. Z., Galactocentric Distance with the Optical Gravitational Lensing Experiment and HIPPARCOS Red Clump Stars, ApJ, 494L, 219 (1998)
- Pejcha & Kochanek (2012) Pejcha, O., Kochanek, C. S., A Global Physical Model for Cepheids, ApJ, 748, 107 (2012)
- Perryman et al. (1997) Perryman, M. A. C., et al., The HIPPARCOS Catalogue, Astron. Astrophys., 323, L49 (1997)
- Persson et al. (2004) Persson, S. E., et al., New Cepheid Period-Luminosity Relations for the Large Magellanic Cloud: 92 Near-Infrared Light Curves, AJ, 128, 2239 (2004)
- Phillips (1993) Phillips, M., M., The absolute magnitudes of Type IA supernovae, 413L, 105 (1993)
- Pietrzyński et al. (2003) Pietrzyński, G. and Gieren, W. and Udalski, A., The Araucaria Project: Dependence of Mean K, J, and I Absolute Magnitudes of Red Clump Stars on Metallicity and Age, AJ, 125, 2494 (2003)
- Pietrzyński et al. (2010) Pietrzyński, G., et al., The dynamical mass of a classical Cepheid variable star in an eclipsing binary system, Nature, 468, 542 (2010)
- Pietrzyński et al. (2013) Pietrzyński, G., et al., An eclipsing-binary distance to the Large Magellanic Cloud accurate to two per cent, Natur, 495, 76 (2013)
- Pinsonneault et al. (2014) Pinsonneault, M. H., Elsworth, Y., Epstein, C., et al., The APOKASC Catalog: An Asteroseismic and Spectroscopic Joint Survey of Targets in the Kepler Fields, ApJS, 215, 19 (2014)
- Planck Collaboration (2016) Planck Collaboration, et al., Planck 2015 results. XIII. Cosmological parameters, A&A, 594, A13 (2016)
- Puzeras et al. (2010) Puzeras, E., Tautvaišienė, G., Cohen, J. G., et al., High-resolution spectroscopic study of red clump stars in the Galaxy: iron-group elements, MNRAS, 408, 1225 (2010)
- Rauer et al. (2014) Rauer et al, The PLATO 2.0 mission, ExA, 38, 249 (2014)
- Ren et al. (2016) Ren, J.-J., Liu, X.-W., Xiang, M.-S., et al., On the LSP3 estimates of surface gravity for LAMOST-Kepler stars with asteroseismic measurements, Research in Astronomy and Astrophysics, 16, 45 (2016)
- Rezaei et al. (2016) Rezaei Kh., S., et al., Inferring the three-dimensional distribution of dust in the Galaxy with a non-parametric method: Preparing for Gaia, arXiv, arXiv:1609.08917 (2016)
- Rich et al. (2014) Rich, J. A., et al., A New Cepheid Distance Measurement and Method for NGC 6822, ApJ, 794, 107 (2014)
- Ricker et al. (2014) Ricker, George R., et al, Transiting Exoplanet Survey Satellite (TESS), SPIE, 9143, 20 (2014)
- Rieke & Lebofsky (1985) Rieke, G. H., Lebofsky, M. J., The interstellar extinction law from 1 to 13 microns, ApJ, 288, 618 (1985)
- Rieke et al. (2004) Rieke, G. H., et al., The Multiband Imaging Photometer for Spitzer (MIPS), ApJS, 154, 25 (2004)
- Riess et al. (2011) Riess, A. G., et al., A 3% Solution: Determination of the Hubble Constant with the Hubble Space Telescope and Wide Field Camera 3, ApJ, 730, 119 (2011)
- Riess et al. (2016) Riess, A. G., et al., A 2.4% Determination of the Local Value of the Hubble Constant, ApJ, 826, 56 (2016)
- Ripepi et al. (2016) Ripepi, V., et al., The VMC Survey. XIX. Classical Cepheids in the Small Magellanic Cloud, ApJS, 224, 21 (2016)
- Romaniello et al. (2008) Romaniello, M., et al., The influence of chemical composition on the properties of Cepheid stars. II. The iron content, A&A, 488, 731 (2008)
- Román-Zúñiga et al. (2007) Román-Zúñiga, C. G., et al., The Infrared Extinction Law at Extreme Depth in a Dark Cloud Core, ApJ, 664, 357 (2007)
- Roeser et al. (2010) Roeser, S., Demleitner, M., & Schilbach, E., The PPMXL Catalog of Positions and Proper Motions on the ICRS. Combining USNO-B1.0 and the Two Micron All Sky Survey (2MASS), AJ, 139, 2440 (2010)
- Rubele et al. (2015) Rubele, S. and Girardi, L. and Kerber, L., et al., The VMC survey - XIV. First results on the look-back time star formation rate tomography of the Small Magellanic Cloud, MNRAS, 449, 639 (2015)
- Salaris & Girardi (2002) Salaris, M. & Girardi, L., Population effects on the red giant clump absolute magnitude: the K band, MNRAS, 337, 332 (2002)
- Schlafly et al. (2016) Schlafly, E. F., et al., The Optical-infrared Extinction Curve and Its Variation in the Milky Way, ApJ, 821, 78 (2016)
- Schölkopf et al. (1998) Schölkopf, B., Smola, A., & Müller, K.-R., Nonlinear component analysis as a kernel eigenvalue problem, Neural computation, 10, 1299 (1998)
- Scowcroft et al. (2011) Scowcroft, V., et al., The Carnegie Hubble Program: The Leavitt Law at 3.6 m and 4.5 m in the Large Magellanic Cloud, ApJ, 743, 76 (2011)
- Scowcroft et al. (2016a) Scowcroft, V., et al., The Carnegie Chicago Hubble Program: the mid-infrared colours of Cepheids and the effect of metallicity on the CO band-head at 4.6 m, MNRAS, 459, 1170 (2016a)
- Scowcroft et al. (2016b) Scowcroft, V., et al., The Carnegie Hubble Program: The Distance and Structure of the SMC as Revealed by Mid-infrared Observations of Cepheids, ApJ, 816, 49 (2016b)
- Sesar et al. (2010) Sesar, B., et al., Light Curve Templates and Galactic Distribution of RR Lyrae Stars from Sloan Digital Sky Survey Stripe 82, ApJ, 708, 717 (2010)
- Shintani et al. (2008) Shintani, M., Imai, H., Ando, K., et al., Statistical Properties of Stellar H2O Masers — Results of Three-Year Single-Dish Observations with the VERA Iriki Telescope, PASJ, 60, 1077 (2008)
- Siebert et al. (2011) Siebert, A., Famaey, B., Minchev, I., et al., Detection of a radial velocity gradient in the extended local disc with RAVE, MNRAS, 412, 2026 (2012)
- Simon & Lee (1981) Simon, N. R., Lee, A. S., The structural properties of Cepheid light curves, ApJ, 248, 291 (1981)
- Soszyński et al. (2005) Soszyński, I., Gieren, W., Pietrzyński, G., Mean JHK Magnitudes of Fundamental-Mode Cepheids from Single-Epoch Observations, PASP, 117, 823 (2005)
- Soszyński et al. (2008) Soszyński, I., et al., The Optical Gravitational Lensing Experiment. The OGLE-III Catalog of Variable Stars. I. Classical Cepheids in the Large Magellanic Cloud, AcA, 58, 163 (2008)
- Soszyński et al. (2010) Soszyński, I., et al., The Optical Gravitational Lensing Experiment. The OGLE-III Catalog of Variable Stars. VII. Classical Cepheids in the Small Magellanic Cloud, AcA, 60, 17 (2010)
- Stanek & Garnavich (1998) Stanek, K. Z.; Garnavich, P. M., Distance to M31 with the Hubble Space Telescope and HIPPARCOS Red Clump Stars, ApJ, 503, 131 (1998)
- Stanek et al. (1998) Stanek, K. Z.; Zaritsky, D.; Harris, J., A “Short” Distance to the Large Magellanic Cloud With the Hipparcos Calibrated Red Clump Stars, ApJ, 500, 141 (1998)
- Stello et al. (2013) Stello, Dennis; Huber, Daniel; Bedding, Timothy R., et al. Asteroseismic Classification of Stellar Populations among 13,000 Red Giants Observed by Kepler, ApJ, 765, 41 (2013)
- Stello et al. (2015) Stello. D., et al., Oscillating Red Giants Observed during Campaign 1 of the Kepler K2 Mission: New Prospects for Galactic Archaeology, ApJ, 809, 3 (2015)
- Storm et al. (2011a) Storm, J., et al., Calibrating the Cepheid period-luminosity relation from the infrared surface brightness technique. I. The p-factor, the Milky Way relations, and a universal K-band relation, A&A, 534, A94 (2011a)
- Storm et al. (2011b) Storm, J., et al., Calibrating the Cepheid period-luminosity relation from the infrared surface brightness technique. II. The effect of metallicity and the distance to the LMC, A&A, 534, A95 (2011b)
- Storm et al. (2004) Storm, J., et al., The effect of metallicity on the Cepheid Period-Luminosity relation from a Baade-Wesselink analysis of Cepheids in the Galaxy and in the Small Magellanic Cloud, A&A, 415, 531 (2004)
- Subramanian & Subramaniam (2009) Subramanian, S., Subramaniam, A., Depth estimation of the Large and Small Magellanic Clouds, A&A, 496, 399 (2009)
- Subramanian & Subramaniam (2010) Subramanian, S.; Subramaniam, A., An estimate of the structural parameters of the Large Magellanic Cloud using red clump stars, A&A, 520, 135 (2010)
- Subramanian & Subramaniam (2012) Subramanian, Smitha; Subramaniam, Annapurni., The Three-dimensional Structure of the Small Magellanic Cloud, ApJ, 744, 128 (2012)
- Subramanian & Subramaniam (2013) Subramanian, S., Subramaniam, A., Structure of the Large Magellanic Cloud from near infrared magnitudes of red clump stars, A&A, 552, A144 (2013)
- Subramanian et al. (2017) Subramanian, Smitha; Rubele, Stefano; Sun, Ning-Chen; et al., The VMC Survey - XXIV. Signatures of tidally stripped stellar populations from the inner Small Magellanic Cloud, MNRAS, 467, 2980 (2017)
- Tammann et al. (2003) Tammann, G. A., Sandage, A., Reindl, B., New Period-Luminosity and Period-Color relations of classical Cepheids: I. Cepheids in the Galaxy, A&A, 404, 423 (2003)
- Udalskiet al. (1998) Udalski, A.; Szymanski, M.; Kubiak, M.; Pietrzynski, G.; Wozniak, P.; Zebrun, K., Optical Gravitational Lensing Experiment. Distance to the Magellanic Clouds with the Red Clump Stars: Are the Magellanic Clouds 15% Closer than Generally Accepted?, AcA, 48, 1 (1998)
- Udalski (2015) Udalski, A., Variable Stars Toward the Magellanic Clouds and the Galactic Bulge, ASPC, 491, 278 (2015)
- van den Berg (1975) van den Bergh, S., The Extragalactic Distance Scale, gaun.book, 509 (1975)
- van Leeuwen et al. (1997) van Leeuwen, F., Feast, M. W., Whitelock, P. A., & Yudin, B., First results from HIPPARCOS trigonometrical parallaxes of Mira-type variables, MNRAS, 287, 955 (1997)
- van Leeuwen et al. (2007a) van Leeuwen, F., et al., Cepheid parallaxes and the Hubble constant, MNRAS, 379, 723 (2007a)
- van Leeuwen et al. (2007b) van Leeuwen, F., Hipparcos, the New Reduction of the Raw Data. By Floor van Leeuwen, Institute of Astronomy, Cambridge University, Cambridge, UK Series: Astrophysics and Space Science Library (2007b)
- Vlemmings et al. (2003) Vlemmings, W. H. T., van Langevelde, H. J., Diamond, P. J., Habing, H. J., & Schilizzi, R. T., VLBI astrometry of circumstellar OH masers: Proper motions and parallaxes of four AGB stars, Astron. Astrophys., 407, 213 (2003)
- Vlemmings et al. (2007) Vlemmings, W. H. T., & van Langevelde, H. J., Improved VLBI astrometry of OH maser stars, Astron. Astrophys., 472, 547 (2007)
- Wegg & Gerhard (2013) Wegg, Christopher; Gerhard, Ortwin., Mapping the three-dimensional density of the Galactic bulge with VVV red clump stars, MNRAS, 435, 1874 (2013)
- Werner et al. (2004) Werner, M. W., et al., The Spitzer Space Telescope Mission, ApJS, 154, 1 (2004)
- Westerlund (1961) Westerlund, B., The Nebulosity Around RS Puppis, PASP, 73, 72 (1961)
- Whitelock & Feast (2000) Whitelock, P., & Feast, M., Hipparcos parallaxes for Mira-like long-period variables, MNRAS, 319, 759 (2000)
- Williams et al. (2013) Williams, M. E. K., Steinmetz, M., Binney, J., et al., The wobbly Galaxy: kinematics north and south with RAVE red-clump giants, MNRAS, 436, 101 (2013)
- Wood et al. (1999) Wood, P. R., Alcock, C., Allsman, R. A., et al., MACHO observations of LMC red giants: Mira and semi-regular pulsators, and contact and semi-detached binaries, 191, 151 (1999)
- Wyman et al. (2014) Wyman, M., et al., Neutrinos Help Reconcile Planck Measurements with the Local Universe, PhRvL, 112, 051302 (2014)
- Xiang et al. (2015) Xiang, M. S., Liu, X. W., Yuan, H. B., et al., The LAMOST stellar parameter pipeline at Peking University - LSP3, MNRAS, 448, 822 (2015)
- Yuan et al. (2015) Yuan, H.-B., Liu, X.-W., Huo, Z.-Y. et al., LAMOST Spectroscopic Survey of the Galactic Anticentre (LSS-GAC): target selection and the first release of value-added catalogues, MNRAS, 448, 855 (2015)
- Zacharias et al. (2013) Zacharias, N., Finch, C. T., Girard, T. M., et al., The Fourth US Naval Observatory CCD Astrograph Catalog (UCAC4), AJ, 145, 44 (2013)
- Zhang et al. (2012) Zhang, B., Reid, M. J., Menten, K. M., Zheng, X. W., & Brunthaler, A., The distance and size of the red hypergiant NML Cygni from VLBA and VLA astrometry, Astron. Astrophys., 544, AA42 (2012)