The radio structure of the peculiar narrow-line Seyfert 1 galaxy candidate J1100+4421
Abstract
Narrow-line Seyfert 1 galaxies (NLS1) are an intriguing subclass of active galactic nuclei. Their observed properties indicate low central black hole mass and high accretion rate. The extremely radio-loud NLS1 sources often show relativistic beaming and are usually regarded as younger counterparts of blazars. Recently, the object SDSS J110006.07442144.3 was reported as a candidate NLS1 source. The characteristics of its dramatic optical flare indicated its jet-related origin. The spectral energy distribution of the object was similar to that of the -ray detected radio-loud NLS1, PMN J09480022. Our high-resolution European Very Long Baseline Interferometry Network observations at and GHz revealed a compact core feature with a brightness temperature of K. Using the lowest brightness temperature value and assuming a moderate Lorentz factor of the jet viewing angle is . Archival Very Large Array data show a large-scale radio structure with a projected linear size of kpc reminiscent of double-sided morphology.
keywords:
galaxies: active – galaxies: Seyfert – galaxies: individual: SDSS J110006.07+442144.31 Introduction
Narrow-line Seyfert 1 galaxies (NLS1, e.g. Pogge, 2000) form a special subclass of active galactic nuclei (AGN). They were first recognized as Seyfert 1 galaxies with unusually narrow H i lines (Osterbrock & Pogge, 1985). NLS1 sources are identified by three features: (i) narrow permitted optical lines, with full width at half-maximum FWHM(H km s-1, (ii) a flux ratio of [O iii]5007 to H smaller than 3, and (iii) the strong emission feature caused by Fe ii multiplets. The latter indicates a direct view to the accretion disk, although very recently, based upon the spectroscopic studies of a large sample of NLS1 candidate sources, Cracco et al. (2016) concluded that NLS1 sources do not necessarily have strong Fe ii emission lines. The relatively narrow widths of the permitted lines are explained with the lower velocities of the clouds in the broad-line region orbiting a low-mass black hole, M⊙ (Mathur, 2000). These low-mass black holes in NLS1 sources accrete at high rates, close to the Eddington limit (e.g. Collin & Kawaguchi, 2004, and references therein).
Concerning the radio emission, statistical studies showed that only per cent of NLS1 sources are radio loud (e.g. Zhou et al., 2006; Komossa et al., 2006). The radio-loudness is commonly assessed following the original prescription of Kellermann et al. (1989), using the ratio of the cm radio flux density to the Å optical flux density (), and sources are usually classified to be radio-loud if (e.g., Komossa et al., 2006). Most of the radio-loud NLS1 (RLNLS1) sources have steep spectra and resemble the compact steep-spectrum sources (Komossa et al., 2006). However, the extremely radio-loud NLS1s ( per cent of NLS1 sources, with ; Komossa et al., 2006) show blazar-like properties: flat radio spectrum, compact radio cores, substantial variability, high brightness temperatures, flat X-ray spectra, and blazar-like spectral energy distribution (e.g. Yuan et al., 2008). Thus, these objects are thought to possess relativistic jets which are seen at a small angle to the line of sight, similarly to blazars. This claim was further strengthened by the Fermi satellite discovery of high-energy emission from a handful of RLNLS1 sources (e.g. Yao et al., 2015; Karamanavis, 2015; Foschini, 2011, and references therein). Further support of their blazar-like nature came from the Monitoring Of Jets in Active galactic nuclei with VLBA Experiments (MOJAVE, Lister et al., 2009) survey. Among the five Fermi-detected RLNLS1 sources included in their sample, three show jet components moving at superluminal speeds (Lister et al. 2016; see also Fuhrmann et al. 2016).
Thus, flat-spectrum RLNLS1 sources are thought to be similar to blazars, but residing (mostly) in spiral host galaxies with central black holes of lower masses (Crenshaw et al., 2003). A statistical study by Berton et al. (2015) showed that the black hole mass distribution is the same for steep-spectrum and flat-spectrum RLNLS1 sources. The suggested scenario of Berton et al. (2015) is that at larger inclination angle, instead of flat-spectrum RLNLS1 sources, one starts to see steep-spectrum RLNLS1 sources. At even larger inclination angles, the Doppler effect broadens the line in the disk-like shaped broad-line regions (e.g., Shen & Ho, 2014) and a broad-line radio galaxy hosted by a disk galaxy can be observed. Finally, when looking through the obscuring torus, the objects are described as narrow-line radio galaxies hosted by disk galaxies.
The multi-wavelength study of Järvelä et al. (2015) showed that the jet is the main source of the radio, optical and X-ray emission in RLNLS1 sources, while in radio-quiet NLS1 sources the infrared and radio emission mostly originate from star formation. The origin of infrared emission in RLNLS1 sources however is unclear, it is possible that star-formation and reradiated emission from the torus also contribute (Caccianiga et al., 2015; Järvelä et al., 2015).
SDSS J110006.07442144.3 (hereafter, J11004421) is a newly-discovered NLS1 candidate source. It was found in the Kiso Supernova Survey (Morokuma et al., 2014) by Tanaka et al. (2014) thanks to its dramatic optical flare on 2014 February 23.
Follow-up observations of Tanaka et al. (2014) revealed that the FWHMs of the broad components of Mg ii and H lines in J11004421 are smaller than . The redshift of the source was measured to be . It was classified as an NLS1 candidate. Tanaka et al. (2014) calculated the black hole mass, M⊙, using the Mg ii line, and M⊙ using the H line. They also calculated the bolometric luminosity ( erg s-1), which is 30 per cent of the Eddington luminosity. These values are consistent with the findings of Foschini et al. (2015), who analyzed the multi-wavelength properties of 42 RLNLS1s, and found Eddington ratios of 1 per cent to 49 per cent, and black hole masses in the range of M⊙. However J11004421 did not show a Fe ii bump, and the flux ratio of the [O iii] line to the H is much larger () than the value used to define NLS1 sources. According to Tanaka et al. (2014), the former can be attributed to the flaring state of the source, which can cause the emergence of strong continuum emission. With respect to the latter, the luminosity of the [O iii] line was shown to correlate with the radio power (Labiano, 2008). Thus, Tanaka et al. (2014) argue that the especially luminous line in J11004421 may be related to strong jet emission in the source. The presence of jet is also indicated by the extreme radio-loudness of J11004421. The ratio of the GHz flux density measured in the Faint Images of the Radio Sky at Twenty-Centimeters (FIRST) survey (Becker et al., 1995) to the quiescent flux density measured at Å is . When the optical flux density is measured at the highest point of the flaring state, this ratio is still (Tanaka et al., 2014).
To image the radio structure of the source at milliarcsecond (mas) resolution and ascertain whether it has a blazar-like jet emission, we observed J11004421 with very long baseline interferometry (VLBI) using the European VLBI Network (EVN) at 1.7 and 5 GHz. We also searched for a possible -ray counterpart to J11004421 in the latest Fermi/Large Arae Telescope (LAT) data. In the following, we assume a flat CDM cosmological model with km s-1 Mpc-1, , and . At the redshift of the source (), ″angular size corresponds to kpc projected linear size (Wright, 2006).
2 Observations and Data Reduction
2.1 EVN Data
The EVN observations of J11004421 took place on 2015 February 10 at 1.7 GHz and on 2015 March 24 at 5 GHz. At 1.7 GHz, the interferometric array consisted of seven antennas: Effelsberg (Germany), the Jodrell Bank Mark 2 telescope (the United Kingdom), Medicina (Italy), Onsala (Sweden), Toruń (Poland), the Westerbork Synthesis Radio Telescope (WSRT, the Netherlands), and Sheshan (China). At 5 GHz, Noto (Italy) and Yebes (Spain) were also added to the array. However, Medicina did not observe and the WSRT produced no useful data at the higher frequency.
The observations were carried out in e-VLBI mode (Szomoru, 2008). The signals received at the radio telescopes were transmitted over optical fiber networks directly to the central data processor for real-time correlation. The correlation with s integration time was done at the EVN software correlator (SFXC, Keimpema et al., 2015), in the Joint Institute for VLBI ERIC (JIVE), Dwingeloo, the Netherlands. Eight intermediate frequency channels (IFs) were used in both polarizations at both bands. Each IF had a width of MHz and was divided into 32 spectral channels. The total bandwidth was MHz. The observations were performed in phase-reference mode (Beasley & Conway, 1995). The target and the phase calibrator were observed alternately, with min spent on the target and min spent on the calibrator. The phase-reference calibrator used at both frequencies was J11084330, separated by from the target in the sky. Its coordinates are right ascension and declination , the uncertainties are mas in both directions.111Data are obtained from http://astrogeo.org maintained by L. Petrov, rfc2015b solutions Additionally, 4C39.25 was included as fringe-finder at both bands. The observations lasted for h and h, and on-source integration times were min and min, at and GHz, respectively.
The data were reduced in the standard manner (Diamond, 1995) using the U.S. National Radio Astronomy Observatory (NRAO) Astronomical Image Processing System (aips, Greisen, 2003). First, interferometric visibility amplitudes were calibrated using the gain curves and system temperature measurements obtained at the telescope sites. Then fringe-fitting was performed on the phase-calibrator and fringe-finder sources. Their visibility data were exported to be imaged with the difmap program package (Shepherd et al., 1994). The hybrid mapping procedure was used with several cycles of cleaning (Högbom, 1979) and phase self-calibration. Gain correction factors were determined in difmap and subsequently were used in aips to scale the amplitudes. The average corrections factors did not exceed 10 per cent. Four-four channels, the most affected by the bandpass response function, were discarded at the beginning and end of each IF. Then fringe-fitting on the calibrator was repeated in aips, now taking into account its brightness distribution using its clean component model obtained in difmap. The derived solutions were interpolated and applied to the target source, J1100+4421. The hybrid mapping of the target was also performed in difmap. No amplitude self-calibration was attempted on the source, and phase self-calibration was not done for Sheshan for time intervals shorter than min at GHz and min at GHz.
Since J11004421 was sufficiently bright and compact, we also performed fringe-fitting directly on the target source at both frequencies. Then we imaged the source in the same way as described above. The images obtained (Fig. 1 and Fig. 2) were in good agreement with those obtained by transferring the phase solutions of the calibrator. Comparing the peak brightness values in the two images in both bands, the coherence loss in phase-referencing was per cent at GHz and per cent at GHz.
2.2 Archival VLA data
J11004421 was also observed during a -s snapshot at GHz with the Very Large Array (VLA) in its most extended A configuration on 1995 August 15 (project code: AM484) within the Cosmic Lens All-Sky Survey (Myers et al., 2003). The data were downloaded from the NRAO archive222http://archive.nrao.edu and analyzed following standard data reduction steps in aips. The absolute flux density calibrator used in the project was 3C286. The calibrated visibility data were exported from aips, imaging was done in difmap. The resulting map is shown in Fig. 3. The weights of the data points are set inversely proportional to the amplitude errors (natural weighting).
2.3 Fermi Large Area Telescope data
J1100+4421 has no associated counterpart in the newest and so far most comprehensive -ray catalogue the Fermi/LAT 4-Year Point Source Catalogue (3FGL, Acero et al., 2015). The closest 3FGL source is 3FGL J1105.7+4427 with a separation of more than .
We analysed data from LAT using the Fermi/LAT Science Tools v10r0p5333http://fermi.gsfc.nasa.gov/ssc/data/analysis/software/ software package. The LAT data were extracted in a circle with radius around the coordinates of J1100+4421, over the whole energy range, choosing only LAT data type ‘photon’. We used the unbinned likelihood analysis and followed the provided tutorial444http://fermi.gsfc.nasa.gov/ssc/data/analysis/scitools/likelihood$_$tutorial.html in the data reduction. The parameters used for different tasks were the ones suggested in the tutorial. First, only events of class ‘source’ in the energy band of 100 MeV – 100 GeV were chosen using gtselect, and a zenith angle cut of was implemented to remove the disturbance caused by the Earth’s limb. Next gtmktime was used to select only the good time intervals for further analysis. Exposure map was generated using gtltcube and gtexpmap. The newest galactic diffuse emission model (glliemv06.fits) and the extragalactic isotropic diffuse emission model (isoP8R2SOURCEV6v06.txt), which includes the residual cosmic-ray background, were used for computing the diffuse source responses with gtdiffrps. Finally, J1100+4421 and all the sources within radius (29 sources) were modeled with gtlike using powerlaw2 model and the unbinned likelihood algorithm with optimizer MINUIT.
We first integrated over the whole time period from 2008 August 5 00:00:00 UTC to 2016 December 19 00:00:00 UTC (3058 days) for which we have data. There are some very faint sources nearby, having test statistic (TS) values less than 0, causing the fit not to converge. We kept removing the sources with TS0, except J1100+0044, and running the reduction again, until the TS values of all nearby sources were positive. Over the whole period the TS value for J1100+0044 was negative, meaning that the fit without the source is better than with it, implying that it is very improbable that this source has emitted detectable -rays during this period. To verify this result we integrated over the same time period in bins of 180 days, resulting in 17 bins, using the same parameters and procedure. The TS value for J1100+4421 was negative in every bin, further indicating that J1100+4421 has not been active at -rays between 2008 August and 2016 December. The upper limit of the -ray flux is photon cm-2 s-1 in the MeV– GeV energy band.
3 Results
3.1 The pc-scale radio structure


A single, compact radio-emitting feature was detected at GHz in our EVN observations (Fig. 2). At GHz, an additional feature is detected north from the central source (Fig. 1). The phase-referencing observations allowed us to obtain the accurate coordinates of J11004421. We used the maxfit verb in aips to determine the right ascension and declination of the brightness peak at the -GHz EVN image: , . The coordinates are the same within the uncertainties at the two observing frequencies. We estimate that the obtained coordinates are accurate within mas.
| ID | Relative position | Flux density | FWHM | peak | beam size | PA | rms | ||
| (GHz) | RA (mas) | Dec. (mas) | (mJy) | (mas) | mJy beam-1 | (masmas) | (°) | (mJy beam-1) | |
| C | – | – | 19.4 | ||||||
| 1.7 | N | – | – | – | – | ||||
| C | – | – | 23.2 | ||||||
We used difmap to fit the visibilities with brightness distribution models. At GHz, two circular Gaussian components are needed (labelled C and N), while at GHz, a single circular Gaussian component (C) adequately modelled the visibilities. The parameters of the fitted components (projected separations from the core, flux densities and FWHM sizes) are summarized in Table 1.
Using the size and flux density values derived from the higher frequency measurement, one can calculate the brightness temperature as
| (1) |
where is the redshift of the source, is the flux density given in Jy, is the FWHM size in mas, and is the observing frequency in GHz. The obtained brightness temperature is K. However, if the FWHM size derived from the modelfit is smaller than the smallest resolvable size of the array, the component is unresolved, and the brightness temperature value is only a lower limit. According to Kovalev et al. (2005), the minimum resolvable FWHM size of a Gaussian component in our observation at GHz would be mas along the major axis of the restoring beam, indicating that the feature is not unresolved. However, the more recent work of Natarajan et al. (2017) showed that calibration uncertainties have significant effect on the minimum resolvable size. Investigating synthetic observations made with an array very similar to our EVN observation, they concluded that the minimum resolvable size can be a factor of two larger, mas. Therefore, the fitted FWHM size of the component is an upper limit, and the derived brightness temperature of J11004421 can be regarded as a lower limit only.
The recovered flux density of the core component was somewhat larger at GHz than at GHz. Formally the compact source has a spectral index of (). However, we note that the EVN observations were not simultaneous but separated by 6 weeks. Compact radio-emitting AGN are known to show variations in the radio on timescales of weeks to months.555Notably, near-infrared and optical monitoring of J11004421 by Morokuma et al. (2017) showed that J11004421 underwent a major flare a few days prior to our GHz EVN observation. Therefore, flux density variability may affect the spectral index estimate. We did not see at GHz any counterpart of the northern feature detected at GHz (Fig.1). The largest recovarable size of an interferometer array can be estimated as , where is the observing wavelength and is the shortest baseline in the array (Wrobel, 1995). In our GHz EVN observation, the shortest baseline is km (the distance between Onsala and Toruń), thus the largest recoverable size is mas. Therefore, a radio feature as large as the northern component in the -GHz image, mas, cannot be detected by our array used at GHz. If it is smaller than the largest recoverable size ( mas) at GHz, then its non-detection implies that its flux density is mJy considering the image noise level ( mJy beam-1). Either way, we cannot meaningfully constrain the spectral index of this component. However, its characteristics measured at GHz are indicative of a more extended jet-related emission. The non-detection at GHz also shows that there is no compact bright radio emitting region within this structure.
3.2 The kpc-scale radio structure


In the archival -GHz VLA map of J11004421 (Fig. 3) a single radio source can be seen. Model-fitting to the visibility data was performed in difmap. A model containing a single circular Gaussian component adequately describes the data. Its flux density and FWHM size are mJy and , respectively.
According to the FIRST (Becker et al., 1995) survey, J11004421 shows an extended radio structure at GHz (Fig. 4). In the most recent FIRST catalog (Helfand et al., 2015), the source is described with an elliptical Gaussian component with a FWHM size of , at a position angle of and integral flux density of mJy. (The errors of the flux density and the position angle are not given in the catalog, therefore we determined it from the FIRST image directly.) The peak brightness in the 1.4-GHz FIRST image is mJy beam-1. The mean epoch of the observation is with an rms of d. The flux density of the radio features detected with our EVN observation ( mJy) at a close frequency ( GHz) originates from the central region not resolved by FIRST, while the EVN is not sensitive to arcsec-scale emission recovered in FIRST. Thus the radio core of J11004421 must have brightened significantly during the yr elapsed between the FIRST and EVN observations.
At larger scales, J11004421 is unresolved in the 1.4-GHz NRAO VLA Sky Survey (NVSS, Condon et al., 1998), with a flux density of mJy. This is higher than the flux density measured in the FIRST survey. The difference can be because of possible additional large-scale structure that was resolved out in the FIRST map but was imaged at the lower resolution of the NVSS, or this can be also due to flux density variability of the compact core of J11004421. The NVSS observations took place two years before the FIRST observation. The mean epoch of the NVSS observations is , with an rms of d.
4 Discussion
4.1 The characteristics of the VLBI jet
The derived brightness temperature value is close to but does not exceed the commonly-used equipartition brightness temperature limit of K by Readhead (1994). It is still lower than the intrinsic brightness temperature of K derived by Homan et al. (2006) for a sample of radio-loud AGN during their quiescent (not flaring) state, and thus the Doppler factor would be . However, since the derived brightness temperature is just a lower limit, Doppler boosting in J11004421 cannot be excluded. If the source is indeed unresolved in our 5GHz EVN observation and the FWHM size of the emitting region is much smaller than the modelfit result, mas, the brightness temperature would exceed the equipartition limit.
In general the low brightness temperature value is not uncommon in RLNLS1 sources. Gu et al. (2015) observed fourteen RLNLS1 sources with very high radio-loudness value () using the Very Long Baseline Array (VLBA) between and GHz. They found that the brightness temperature values of the core components are within K and K, with a median value of K, which agrees well with the brightness temperature we derived for J11004421. Gu et al. (2015) explain the low brightness temperature values with intrinsically low jet power. Based upon the moderate radio variability seen in a sample of RLNLS1 sources, Angelakis et al. (2015) also propose that the jets of RLNLS1 are mildly relativistic, and similar conclusion was drawn by Richards & Lister (2015) who investigated three RLNLS1 with large scale radio structures. It was hypothised that the lower bulk jet speed can be related to the lower black hole mass compared to the more energetic blazars (Foschini et al., 2015).
If we assume a Lorentz factor e.g., which was derived by Karamanavis (2015) for the RLNLS1 source 1H 0323342 with a similar black hole mass (Zhou et al., 2007) as that of J11004421, and supposing that the brightness temperature is close to the derived lower limit, we obtain a viewing angle of . This should be considered as an upper limit on the actual viewing angle. The compact mas-scale radio morphology does indicate that the viewing angle of the jet cannot be too large, since above a few tens of degrees, one would expect to see a morphology reminiscent of a more resolved source rather than a single compact feature.
Tanaka et al. (2014) pointed out that the observed optical variability is similar to that of the -ray detected RLNLS1 sources. They compared the spectral energy distribution of J11004421 to the -ray-loud RLNLS1s of PMN J09480022, and PKS 2004447 (Abdo et al., 2009a, b) and hypothesized that assuming the same photon index as that of PMN J09480022, the upper limit of its -ray luminosity would be comparable to the measured -ray luminosity of PMN J09480022. However, our analysis of all available Fermi/LAT data resulted in no detection of -rays at the position of J11004421.
Morokuma et al. (2017) conducted extensive monitoring of J11004421 in the optical and near-infrared bands. They showed that based upon the spectral shape, the optical and near-infrared emission of the source is dominated by emission from the jet. From the fastest observed variations, and assuming a Doppler factor of , they estimate that the region responsible for the variability must be smaller than cm.
4.2 The large-scale radio structure
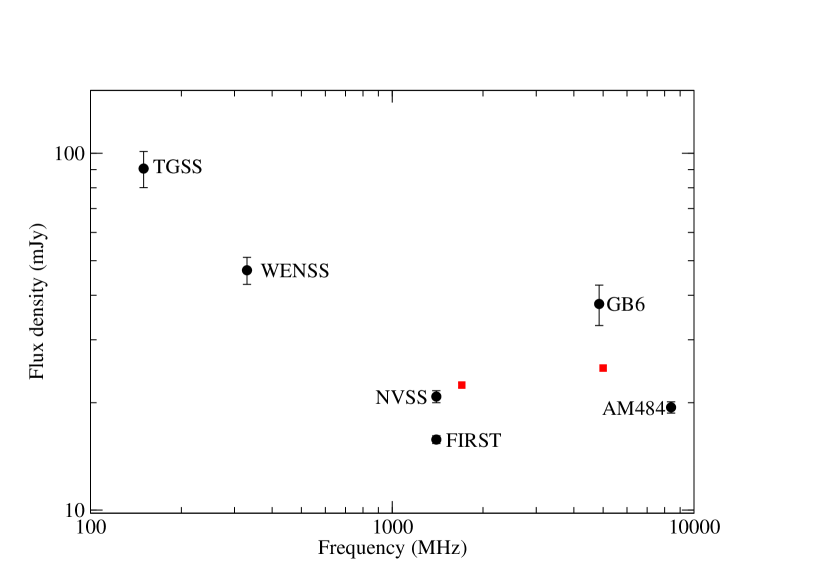
In Fig. 5, the radio flux density measurements of J11004421 are summarized. The data are not simultaneous, and the observations are conducted with different angular resolutions, therefore source variability as well as resolution issues may complicate the picture. Nevertheless, up until 1.4 GHz, the spectrum seems to follow a steep power-law, which might flatten afterwards. The red symbols represent the total flux density recovered in our high resolution EVN observations. The 1.7-GHz datapoint clearly shows the source variability (as discussed in Sect. 3.2), while the discrepancy between the two 5-GHz data points can also be caused by the different resolutions of the observations (the EVN observation recovered only the pc-scale core emission, while in the Green Bank 4.85-GHz radio survey (Gregory et al., 1996) the kpc-scale scale structure could have been measured as well), as well as source variability.
The kpc-scale radio emission around J1100+4421 can only be seen in the FIRST image. In the 8-GHz VLA image, there was no additional radio emission above mJy beam-1, image noise level in a region around the source. This may indicate that the extended emission has a steep spectrum between GHz and GHz. The circular Gaussian component describing the northern feature detected at 1.7 GHz in our EVN observation is at mas, corresponding to pc projected distance form the core. This feature may be the jet connecting to the northern lobe seen in the FIRST image. There is no sign of any other radio emission down to a noise level of mJy beam-1 () at a region of around the center in the EVN image. If the two lobes contained compact features, the sensitivity of our EVN observation would have been adequate to detect them. Therefore, they are not compact, their sizes have to be larger than the largest recoverable size of the interferometer (Wrobel, 1995), which is mas in the 1.7-GHz EVN observation, corresponding to pc at the redshift of J11004421.
The morphology of the large-scale structure of J11004421 can be classified as two-sided. Doi et al. (2012) calculated the core dominance parameter for six RLNLS1 with kpc-scale radio structures as the flux density ratio between the core and lobes measured in the FIRST images. To disentangle the emission from the lobe and core region, we fitted the central region of the FIRST image of J11004421 with a circular Gaussian component. To keep this feature compact, we used a fixed size of , the clean beam size of the image. The resulting flux density of this unresolved component is mJy. Then we used the aips verb imstat to measure the flux density of the lobes in the residual image. They each have flux densities of mJy. Thus, the core dominance parameter is for J11004421, the smallest among the core-dominated sources in Doi et al. (2012). Following Doi et al. (2012), we can estimate the jet kinetic energy in the large-scale radio structure of J11004421. The -GHz radio power of a mJy flux density lobe in J11004421 assuming a spectral index of is . According to the scaling relation of Cavagnolo et al. (2010) the jet kinetic power is thus W. This value is slightly higher than the minimum value, W estimated to be necessary to create supersonic lobes according to Doi et al. (2012). Thus the radio power in the extended structure of J11004421 is intermediate between the radio powers in FRI and FRII radio galaxies (Fanaroff & Riley, 1974).
Currently, there are a handful RLNLS1 sources reported to have extended, kpc-scale radio structure (Whalen et al., 2006; Antón et al., 2008; Gliozzi et al., 2010; Doi et al., 2012; Richards & Lister, 2015; Congiu et al., 2017), the projected size ranging between kpc and kpc. Additionally, recently Yao et al. (2015) reclassified a flat-spectrum quasar, SDSS J122222.55041315.7 as an NLS1 source. According to its FIRST image and the VLA measurement at GHz reported by Kharb et al. (2010), this RLNLS1 also exhibits a significant extended radio emission, with a projected linear size of kpc. Thus the extended radio emission seen in J11004421 (Fig. 4), with a projected size of kpc at GHz, is among the largest of the known RLNLS1 sources.
Assuming similar kpc-scale velocities as the ones for the six RLNLS1 sources investigated by Doi et al. (2012), it would require yr to build the radio morphology seen in the FIRST image. However this is a lower limit only, since the viewing angle of the structure is not known, therefore its deprojected size might be larger. On the other hand, the similar flux density values seen in both lobes may indicate that the structure is oriented close to the plane of the sky.
Morokuma et al. (2017) report on the detection of a faint galaxy at a distance of to the east from J11004421. We did not detect any radio counterpart at the position of this galaxy down to and , level from the VLA -GHz data and our EVN -GHz data, respectively. However it seems unlikely, it cannot be completely ruled out that the large-scale radio structure detected in the FIRST observation is partly related to this galaxy.
5 Summary
The source J11004421 was discovered during a dramatic optical flare by Tanaka et al. (2014). Based upon the follow-up optical observations, which showed unusually narrow broad lines, the source was classified as a candidate NLS1 source. However, the two other defining charateristics of NLS1 sources (presence of Fe ii bump and low flux of [O iii] compared to H line) do not apply to J11004421. Nevertheless, the derived low black hole mass and relatively high Eddington rate are in agreement with the proposed possible NLS1 nature of the source (Cracco et al., 2016). Tanaka et al. (2014) suggested that the optical flare is most probably caused by the jet emission, and the optical and near-infrared monitoring campaign of Morokuma et al. (2017) showed that both the optical and near-infrared emissions are dominated by synchrotron radiation from the jet.
Our high-resolution EVN observations showed that the source indeed has a mas-scale compact radio structure, similar to other very radio-loud NLS1 sources. The derived lower limit on the brightness temperature is K, which is below but still consistent with the equipartition limit, therefore we cannot exclude the presence of Doppler boosting in the source. At lower resolution, J1100+4412 shows an extended, two-sided radio morphology of kpc, which is among the largest of the known RLNLS1 sources. Somewhat contrary to the results of the VLBI observations, the large-scale radio emission indicates that the radio structure is oriented close to the plane of the sky. So far the source has not been detected in the Fermi/LAT -ray mission.
To reveal the connection and possible jet bending between the inner, compact radio-emitting feature and the large-scale lobes, high-sensivity, intermediate-resolution radio interferometric observations are desirable. Comparing the flux densities measured in different radio observations, it is clear that J11004421 shows significant variability at cm wavelengths at least on time scales of years. If the source show radio variability on shorter time scales, frequent radio flux density monitoring could provide independent estimate of the Doppler factor.
Acknowledgements
We thank the referee for careful reading of the manuscript and for his/her comments, which helped to improve the paper. K. É. G. was supported by the János Bolyai Research Scholarship of the Hungarian Academy of Sciences. We wish to thank Venkatessh Ramakrishnan for the help with the Fermi data reduction. The European VLBI Network is a joint facility of independent European, African, Asian, and North American radio astronomy institutes. Scientific results from data presented in this publication are derived from the following EVN project code: EG087. The e-VLBI research infrastructure in Europe was supported by the European Community’s Seventh Framework Programme (FP7/2007-2013) under grant agreement RI-261525 NEXPReS. The research leading to these results has received funding from the European Commission Seventh Framework Programme (FP/2007-2013) under grant agreement no. 283393 (RadioNet3). This research was supported by the Hungarian National Research Development and Innovation Office (OTKA NN110333) and the China–Hungary Collaboration and Exchange Programme by the International Cooperation Bureau of the Chinese Academy of Sciences. T. A. acknowledges the grant of the Youth Innovation Promotion Association of CAS.
References
- Abdo et al. (2009a) Abdo A. A., et al., 2009a, ApJ, 699, 976
- Abdo et al. (2009b) Abdo A. A., et al., 2009b, ApJ, 707, L142
- Acero et al. (2015) Acero F., et al., 2015, ApJS, 218, 23
- Angelakis et al. (2015) Angelakis E., et al., 2015, A&A, 575, A55
- Antón et al. (2008) Antón S., Browne I. W. A., Marchã M. J., 2008, A&A, 490, 583
- Beasley & Conway (1995) Beasley A. J., Conway J. E., 1995, in Zensus J. A., Diamond P. J., Napier P. J., eds, ASP Conf. Ser. Vol. 82, Very Long Baseline Interferometry and the VLBA. p. 327
- Becker et al. (1995) Becker R. H., White R. L., Helfand D. J., 1995, ApJ, 450, 559
- Berton et al. (2015) Berton M., et al., 2015, A&A, 578, A28
- Caccianiga et al. (2015) Caccianiga A., et al., 2015, MNRAS, 451, 1795
- Cavagnolo et al. (2010) Cavagnolo K. W., McNamara B. R., Nulsen P. E. J., Carilli C. L., Jones C., Bîrzan L., 2010, ApJ, 720, 1066
- Collin & Kawaguchi (2004) Collin S., Kawaguchi T., 2004, A&A, 426, 797
- Condon et al. (1998) Condon J. J., Cotton W. D., Greisen E. W., Yin Q. F., Perley R. A., Taylor G. B., Broderick J. J., 1998, AJ, 115, 1693
- Congiu et al. (2017) Congiu E., et al., 2017, A&A, 603, A32
- Cracco et al. (2016) Cracco V., Ciroi S., Berton M., Di Mille F., Foschini L., La Mura G., Rafanelli P., 2016, MNRAS, 462, 1256
- Crenshaw et al. (2003) Crenshaw D. M., Kraemer S. B., Gabel J. R., 2003, AJ, 126, 1690
- Diamond (1995) Diamond P. J., 1995, in Zensus J. A., Diamond P. J., Napier P. J., eds, ASP Conf. Ser. Vol. 82, Very Long Baseline Interferometry and the VLBA. Astron. Soc. Pac., San Francisco, p. 227
- Doi et al. (2012) Doi A., Nagira H., Kawakatu N., Kino M., Nagai H., Asada K., 2012, ApJ, 760, 41
- Fanaroff & Riley (1974) Fanaroff B. L., Riley J. M., 1974, MNRAS, 167, 31P
- Foschini (2011) Foschini L., 2011, in Foschini L., Colpi M., Gallo L., Grupe D., Komossa S., Leighly K., Mathur S., eds, Narrow-Line Seyfert 1 Galaxies and their Place in the Universe. Proceedings of Science (PoS, Trieste, Italy), p. 24
- Foschini et al. (2015) Foschini L., et al., 2015, A&A, 575, A13
- Fuhrmann et al. (2016) Fuhrmann L., et al., 2016, Research in Astronomy and Astrophysics, 16, 176
- Gliozzi et al. (2010) Gliozzi M., Papadakis I. E., Grupe D., Brinkmann W. P., Raeth C., Kedziora-Chudczer L., 2010, ApJ, 717, 1243
- Gregory et al. (1996) Gregory P. C., Scott W. K., Douglas K., Condon J. J., 1996, ApJS, 103, 427
- Greisen (2003) Greisen E. W., 2003, Information Handling in Astronomy - Historical Vistas, 285, 109
- Gu et al. (2015) Gu M., Chen Y., Komossa S., Yuan W., Shen Z., Wajima K., Zhou H., Zensus J. A., 2015, ApJS, 221, 3
- Helfand et al. (2015) Helfand D. J., White R. L., Becker R. H., 2015, ApJ, 801, 26
- Högbom (1979) Högbom J. A., 1979, A&AS, 36, 173
- Homan et al. (2006) Homan D. C., et al., 2006, ApJ, 642, L115
- Intema et al. (2017) Intema H. T., Jagannathan P., Mooley K. P., Frail D. A., 2017, A&A, 598, A78
- Järvelä et al. (2015) Järvelä E., Lähteenmäki A., León-Tavares J., 2015, A&A, 573, A76
- Karamanavis (2015) Karamanavis V., 2015, PhD thesis, Max-Planck-Institut für Radioastronomie, doi:10.5281/zenodo.48650
- Keimpema et al. (2015) Keimpema A., et al., 2015, Experimental Astronomy, 39, 259
- Kellermann et al. (1989) Kellermann K. I., Sramek R., Schmidt M., Shaffer D. B., Green R., 1989, AJ, 98, 1195
- Kharb et al. (2010) Kharb P., Lister M. L., Cooper N. J., 2010, ApJ, 710, 764
- Komossa et al. (2006) Komossa S., Voges W., Xu D., Mathur S., Adorf H.-M., Lemson G., Duschl W. J., Grupe D., 2006, AJ, 132, 531
- Kovalev et al. (2005) Kovalev Y. Y., et al., 2005, AJ, 130, 2473
- Labiano (2008) Labiano A., 2008, A&A, 488, L59
- Lister et al. (2009) Lister M. L., et al., 2009, AJ, 138, 1874
- Lister et al. (2016) Lister M. L., et al., 2016, AJ, 152, 12
- Mathur (2000) Mathur S., 2000, MNRAS, 314, L17
- Morokuma et al. (2014) Morokuma T., et al., 2014, PASJ, 66, 114
- Morokuma et al. (2017) Morokuma T., et al., 2017, preprint, (arXiv:1707.05416)
- Myers et al. (2003) Myers S. T., et al., 2003, MNRAS, 341, 1
- Natarajan et al. (2017) Natarajan I., Paragi Z., Zwart J., Perkins S., Smirnov O., van der Heyden K., 2017, MNRAS, 464, 4306
- Osterbrock & Pogge (1985) Osterbrock D. E., Pogge R. W., 1985, ApJ, 297, 166
- Pogge (2000) Pogge R. W., 2000, New Astron. Rev., 44, 381
- Readhead (1994) Readhead A. C. S., 1994, ApJ, 426, 51
- Rengelink et al. (1997) Rengelink R. B., Tang Y., de Bruyn A. G., Miley G. K., Bremer M. N., Roettgering H. J. A., Bremer M. A. R., 1997, A&AS, 124
- Richards & Lister (2015) Richards J. L., Lister M. L., 2015, ApJ, 800, L8
- Shen & Ho (2014) Shen Y., Ho L. C., 2014, Nature, 513, 210
- Shepherd et al. (1994) Shepherd M. C., Pearson T. J., Taylor G. B., 1994, BAAS, 26, 987
- Szomoru (2008) Szomoru A., 2008, in Proceedings of the 9th European VLBI Network Symposium on The role of VLBI in the Golden Age for Radio Astronomy and EVN Users Meeting. Proceedings of Science (PoS, Trieste, Italy), p. 40
- Tanaka et al. (2014) Tanaka M., et al., 2014, ApJ, 793, L26
- Whalen et al. (2006) Whalen D. J., Laurent-Muehleisen S. A., Moran E. C., Becker R. H., 2006, AJ, 131, 1948
- Wright (2006) Wright E. L., 2006, PASP, 118, 1711
- Wrobel (1995) Wrobel J. M., 1995, in Zensus J. A., Diamond P. J., Napier P. J., eds, ASP Conf. Ser. Vol. 82, Very Long Baseline Interferometry and the VLBA. p. 411
- Yao et al. (2015) Yao S., Yuan W., Zhou H., Komossa S., Zhang J., Qiao E., Liu B., 2015, MNRAS, 454, L16
- Yuan et al. (2008) Yuan W., Zhou H. Y., Komossa S., Dong X. B., Wang T. G., Lu H. L., Bai J. M., 2008, ApJ, 685, 801
- Zhou et al. (2006) Zhou H., Wang T., Yuan W., Lu H., Dong X., Wang J., Lu Y., 2006, ApJS, 166, 128
- Zhou et al. (2007) Zhou H., et al., 2007, ApJ, 658, L13