Negative Differential Mobility and Trapping in Active Matter Systems
Abstract
Using simulations, we examine the average velocity as a function of applied drift force for active matter particles moving through a random obstacle array. We find that for low drift force, there is an initial flow regime where the mobility increases linearly with drive, while for higher drift forces a regime of negative differential mobility appears in which the velocity decreases with increasing drive due to the trapping of active particles behind obstacles. A fully clogged regime exists at very high drift forces when all the particles are permanently trapped behind obstacles. We find for increasing activity that the overall mobility is nonmonotonic, with an enhancement of the mobility for small levels of activity and a decrease in mobility for large activity levels. We show how these effects evolve as a function of disk and obstacle density, active run length, drift force, and motor force.
1 Introduction
There has been increasing interest in self-driven or active matter systems, which are often modeled as a collection of self-mobile disks with mobility represented by driven diffusion or run-and-tumble dynamics [1, 2]. When disk-disk interactions are included, an activity-induced clustering or phase separation into a dense solid phase coexisting with a low density active gas phase can occur for sufficiently high activity and disk density. Such clustering effects occur for both driven diffusive [3, 4, 5, 6, 7, 8] and run-and-tumble systems [3, 7, 8, 9]. Studies of active matter systems generally focus on samples with featureless substrates, but recent work has addressed the behavior of active matter interacting with more complex environments [2], such as random [10, 11, 12] or periodic obstacle arrays [13, 14, 15], pinning arrays or rough landscape substrates [15, 16, 17], or funnel arrays [18], as well as mixtures of active and passive particles [19]. In run-and-tumble disk systems, studies of the average flux through an obstacle array in the presence of an additional external drift force [10] show that for low activity or short run times, the active disks have Brownian characteristics and are easily trapped; however, for increasing run persistence length or activity, the trapping is reduced and the flux of disks through the system increases. Interestingly, when the run time or activity is large, the disk drift mobility is strongly reduced due to enhanced self-trapping of disks behind the obstacles and by each other. Other studies of active particles moving through an array of obstacles show that for increasing propulsion speed, the particles remain trapped behind obstacles for a longer time, and as a result the long time diffusion constant is decreased for high activity particles compared to passive or Brownian particles [12]. If the obstacles are replaced by a rough substrate, another study showed that the drift mobility of the particles increases with increasing run length since the self-clustering effect allows the particles to act like an effective larger-scale rigid object that couples only weakly to the substrate [17]. Studies of flocking active particles moving through obstacle arrays reveal nonmonotonic behavior as a function of disorder strength [20] and a disorder-induced flocking to non-flocking transition [11, 21].
Here we examine run-and-tumble active matter disks in the presence of a random array of obstacles where we apply an external driving force in order to measure the long time average disk drift velocity in the direction of drive. While in previous work we considered a constant applied drift force [10], here we examine the effects of varied drift forces and compare the resulting velocity-force curves to those found in other systems that exhibit depinning, such as passive particles driven over random disorder [22]. Previous studies of passive or Brownian particles driven though an obstacle array showed that there can be a regime of negative differential mobility where the velocity decreases with increasing drive, and the velocity can even drop to zero in the limit of large drive [23, 24, 25]. Negative differential mobility also appears when the obstacles themselves are allowed to move [26, 27, 28]. Such effects can arise for driven particles in laminar flows [29], particles driven through glass formers [30], vortices in type-II superconductors moving through periodic pinning arrays[22, 31, 32], colloids moving on ordered pinning arrays [33], and in nonequilibrium states of certain types of semiconductors [34].
We specifically examine run-and-tumble driven disks, where a motor force acts on disk during a fixed running time in a randomly chosen direction . At the end of the running time, a new run begins with the motor force acting in a new randomly chosen direction. The disks move through a random array of obstacles under an external drive , and we measure the average disk drift velocity in the driving direction as a function of increasing . At low drives , the drift velocity increases linearly with increasing , but we find that reaches a maximum and then decreases with increasing due to the partial trapping of disks behind obstacles. For large enough drives we observe a fully clogged state with . The value of increases with increasing activity and saturates for long run times, while the maximum value of changes nonmonotonically as a function of run time. In some cases, a system with longer run times has lower mobility for small but higher mobility at large compared to a system with shorter run times. For fixed run time and increasing motor force , we find that the transition from a linear dependence of on to a decrease in with increasing follows the line . When we increase the disk density, we observe crowding effects that reduce the overall mobility but can also increase the range of parameters for which negative differential mobility occurs.
2 Simulation
We consider a two-dimensional system of size with periodic boundary conditions in the and directions, where . Within the system we place active disks of radius and obstacles which are modeled as stationary disks of the same size as the active disks. The area coverage of the obstacles is , the area coverage of the active disks is , and the total area coverage is . The disk-disk interactions are modeled as a short range harmonic repulsion where is the distance between the disks, is the displacement vector between the disks, is the spring constant, and is the Heaviside step function. The dynamics of an active disk are governed by the following overdamped equation of motion: where the damping constant . Here is the interaction between active disks and is the interaction between active disk and the obstacles. Each mobile disk has a motor force applied in a randomly chosen direction which changes after each run time . In the absence of any collisions, during a running time the motor force translates the disk a distance , where is the simulation time step. The mobile disks experience an additional external driving force in the direction, . After changing , we wait for at least simulation time steps to ensure that we have reached a steady state flux before measuring the average drift velocity in the direction of drive, . We quantify the activity level of the disks in terms of and .
3 Results
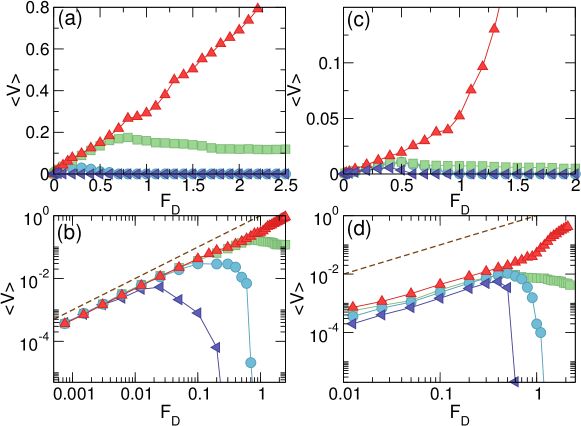
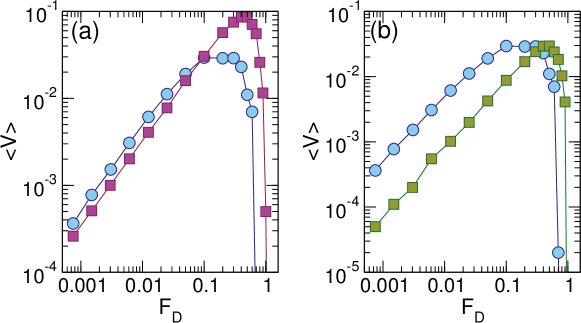
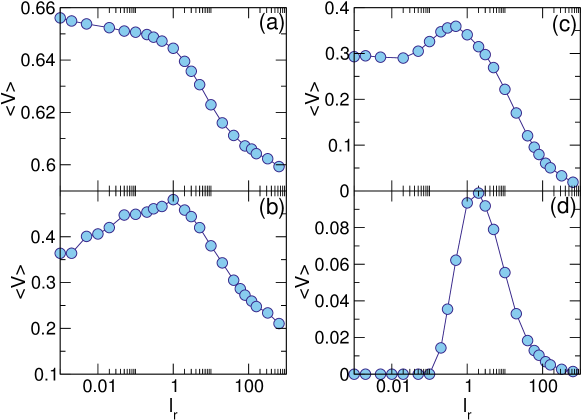
In Fig. 1(a) we plot versus for a system with , , and at , 0.03146, 0.0628, and , and in Fig. 1(b) we show the same data on a log-log scale. At the low density of , the sample behavior falls in the single active disk limit and increases linearly with before reaching a maximum near and then decreasing to for . For , reaches a maximum near and drops to zero for . In both cases the system exhibits what is called negative differential mobility (NDM), where the average velocity decreases with increasing , and at high enough drives the sample reaches a pinned or clogged state. For there is still a region of NDM for ; however, the velocity remains finite up to the maximum drive that we consider. For , when the number of disks equals the number of obstacles, the velocity monotonically increases with and the NDM is lost. In Fig. 1(b) the dashed line indicates the linear behavior of an obstacle-free system. For all values of , we find the same linear increase of with for small , and the value of at which NDM appears shifts to higher values of as increases.
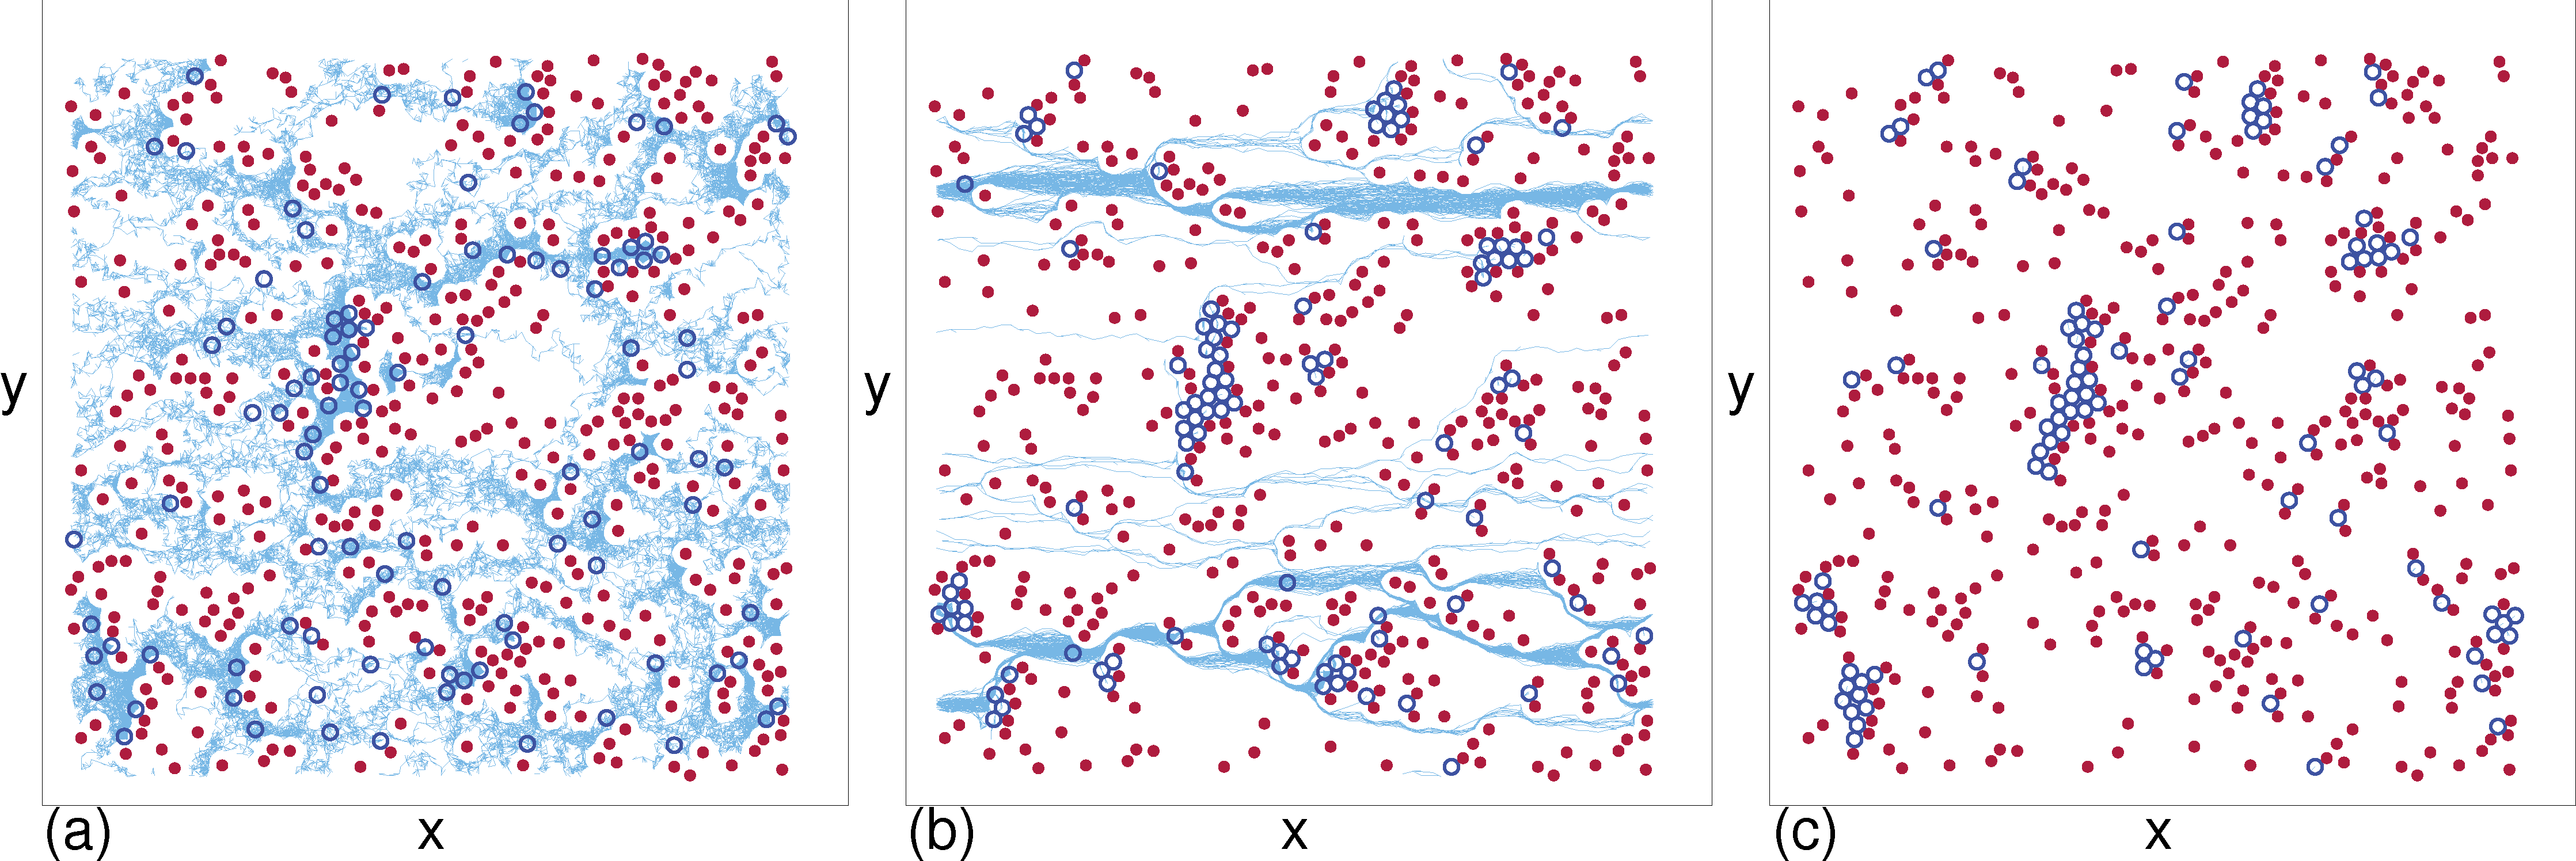
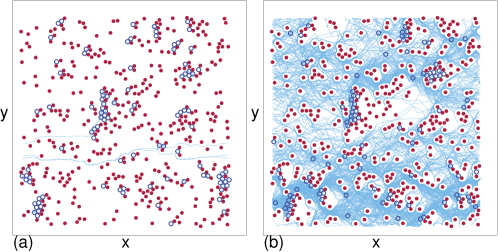
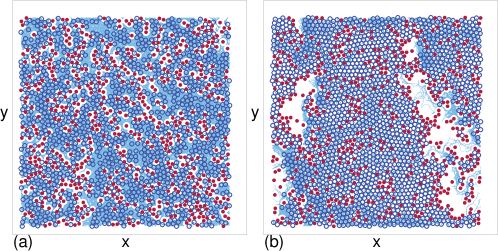
In Fig. 2 we show the trajectories of the active disks at three different values of for the system from Fig. 1(a,b). At in Fig. 2(a), is increasing with increasing . The disk trajectories are space filling, and is small enough that when a disk becomes trapped behind an obstacle, the motor force is large enough to move the disk in the direction opposite to the drive, permitting the disk to work its way around the obstacle. As a result, the active disks can easily explore nearly all the possible paths through the obstacle array. As increases, the ability of the disks to back away from an obstacle is reduced, and the amount of time disks spend trapped behind obstacles increases, as illustrated in Fig. 2(b) at , corresponding to , where the system exhibits NDM. Here there are several locations in which the disks become trapped for long periods of time. As is further increased, more disks become trapped and diminishes, as shown in Fig. 2(c) for , where all the active disks are permanently trapped and . Two effects reduce the trapping susceptibility as increases. Once a portion of the disks becomes trapped behind the most confining obstacle configurations, additional active disks can no longer be trapped at these same locations, meaning that the “deepest” traps are effectively inactivated. In addition, at locations where multiple active disks are trapped one behind another, there is a finite probability that the motor forces of these disks will simultaneously be oriented in the direction opposite to that of the drift force, permitting the disks to escape, so that complete trapping will occur only when .
In Fig. 1(c,d) we plot versus for the same system in Fig. 1(a,b) but with a much larger run length of . We observe the same general features as in the case; however, the value of at which reaches zero is shifted upward and the magnitude of for a given is significantly reduced, as indicated by comparing the curves in Fig. 1(d) to the dashed line which is the flow expected in an obstacle-free system.
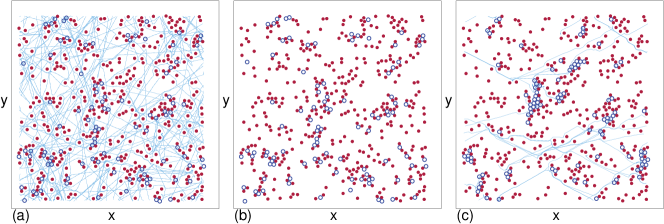
Figure 3(a) shows the active disk trajectories for the system in Fig. 1(c,d) with and at . In this regime, is increasing with increasing ; however, is smaller by nearly a factor of 20 than in the case illustrated in Fig. 2(a). The active disks in Fig. 3(a) are not strongly affected by the external drive and move in straight lines while running; however, upon encountering an obstacle the active disk pushes against it and becomes self-trapped, reducing the mobility of the system. To more clearly demonstrate the self-trapping effect that occurs for large run lengths, in Fig. 3(b) we plot the same snapshot of the active disk and obstacle positions without trajectories, and find that nearly all of the active disks are in contact with an obstacle. At , as illustrated in Fig. 3(c), is finite in the system, whereas for . Here, although a considerable amount of disk trapping occurs, the longer run times allow some of the disks to become mobile, giving a nonzero contribution to .
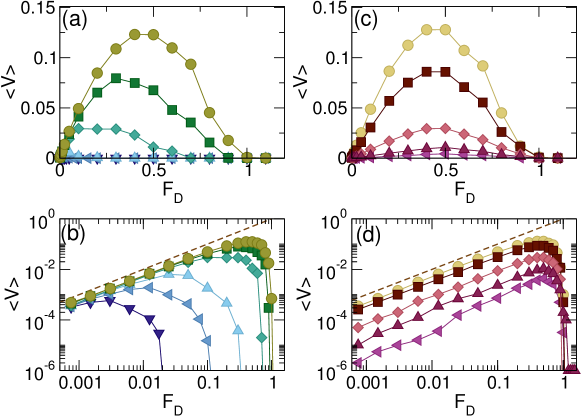
To get a better understanding of how affects the shape of the velocity-force curves, in Fig. 4(a) we plot versus for a sample with , , and at values ranging from to . The same curves are shown on a log-log scale in Fig. 4(b), where the dashed line indicates the obstacle-free limit . We note that for non-active disks with , for all drive values at this disk density. Three trends emerge from the data. There is an overall increase in with increasing for all values of . Additionally, both the maximum value of and the drive at which reaches zero shift to higher values of with increasing . Figure 4(c) shows versus in the same sample for values ranging from to , and in Fig. 4(d) we plot the same curves on a log-log scale. Here there is an overall decrease in with increasing for all values of . The drive at which reaches zero has its largest value of for and decreases with increasing for . In the limit , for all since fluctuations in the disk motion are eliminated, so the system cannot escape from a clogged state. This is similar to what occurs in the nonactive disk system.
In Fig. 5(a) we illustrate the active disk trajectories for the system in Fig. 4 at for , where most of the disks are trapped. At later times, all the disks become trapped and . In Fig. 5(b) we show the same system at and , where passes through its maximum value in Fig. 4(c,d). Here the disks can move easily through the system and the amount of trapping is significantly reduced. At higher values of more trapping occurs, and for large enough , .
The value of that maximizes the flux through the system depends strongly on . In Fig. 6(a) we plot versus for the system in Fig. 4 at and . For , is larger in the system than in the system, while for , the situation is reversed and is largest in the system. A comparison of versus for and appears in Fig. 6(b), where is larger in the system for and larger in the system for , while the maximum value of is nearly the same for both values of . This result has implications for active particle separation or mixing, and indicates that a less active particle species would move faster under a drift force at smaller than a more active particle species. At larger the reverse would occur, with the less active species becoming immobile while the more active particles are still able to flow through the system. The curves in Fig. 6 also indicate that is possible to tune such that active particle species with very different activity levels drift with equal values of , such as by setting for the and disks in Fig. 6(b). It is possible that certain living systems such as bacteria subjected to an external drift may actually lower their activity in order to move through a heterogeneous environment if the external flow is weak, while if there is a strong drift flow, an increase in the activity level would improve the mobility.
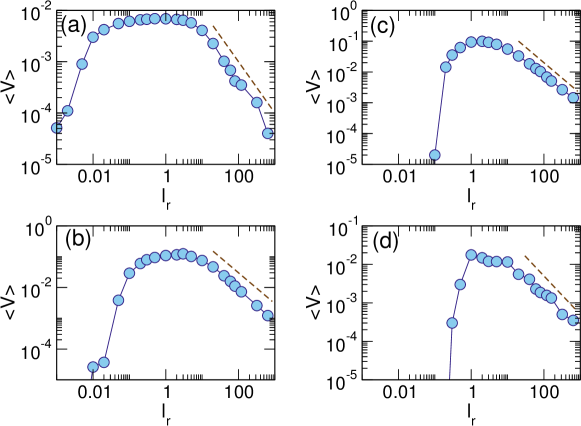
In Fig. 7 we plot versus for the system in Fig. 1 with , , and for different values of . For in Fig. 7(a), initially increases with increasing before reaching a maximum value at , after which it drops by several orders of magnitude as . At in Fig. 7(b), in Fig. 7(c), and in Fig. 7(d), at small values of , and as increases passes through a maximum value before decreasing again. In the larger regime where is a decreasing function of , the drift velocity approximately follows the form , as indicated by the dashed line fits in each panel.
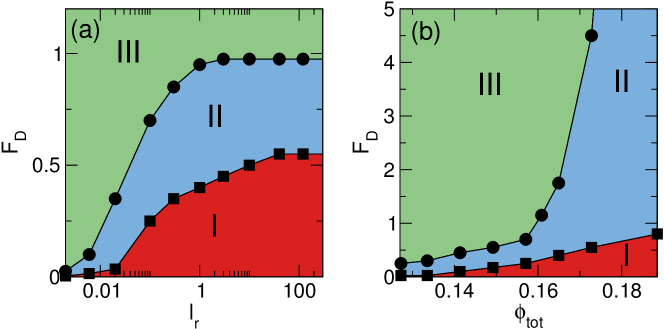
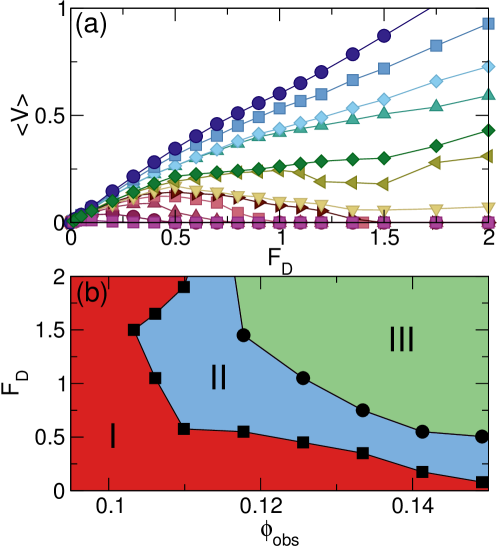
In Fig. 8(a) we show the evolution of the three different phases as a function of versus for a system with , , and . In phase I, the ohmic flow regime, increases with increasing . In phase II, partial trapping occurs and we observe NDM. Phase III is the completely clogged regime with . The extent of phase I grows as increases until the I-II boundary saturates at large to the value , corresponding to . Similar behavior appears for phase II, with a saturation of the II-III boundary for to . The onset of phase III drops to when , indicating that for this density, nonactive disks are permanently clogged. In Fig. 8(b) we plot a dynamic phase diagram as a function of versus , where we vary by fixing and changing . Phase III disappears for , and the extent of phase I increases as the ratio of active disks to obstacles increases.
3.1 Varied Obstacle Density and Motor Force
We next consider the effect of holding fixed at while decreasing . In Fig. 9(a) we plot versus for a sample with . Here decreases monotonically with increasing and the flow persists even when . At in Fig. 9(b) and at in Fig. 9(c), there is still finite flow for , and a peak in emerges near . At in Fig. 9(d), when , and the optimum flow, indicated by the highest value of , has shifted to a higher run length of .
In Fig. 10(a) we plot versus for a system with , , fixed , and varied obstacle density ranging from to . The upper value of at which drops to zero decreases with increasing for , while for we observe a window of NDM where decreases with increasing separating low and high regions in which increases with increasing . For , monotonically increases with increasing , and although the NDM has disappeared, there is still a decrease in the slope of for because an increased amount of trapping occurs once . Due to the harmonic form of the disk-disk interaction potential, if is increased to a large enough value the disks eventually are able to depin and move even in the completely clogged state; however, this occurs well above the range of that we consider here. In Fig. 10(b), the dynamic phase diagram as a function of versus for the system in Fig. 10(a) shows that the ohmic flow phase I is reentrant.
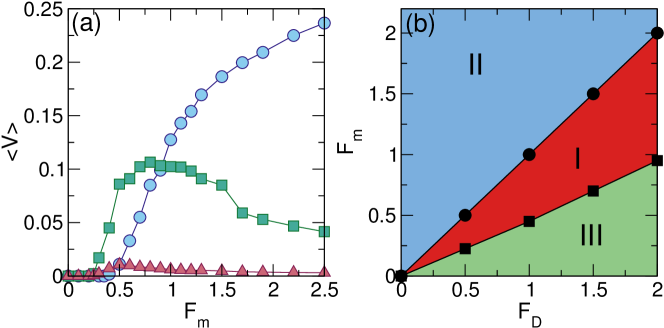
Up to now we have characterized the activity by the run length and have focused on the case . It is, however, possible to obtain different behaviors at fixed by varying and . If , the value of should always be finite. In Fig. 11(a) we plot versus in systems with fixed , , and for three values of . In order to compare these plots to our previous results, note that for , gives , is equivalent to , and corresponds to . For , when , and for , increases monotonically with . At , for and passes through a maximum near . For , the maximum in falls at , and the overall magnitude of is much smaller than that observed at the smaller values. In Fig. 11(b) we plot a dynamic phase diagram as a function of versus for the system. The I-III transition line separating the clogged phase III and the ohmic flow phase I falls at , while the NDM in phase II appears when .
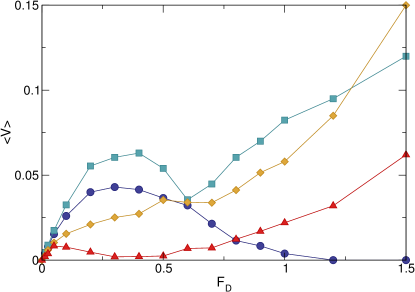
In previous work examining the mobility as a function of for fixed and fixed , increased with increasing up to a maximum value and then decreased for higher as the disks approached the jamming density due to a crowding effect in which the active disks become so dense that they impede each other’s motion [10]. In Fig. 12 we plot versus for a system with , , and at , , , and . For , drops to zero for , while for , there is a region of NDM for but the velocities remain finite and the overall magnitude of is larger than that of the system. For , the average is smaller than that at due to the crowding effect, and there is only a very small window of NDM near . For , the increased crowding effect causes a substantial decrease in the overall magnitude of , and at the same time an extended region of NDM appears for .
In Fig. 13(a) we plot the active disk trajectories for the system in Fig. 12 at and , a regime in which increases with increasing . There is a considerable amount of disk motion throughout the system. In contrast, Fig. 12(b) illustrates an NDM regime at and , where a large jammed or clogged area has formed in the center of the sample, indicating the role played by crowding in inhibiting the mobility of the active disks.
4 Summary
We have numerically examined the velocity-force curves for active matter disks driven through a random obstacle array and find three distinct dynamical phases. In the low drive regime, the velocity increases linearly with increasing external drive. For intermediate drives, the system exhibits negative differential mobility where the velocity decreases with increasing drive due to the trapping of disks behind obstacles. Finally, at high drive we find a fully clogged state in which the drift velocity drops to zero. For increasing activity or run length, we find that the onsets of the NDM phase and the fully clogged phase are shifted to larger external drift forces. Additionally, the drift velocity at fixed drive changes nonmonotonically with increasing activity, indicating that there is a drive-dependent optimal activity or run length that maximizes the flux of disks through the system. We map the locations of the dynamic phases as a function of activity, active disk density, obstacle density, and motor force. We describe how an external drift force could be tuned to either separate or mix active disk species with different mobilities. We have also examined the role of active disk density, and find that at low disk densities, the NDM and clogging effects disappear with increasing disk density when the trapping is reduced; however, for much larger densities where crowding effects become important, the NDM reappears and is enhanced.
References
References
- [1] Marchetti M C, Joanny J F, Ramaswamy S, Liverpool T B, Prost J, Rao M and Simha R A 2013 Hydrodynamics of soft active matter Rev. Mod. Phys. 85 1143
- [2] Bechinger C, Di Leonardo R, Löwen H, Reichhardt C, Volpe G and Volpe G 2016 Active Brownian particles in complex and crowded environments Rev. Mod. Phys. 88 045006
- [3] Reichhardt C and Reichhardt C J O 2015 Active microrheology in active matter systems: Mobility, intermittency, and avalanches Phys. Rev. E 91 032313
- [4] Fily Y and Marchetti M C 2012 Athermal phase separation of self-propelled particles with no alignment Phys. Rev. Lett. 108 235702
- [5] Redner G S, Hagan M F and Baskaran A 2013 Structure and dynamics of a phase-separating active colloidal fluid Phys. Rev. Lett. 110 055701
- [6] Palacci J, Sacanna S, Steinberg A P, Pine D J and Chaikin P M 2013 Living crystals of light-activated colloidal surfers Science 339 936
- [7] Cates M E and Tailleur J 2013 When are active Brownian particles and run-and-tumble particles equivalent? Consequences for motility-induced phase separation Europhys. Lett. 101 20010
- [8] Cates M E and Tailleur J 2015 Motility-induced phase separation Annu. Rev. Condens. Mat. Phys. 6 219
- [9] Thompson A G, Tailleur J, Cates M E and Blythe R A 2011 Lattice models of nonequilibrium bacterial dynamics J. Stat. Mech. 2011 P02029
- [10] Reichhardt C and Reichhardt C J O 2014 Active matter transport and jamming on disordered landscapes Phys. Rev. E 90 012701
- [11] Morin A, Desreumaux N, Caussin J-B and Bartolo D 2017 Distortion and destruction of colloidal flocks in disordered environments Nature Phys. 13 63
- [12] Zeitz M, Wolff K and Stark H 2017 Active Brownian particles moving in a random Lorentz gas Eur. Phys. J. E 40 23
- [13] Lozano C, ten Hagen B, Löwen H and Bechinger C 2016 Phototaxis of synthetic microswimmers in optical landscapes Nature Commun. 7 12828
- [14] Sándor Cs, Libál A, Reichhardt C and Reichhardt C J O 2017 Collective transport for active matter run-and-tumble disk systems on a traveling-wave substrate Phys. Rev. E 95 012607
- [15] Choudhury U, Straube A V, Fischer P, Gibbs J G and Höfling F 2017 Active colloidal propulsion over a crystalline surface Preprint arXiv:1707.05891
- [16] Pince E, Velu S K P, Callegari A, Elahi P, Gigan S, Volpe G and Volpe G 2016 Disorder-mediated crowd control in an active matter system Nature Commun. 7 10907
- [17] Sándor Cs, Libál A, Reichhardt C and Reichhardt C J O 2017 Dynamic phases of active matter systems with quenched disorder Phys. Rev. E 95 032606
- [18] Reichhardt C J O and Reichhardt C 2017 Ratchet effects in active matter systems Annu. Rev. Condens. Mat. Phys. 8, 51
- [19] Kümmel F, Shabestari P, Lozano C, Volpe G and Bechinger C 2015 Formation, compression and surface melting of colloidal clusters by active particles Soft Matter 11 6187
- [20] Chepizhko O, Altmann E G and Peruani F 2013 Optimal noise maximizes collective motion in heterogeneous media Phys. Rev. Lett. 110 238101
- [21] Quint D and Gopinathan A 2015 Topologically induced swarming phase transition on a 2D percolated lattice Phys. Biol. 12 046008
- [22] Reichhardt C and Reichhardt C J O 2017 Depinning and nonequilibrium dynamic phases of particle assemblies driven over random and ordered substrates: A review Rep. Prog. Phys. 80 026501
- [23] Barma M and Dhar D 1983 Directed diffusion in a percolation network J. Phys. C 16 1451
- [24] Leitmann S and Franosch T 2013 Nonlinear response in the driven lattice Lorentz gas Phys. Rev. Lett. 111 190603
- [25] Baerts P, Basu U, Maes C and Safaverdi S 2013 Frenetic origin of negative differential response Phys. Rev. E 88 052109
- [26] Bénichou O, Illien P, Oshanin G, Sarracino A and Voituriez R 2014 Microscopic theory for negative differential mobility in crowded environments Phys. Rev. Lett. 113 268002
- [27] Baiesi M, Stella A L and Vanderzande C 2015 Role of trapping and crowding as sources of negative differential mobility Phys. Rev. E 92 042121
- [28] Bénichou O, Illien P, Oshanin G, Sarracino A and Voituriez R 2016 Nonlinear response and emerging nonequilibrium microstructures for biased diffusion in confined crowded environments Phys. Rev. E 93 032128
- [29] Sarracino A, Cecconi F, Puglisi A and Vulpiani A 2016 Nonlinear response of inertial tracers in steady laminar flows: differential and absolute negative mobility Phys. Rev. Lett. 117 174501
- [30] Jack R L, Kelsey D, Garrahan J P and Chandler D 2008 Negative differential mobility of weakly driven particles in models of glass formers Phys. Rev. E 78 011506
- [31] Reichhardt C, Olson C J and Nori F 1998 Nonequilibrium dynamic phases and plastic flow of driven vortex lattices in superconductors with periodic arrays of pinning sites Phys. Rev. B 58 6534
- [32] Gutierrez J, Silhanek A, Van de Vondel J, Gillijns W and Moshchalkov V 2009 Transition from turbulent to nearly laminar vortex flow in superconductors with periodic pinning Phys. Rev. B 80 140514
- [33] Eichhorn R, Regtmeier J, Anselmetti D and Reimann P 2010 Negative mobility and sorting of colloidal particles Soft Matter 6 1858
- [34] Scholl E 1987 Nonequilibrium Phase Transitions in Semiconductors (Berlin:Springer-Verlag)