22email: knakajim@eso.org 33institutetext: CNRS, IRAP, 14 Avenue E. Belin, 31400 Toulouse, France 44institutetext: Aix Marseille Université, CNRS, LAM (Laboratoire d’Astrophysique de Marseille) UMR 7326, 13388 Marseille, France 55institutetext: INAF– Osservatorio Astronomico di Roma, via di Frascati 33, I-00078, Monte Porzio Catone, Italy 66institutetext: Cavendish Laboratory, University of Cambridge, 19 JJ Thomson Avenue, Cambridge, CB3 0HE, UK 77institutetext: Kavli Institute for Cosmology, University of Cambridge, Madingley Road, Cambridge CB3 0HA, UK 88institutetext: Dipartimento di Fisica e Astronomia, Università di Bologna, Via Gobetti 93/2, I-40129, Bologna, Italy 99institutetext: INAF– Osservatorio Astronomico di Bologna, Via Gobetti 93/3, I-40129, Bologna, Italy 1010institutetext: Department of Physics, University of California, Davis, One Shields Ave., Davis, CA 95616, USA 1111institutetext: Núcleo de Astronomía, Facultad de Ingeniería, Universidad Diego Portales, Av. Ejército 441, Santiago, Chile 1212institutetext: Space Telescope Science Institute, 3700 San Martin Drive, Baltimore, MD 21218, USA
The VIMOS Ultra Deep Survey: Nature, ISM properties, and ionizing spectra of Ciii] emitters at ††thanks: Based on data obtained with the European Southern Observatory Very Large Telescope, Paranal, Chile, under Large Program 185.A-0791.
Abstract
Context. Ultraviolet (UV) emission-line spectra are used to spectroscopically confirm high- galaxies and increasingly also to determine their physical properties.
Aims. We construct photoionization models to interpret the observed UV spectra of distant galaxies in terms of the dominant radiation field and the physical condition of the interstellar medium (ISM). These models are applied to new spectroscopic observations from the VIMOS Ultra Deep Survey (VUDS).
Methods. We construct a large grid of photoionization models, which use several incident radiation fields (stellar populations, active galactic nuclei (AGNs), mix of stars and AGNs, blackbodies, and others), and cover a wide range of metallicities and ionization parameters. From these models we derive new spectral UV line diagnostics using equivalent widths (EWs) of Ciii] doublet, Civ doublet and the line ratios of Ciii], Civ, and He ii recombination lines. We apply these diagnostics to a sample of Ciii]-emitting galaxies at redshifts previously identified in VUDS.
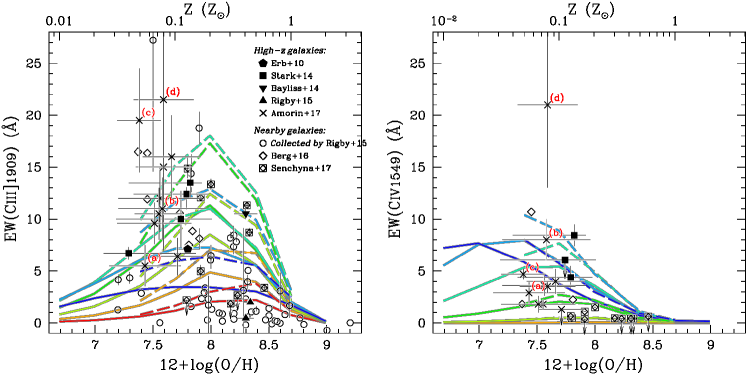
Results. We demonstrate that our photoionization models successfully reproduce observations of nearby and high-redshift sources with known radiation field and/or metallicity. For star-forming galaxies our models predict that Ciii] EW peaks at sub-solar metallicities, whereas Civ EW peaks at even lower metallicity. Using the UV diagnostics, we show that the average star-forming galaxy (EW(Ciii]) Å) based on the composite of the UV-selected galaxies’ spectra is well described by stellar photoionization from single and binary stars. The inferred metallicity and ionization parameter is typically – and to , in agreement with earlier works at similar redshifts. The models also indicate an average age of – Myr since the beginning of the current star-formation, and an ionizing photon production rate, , of erg-1 Hz – . Among the sources with EW(Ciii]) Å, approximately % are likely dominated by AGNs. The metallicity derived for galaxies with EW(CIII) Å is low, , and the ionization parameter higher () than the average star-forming galaxy. To explain the average UV observations of the strongest but rarest Ciii] emitters (EW(Ciii]) Å), we find that stellar photoionization is clearly insufficient. A radiation field consisting of a mix of a young stellar population ( erg-1 Hz ) plus an AGN component is required. Furthermore an enhanced CO abundance ratio (up to the solar value) is needed for metallicities – and to .
Conclusions. A large grid of photoionization models has allowed us to propose new diagnostic diagrams to classify the nature of the ionizing radiation field (star formation or AGN) of distant galaxies using UV emission lines, and to constrain their ISM properties. We have applied this grid to a sample of Ciii]-emitting galaxies at detected in VUDS, finding a range of physical properties and clear evidence for significant AGN contribution in rare sources with very strong Ciii] emission. The UV diagnostics we propose should also serve as an important basis for the interpretation of upcoming observations of high-redshift galaxies.
Key Words.:
galaxies: abundances – galaxies: evolution – galaxies: high-redshift – galaxies: ISM.1 Introduction
Rest-frame ultraviolet (UV) spectra provide a powerful tool, enabling us to examine galaxies at that are redshifted and observable with the ground-based optical spectrographs (e.g., Shapley et al. 2003). Historically, Ly in emission at Å has been used for identifying high- galaxies. This is because i) the Ly line is theoretically the strongest feature from star-forming galaxies that is observable with a ground-based telescope in the rest-frame UV/optical, ii) it shows a unique distinguishable asymmetric line profile, and iii) galaxies that present prominent Ly emission are more abundant at higher- at least up to (e.g., Schaerer 2003; Vanzella et al. 2009; Stark et al. 2011; Cassata et al. 2015). However, since Ly is resonantly scattered by neutral hydrogen, it becomes unlikely to be the best probe of galaxies in the reionization epoch at , when the intergalactic medium (IGM) neutral fraction is significantly larger than zero (e.g., Fan et al. 2006). Indeed, several studies have pointed out a decline of the fraction of Ly emitters with respect to all star-forming galaxies at (e.g., Pentericci et al. 2014; Schenker et al. 2014). A similar drop in the abundance of Ly emitters is also reported in the luminosity function study of Konno et al. (2014). We thus need to explore alternative probes of galaxies in the early universe, in order to characterize as well as spectroscopically confirm them.
An advantage of other UV lines is that they are observable from galaxies at with near-infrared spectrographs currently available at ground-based observatories and the Hubble Space telescope (HST). Indeed, recent deep spectroscopic surveys of identify the following rest-UV emission lines; [Ciii], Ciii] , (hereafter their sum is referred to as Ciii]), Civ (hereafter Civ), He ii, and/or N v (Stark et al., 2015a, b, 2017; Mainali et al., 2017; Schmidt et al., 2017; Laporte et al., 2017). The next question pertains to whether or not we can use these UV emission lines to infer the detailed properties of stars and gas.
In order to gain insight into the UV spectroscopic properties, previous studies have worked on galaxies at intermediate redshifts (; Shapley et al. 2003; Fosbury et al. 2003; Erb et al. 2010; Christensen et al. 2012; Stark et al. 2014; Bayliss et al. 2014; de Barros et al. 2016; Amorín et al. 2017; Stroe et al. 2017) with ground-based instruments, as well as in the nearby universe (Garnett et al., 1995; Berg et al., 2016; Senchyna et al., 2017) using the HST. At these redshifts of , their rest-frame optical spectra are also available, which are well calibrated to determine the Interstellar medium (ISM) properties such as gas-phase metallicity and ionization parameter using empirical methods (e.g., Pagel et al. 1979; Storchi-Bergmann et al. 1994; Pettini & Pagel 2004) and photoionization modelling (e.g., Kewley & Dopita 2002). Stark et al. (2014) have reported Ciii] detection in out of strongly-lensed star-forming dwarfs at . Civ emission was also detected in the three most extreme Ciii] emitters. Using photoionization models of Gutkin et al. (2016), Stark et al. (2014) have inferred with the UV lines only that the four galaxies in their sample with the best UV spectra (including the three Civ emitters) are all characterized by a metal-poor (–), highly ionized () gas with a young age stellar population ( Myr). The gaseous properties are in good agreement with those estimated with the rest-frame optical emission lines. A similar low-metallicity gas with a high ionization parameter has been estimated for galaxies with a prominent Ciii] emission (Erb et al., 2010; Christensen et al., 2012; Berg et al., 2016; Senchyna et al., 2017). These objects all have stellar masses below M⊙. Since young, metal-poor, low-mass galaxies are considered to be more common at higher-, their UV lines, especially the Ciii], are likely to be strong enough to be used for their identification.
A positive correlation between equivalent widths (EWs) of Ly and Ciii] emission as suggested by some observations (e.g., Shapley et al. (2003); Stark et al. (2014)) also supports the idea of using Ciii] as an alternative probe of early galaxies instead of Ly. It remains unclear, however, whether the positive correlation holds universally. For example, Rigby et al. (2015) suggested that the correlation is mostly dominated by the strongest emitters with EW(Ly) Å and EW(Ciii]) Å, and that the correlation becomes less significant for weaker emitters. The correlation needs to be confirmed with larger samples and fully understood from a theoretical point of view.
Other UV lines are also important for understanding the nature of the ionizing spectrum radiated in high- objects. This is because there exist some high ionization lines such as Civ and the He ii recombination line which require the presence of extremely high-energy photons. The He ii recombination line is especially sensitive to the abundance of ionizing photons with energies higher than eV, which can partly be produced by stars, but more abundantly by an active galactic nucleus (AGN). It is thus suggested that the emission line ratios including He ii can be used as a diagnostic to judge whether the ionizing source is powered by stellar population or AGN (Feltre et al., 2016; Gutkin et al., 2016). If only stellar populations are considered, the strength of the UV lines could be sensitive to the hardness and the shape of the ionizing spectrum. Schaerer (2003) demonstrated that the He ii emission strength provides a diagnostic to examine the ionizing spectrum generated by a stellar population that is sensitive to the shape of initial mass function (IMF), metallicity, age, and so on. More recently, Jaskot & Ravindranath (2016) implied that metal-poor galaxies with metallicity below require harder spectral energy distribution (SED) models that include binary stars (Stanway et al., 2015) to reproduce large EWs of Ciii] of – Å. Some other evidence favoring stellar population models which include massive interacting binaries have been pointed out recently (e.g., Steidel et al. 2016). Photoionization modeling with several input radiation fields appears necessary to carefully interpret the observed UV spectra.
More detailed photoionization models are also motivated by new data from larger surveys coming on line. Using the VIMOS Ultra Deep Survey (VUDS; Le Fèvre et al. 2015), Le Fèvre et al. (2017) have established a sample of galaxies at that present a prominent () Ciii] emission, including with rest-frame EW(Ciii]) larger than Å. Since there are other UV emission lines (such as Civ and He ii) detected in many of the VUDS spectra, these Ciii] emitters provide us with a unique opportunity to examine ISM properties and ionizing spectra of a large sample of high-redshift galaxies. By comparing the Ciii] emitters with their parent sample in the same redshift interval in the plot between stellar mass and star-formation rate (SFR), Le Fèvre et al. (2017) interestingly suggest that a significant fraction of galaxies with EW(Ciii]) Å tend to fall below the relation typically found in the parent sample of star-forming galaxies (i.e., below the star-formation main-sequence). This trend is particularly striking for strong Ciii] emitters with EW Å. Le Fèvre et al. (2017) therefore suggest that the presence of an AGN in these stronger Ciii] emitters may be responsible for the star-formation quenching in these galaxies. On the other hand, Amorín et al. (2017) also identify with the early VUDS data ten metal-poor compact star-forming galaxies at showing an intermediately strong Ciii] emission of EW(Ciii]) – Å (median value: Å). This earlier VUDS study already suggests that a variety of objects may show strong Ciii] emission. In this companion study, we investigate the nature of the Ciii] emitters in VUDS using a large grid of photoionization models. Particularly in this paper, we exploit UV diagnostic diagrams using the three UV lines of Ciii], Civ, and He ii. These are the three most prominent UV emission lines after Ly observed in the spectra of star-forming galaxies at (e.g., in VUDS; Le Fèvre et al. 2015), as well as in sources at (Stark et al., 2015a, b, 2017; Mainali et al., 2017; Schmidt et al., 2017). We discuss diagnostics involving the EW of Ciii] and Civ, which complement those presented in the recent studies of Feltre et al. (2016) and Gutkin et al. (2016). The EWs in conjunction with line ratios provide efficient and informative tools to investigate the ISM properties as well as the nature of the ionizing radiation field of distant galaxies.
This paper is organized as follows. We describe our photoionization modeling in Sect. 2, and present the photoionization model predictions of the UV line fluxes and EWs in Sect. 3. In Sect. 4 we develop UV diagrams to diagnose the shape of the incident radiation field and the ISM properties. Using the sample of VUDS Ciii] emitters described in Sect. 5 and Le Fèvre et al. (2017), we derive the physical properties of the Ciii] emitters found by VUDS in Sect. 6. The ten metal-poor VUDS galaxies studied by Amorín et al. (2017) are also re-examined with our UV diagrams. In Sect. 7, we discuss the nature of the Ciii] and Civ emitters found by VUDS and detected at even higher- from the literature, and investigate the practicality of using emission lines in the rest-frame UV for identifying high- sources. Section 8 summarizes and concludes the paper. Throughout this paper, we assume a solar chemical composition following Asplund et al. (2009), where . We adopt a standard CDM cosmology with (, , ) (0.3, 0.7, 70 km s-1 Mpc-1). We use a definition of EW with positive values indicating emission. All EW measurements are given in the rest frame.
| Parameter | PopStar | BPASS | AGN | PopStarAGN | Blackbody | PopIII star |
| SED shape | Fig. 1(a)(‡) | Fig. 1(a)(‡) | Fig. 1(b) | Fig. 1(c)(‡) | Fig. 1(d) | Fig. 1(d) |
| (cm-3) | ||||||
| CO | CH (Dopita et al., 2006)(†), fixed CO ratios up to ( (CO)⊙) | |||||
| Other | Upper-mass | ; | Zero-age, | |||
| param. | of | K | Salpeter IMF, | |||
| – | ||||||
Default value adopted for the input SED model. Ages of current star-formation of Myr and older are considered under the assumption of constant star-formation.
2 Photoionization models
We perform photoionization model calculations with Cloudy (version 13.03; Ferland et al. 1998, 2013) to examine the UV spectroscopic properties of distant galaxies, with particular attention to Ciii] emission. We use a large range of ionizing fields to try and cover the large range of galaxy properties. These models are used to interpret the Ciii] emitters found by VUDS in Sect. 5. We assume constant-density gas clouds with a plane-parallel geometry. We include dust physics and the depletion factors of the various elements from the gaseous phase in the same manner as the analyses of Dopita et al. (2006) and Nagao et al. (2011). Dust grains in the photoionized regions are considered to play an important role in photoelectric heating of the cloud, and to affect the emitted spectrum, especially in the UV and optical wavelength regimes (e.g., van Hoof et al. 2004). Depletion factors used in this paper are given by Cloudy except for nitrogen, for which the value from Dopita et al. (2006) is used instead that is more consistent with the Asplund et al. (2009) abundance set. The choice of the nitrogen depletion factor does not affect the UV diagnostics we propose in this paper. We understand that usages of the adopted depletion factors remain debatable for every model we explore in this paper. In non-solar metallicities, we assume that both the dust model and the depletion factors are unchanged, but the dust abundance is assumed to scale linearly with the gas metallicity, as adopted in Nagao et al. (2011). All elements except nitrogen, carbon, and helium are taken to be primary nucleosynthesis elements. For carbon and nitrogen, we use forms given by Dopita et al. (2006) and López-Sánchez et al. (2012) by default, respectively, to take account of their secondary nucleosynthesis components in a high-metallicity range. For helium, we use a form in Dopita et al. (2006). These prescriptions are empirically derived from observations of nearby extragalactic H ii regions. In this paper, the carbon abundance is particularly important since it directly affects the strength of the Ciii] and Civ emission. We note that the prescription of the carbon abundance we adopt is thought to be valid for galaxies on average (e.g., Erb et al. 2010; Steidel et al. 2016; Amorín et al. 2017), despite their large scatter. We thus additionally consider cases where the carbon abundance does not follow the empirical method (Sect. 3.3), and discuss a possible variation of the carbon abundance later in this paper (Sects. 6.4.3 and 7.2). Briefly, models are constructed by varying ISM properties of metallicity (), ionization parameter (), and electron density () over a wide parameter space, as indicated in Table 1. For our default models we assume a gas density of cm-3, a typical value that is observationally suggested at these redshifts (e.g., Sanders et al. 2016) except for the AGN SED, which adopts a higher default gas density of cm-3 as adopted by Kewley et al. (2013) (see also Dors et al. 2014). Models with a higher gas density are also presented in Sect. 3.1.
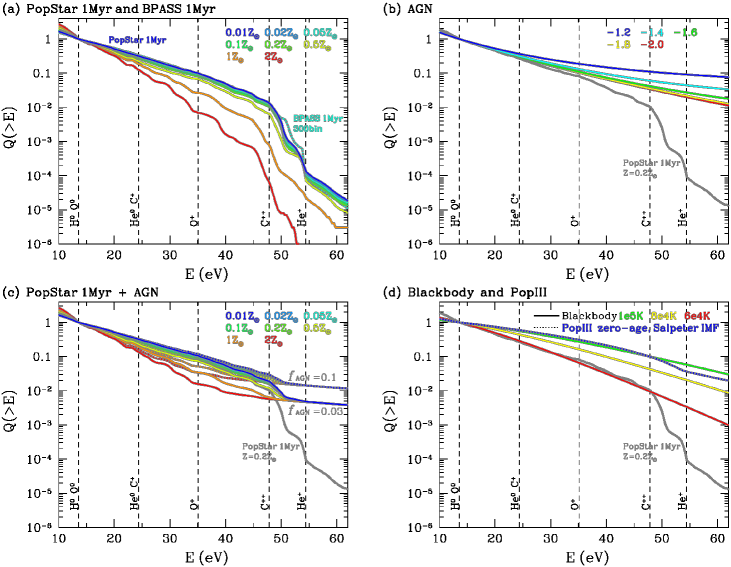
To address the nature and estimate the physical properties of high-redshift galaxies, we have considered a diversity of ionizing radiation fields including those of star-forming galaxies generated by stellar population synthesis codes which include single or binary evolution, AGNs, combinations of stars and AGN, blackbodies, and a PopIII stellar population. The SEDs are illustrated in Fig. 1. Such diverse SEDs are in particular needed to explain and understand the range of observed properties including the strongest Ciii] equivalent widths, which have not been explored in star-forming galaxy populations (e.g., Rigby et al. 2015; Jaskot & Ravindranath 2016). SEDs with different shapes of the ionizing spectrum (i.e., wavelengths Å), sometimes also referred to as the hardness of the SED, directly affect the predicted emission line ratios. For predictions of the equivalent widths (EWs) of emission lines, that is, the ratio of line flux with respect to the continuum, the observable UV continuum (here Å) is also of importance. Therefore it is important to also examine models with different ratios of the ionizing photon flux to UV luminosity, that is, different parameters (e.g., Robertson et al. 2013). We now explain the different SED models. The models presented here do not consider the effects of shocks on the emission lines, which are discussed, for example, by Allen et al. (2008). In general, the effects of shocks on the integrated UV spectra of star-forming galaxies are expected to be secondary, and few predictions exist on this topic. Jaskot & Ravindranath (2016) show how Ciii] emission is increased by shocks with low velocities and strong magnetic fields, leading to spectral signatures comparable to those of AGN.
2.1 Star-forming galaxies
As the reference case for models of star-forming galaxies, we adopt the incident radiation fields from the population synthesis code PopStar (Mollá et al., 2009) for a Chabrier (2003) IMF at an age of Myr, which have been studied in detail and compared to data from the Sloan survey by Stasińska et al. (2015). Such young instantaneous burst models are usually used for modeling H ii-regions (e.g., Kewley & Dopita 2002) since the nebular line ratios are sensitive to the youngest stellar population; age effects are discussed later (Sect. 3.4). Stellar metallicities are matched to the gas-phase ones. The shapes of the ionizing photon spectra with eight different metallicities are shown as solid curves in panel (a) of Figure 1. The model calculations are stopped when the electron fraction, defined as the ratio of the number density of electrons to that of total hydrogen, falls below .
The PopStar models are based on a single stellar population. In order to include a binary evolution in modeling the stellar populations, we additionally consider SEDs provided by BPASS (v2; Stanway et al. 2015) for models of star-forming galaxies. We use publicly available111 http://bpass.auckland.ac.nz/2.html BPASS SEDs adopting similar assumptions as in the PopStar models, assuming an instantaneous starburst at an age of Myr, a Kroupa (2001)-like IMF with the upper-mass cut of M⊙, and a binary stellar population. We call the models “BPASS-300bin” models. The stellar metallicities of – are used for the calculation. For reference the shape of the ionizing spectrum with a metallicity of is shown as a dotted curve in the panel (a) of Figure 1. The BPASS-300bin models provide a slightly harder shape of the ionizing spectrum than the PopStar models. A notable enhancement is found in the high-energy regime of eV. If the models are normalized at a UV wavelength ( Å) instead of at Å, the BPASS models present a larger number of ionizing photons than the PopStar models in Fig. 1(a). This means the BPASS-300bin models show a higher parameter than the single stellar population models for a given metallicity, as expected (cf. Stanway et al. 2015; Trainor et al. 2016). Therefore we expect emission line ratios, which are only sensitive to the shape of the ionizing spectrum, to differ less than line equivalent widths between models using the PopStar and BPASS SEDs.
2.2 Active galactic Nuclei
We consider a narrow-line region (NLR) surrounding an AGN ionizing radiation field, which is frequently characterized by a power law. Our AGN models are generated by the Cloudy “AGN” continuum command with the default parameters except for the power-law energy slope between the optical and X-ray bands, (Zamorani et al., 1981). The parameter corresponds to the power-law index , where , determined in the range of a few to a few thousand eV222 E.g., Elvis et al. (2002) define the index as , where and are the fluxes per unit frequency at Å ( eV) and keV, respectively. The value is calculated as . Elvis et al. (2002) derive a typical value of the index in the range from to . . Hereafter, the notation stands for the index. Models are constructed with the parameters of . The shapes of the ionizing photon spectra with five different are shown in Figure 1(b). We note that the shape of the produced AGN continuum in the UV and longer-wavelength regimes is provided based on observations of quasars (e.g., Elvis et al. 1994; Francis et al. 1993). The continuum is considered to be dominated by emission from the accretion disk, especially in the UV wavelength regime we are interested in (e.g., Elvis et al. 1994). Since we consider type-II AGNs, in which the accretion disk is hidden by torus, the UV continuum might be overestimated by our models due to a possible attenuation. The EWs of the AGN models could thus become larger than calculated here if the attenuation is taken into account (see Sect. 3.5). The AGN models are truncated at a neutral column density of (H i) cm-2, in accordance with the NLR models of Kewley et al. (2013). For the AGN models, we adopt dust-free gas clouds and assume no depletion of elements onto dust grains, since previous studies suggest that dust-free models are in better agreement with the observations of high-redshift radio galaxies, type-II QSOs, and local type-II AGNs than dusty models (e.g., Nagao et al. 2006). For the AGN models, we additionally consider a further metal-rich gas cloud, .
2.3 Star-forming galaxies with an active galactic nucleus
The shape of the highest-energy ionizing photon spectrum at – eV for star-forming galaxies is not yet fully understood. Current stellar population synthesis codes may not properly account for the evolution of very massive stars in the low-metallicity regime and could underestimate the number of high-energy ionizing photons (e.g., Stasińska et al. 2015). We consider models of star-forming galaxies with an additional contribution of an AGN. The SEDs of the stellar population are provided by PopStar models at an age of Myr as described in Sect. 2.1. For the AGN component, we use a power-law spectrum with the index over the range of – Ryd (i.e., eV – keV) as a default. We alternatively use a harder spectrum of to check if the hardness affects the resulting visibility of the emission lines. We adopt two different values of the contribution of the AGN to the total number of ionizing photons, and . The contribution of % is suggested for explaining the He iiH ratios of local blue compact dwarf galaxies with a high ionization parameter (Stasińska et al., 2015), and thus could be needed for their high- analogs of emission-line galaxies. The combined SEDs are presented in panel (c) of Figure 1. The model calculations are performed in exactly the same manner as for the star-forming galaxy models (Sect. 2.1).
2.4 Blackbodies
We also consider models with ionizing spectra described by a simple blackbody. We consider Blackbodies at very high temperature, K, K, and K. The SEDs are shown in Figure 1(d). Motivation for examining blackbodies lies in the fact that the shape/hardness of ionizing spectra of blackbodies with K resembles that of PopStar models at an age of Myr, when Wolf-Rayet (WR) stars begin to dominate the ionizing spectrum (Stasińska et al., 2015). We aim to examine the UV spectrum if the incident radiation field is as hard as (or harder than) that during the WR-dominated phase. Furthermore, these high-temperature blackbodies could be the main ionizing source if very massive stars, as observed in the central region of the star clusters in the nearby universe (e.g., Crowther 2016), dominate the integrated spectrum of the system. As we see below, another advantage of blackbody spectra is that they have a higher ionizing photon flux per unit of UV luminosity, , than more realistic stellar spectra, as they show no discontinuity at the Lyman edge, in contrast with stellar spectra (see e.g., Fig. 15 from Raiter et al., 2010). Although we do not know which astrophysical sources would show this behavior, it is useful to use these models to examine the origin of the largest EWs of Ciii] found in some VUDS spectra.
2.5 PopIII star
The final scenario we consider is the PopIII stellar population as the main ionizing source. We take one PopIII SED from Raiter et al. (2010) at zero-age with a Salpeter (1955) IMF and its lower and upper mass cut-offs of M⊙ and M⊙, respectively. The SED is presented in panel (d) of Figure 1 (dotted). For the popIII models, we additionally consider extremely metal-poor gas nebulae of and . The model calculations are terminated at the electron fraction of as done for the star-forming galaxy models (Sect. 2.1).
3 UV line predictions
In this Section we present the photoionization model predictions of the UV line fluxes and EWs that can be directly compared with the observations. Specifically, in this paper we use three diagrams of CivCiii] versus (Ciii]Civ)He ii, EW(Ciii]) versus Ciii]He ii, and EW(Civ) versus CivHe ii. These three lines were chosen as they are the three most prominent UV emission lines after Ly observed in the spectra of galaxies at – (e.g., Le Fèvre et al. 2015). The first line ratios diagram is hereafter referred to as the C4C3–C34 diagram. This combination is motivated by the optical line ratios diagram of O iii][O ii] versus ([O ii]O iii])H (e.g., Nakajima & Ouchi 2014), which is useful for inferring the metallicity and ionization parameter. The latter two diagrams use, in part, EWs, which are observable even from galaxies at high- (e.g., Stark et al. 2015a, b). These three diagrams confer the advantage that objects can be plotted and diagnosed even if only one of the three lines is detected. The main parameters that govern the positions in the diagrams are: metallicity, ionization parameter, density, and shape of ionizing photon spectrum. In addition, for star-forming galaxies, the age of the current star-formation (or ) is also important for the prediction of EWs. In the following subsections, we explain the behaviors of each of the models presented in Sect. 2 using the three UV diagrams described above.
3.1 Single stellar population
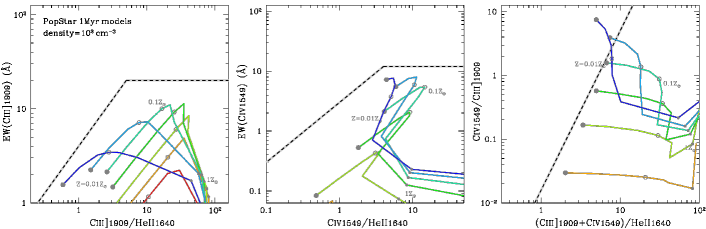
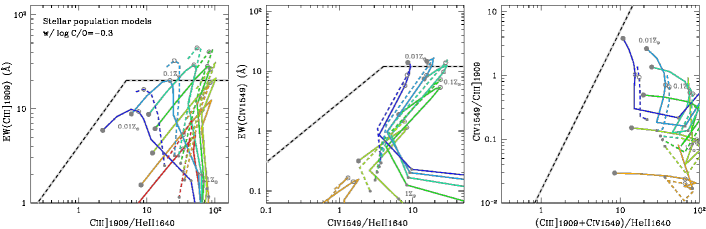
Figure 2 presents the three diagrams of C4C3–C34, EW(Ciii])–Ciii]He ii, and EW(Civ)–CivHe ii for the conventional star-forming galaxies, using the Myr SED from the PopStar models and cm-3 (hereafter referred to as our “default model”), as a function of metallicity and ionization parameter. Variations of gas density and age of SEDs are discussed below.
An interesting feature found in Figs. 2 and 3 is that EWs of Ciii] and Civ generated by a single stellar population have maximum values; EW(Ciii]) Å, and EW(Civ) Å. Since lower EWs are predicted for older ages (cf. below) this indicates that objects with an EW of Ciii] and/or Civ over Å are difficult to explain by photoionization of a single stellar population. The limit for Ciii] may be slightly relaxed to EW(Ciii]) Å when binary stars are included, as discussed in Sect. 3.2. The EWs of Ciii] and Civ increase with metallicity (i.e., with carbon abundance) in the low-metallicity regime, up to a turn-over metallicity, above which they decrease again. The turn-over metallicity values for the EWs of Ciii] and Civ are and , respectively. These turn-overs are mainly due to the fact that the gas temperature decreases with increasing metallicity, and the ultraviolet collisional excitation lines therefore become weaker. The EW(Ciii]) increases with increasing ionization parameter up to . For even higher ionization parameters Civ becomes dominant and the EW(Ciii]) decreases.
Figure 2 also shows that high ratios of Ciii] and Civ to He ii are predicted, as expected (cf. Feltre et al., 2016). This is due to a weak He ii emission. Since the He ii is a recombination line in a He++ region, very high-energy ionizing photons of eV are needed, which is not expected for normal stellar populations (see Fig. 1a). The ratios of Ciii]He ii, CivHe ii, and (Ciii]Civ)He ii are predicted to increase with metallicity (Fig. 2). This is due to a softening of the radiation field with increasing metallicity, which causes a decrease of He ii emission. Furthermore, Ciii] and Civ emission increases with metallicity, up to the “turn-over metallicity”. The CivCiii] ratio is also sensitive to the ionization parameter, increasing with increasing ionization parameter.
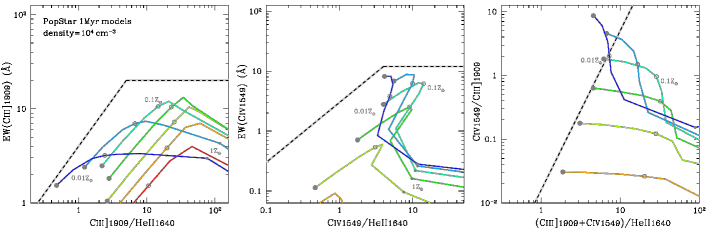
Since Ciii] is a collisionally excited line, the strength depends on gas density, as shown in Fig. 3. Here we present the models with cm-3, which is likely to be the highest gas density observed for star-forming galaxies at high- (Sanders et al., 2016). The Ciii] emission gets stronger if a higher gas density is assumed. The trend is visible especially in the high-metallicity regime (), where the carbon ions are more abundant. However, the change of the peaks of the EW(Ciii]) are minimal over orders of magnitude in density. Since the maximum value of the EW(Ciii]) is obtained if the gas metallicity is , the enhancement of the maximum value is not prominent. The critical density for Ciii] is about cm-3, and the collision de-excitation is almost negligible for these models.
3.2 Binary stellar population
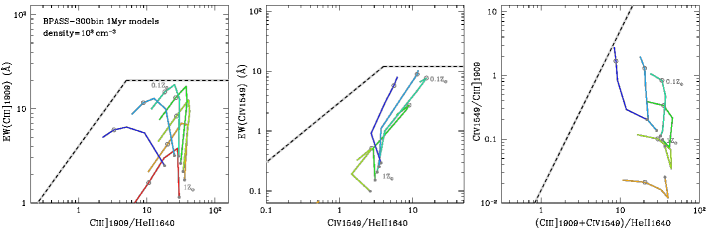
Figure 4 shows the UV lines and EWs predicted for the binary stellar population models. These cases correspond to galaxies whose ionizing spectrum is harder than previously suggested by single stellar population models (e.g., Steidel et al. 2016). A feature of the binary models is that He ii emission becomes stronger compared to the PopStar models (see Fig. 2), due to a harder ionizing spectrum of the binary models (Stanway et al., 2015).
A notable difference between the single and binary star models lies in the EWs of Ciii] and Civ. The binary models predict larger EWs by a factor of , which is primarily due to the increased ionizing photon flux per UV continuum luminosity (measured e.g., by ). If the BPASS SEDs are appropriate, we expect star-forming galaxies to show EWs of Ciii] and Civ as large as Å and Å, respectively.
Predictions concerning emission line ratios are almost the same as seen in the single stellar population. The CivCiii] ratio does not change significantly from single to binary stellar populations, since the shape/hardness of the ionizing radiation field is almost indistinguishable in the energy range below eV, as seen in Fig. 1(a).
3.3 Variation in CO abundance
As the standard model we assume the formula of Dopita et al. (2006) to give a Carbon abundance at each metallicity. Although the relation is generally in good agreement with observations of galaxies at (e.g., Steidel et al. 2016), a non-negligible scatter toward higher CO is also reported (e.g., Amorín et al. 2017). Since the CO abundance ratio affects the predicted strengths of the Ciii] and Civ lines, a possible variation in CO ratio needs to be explored. In this subsection, we present models with a higher CO ratio, which might be applicable to some strongly Ciii] emitting galaxies.
Figure 5 shows the PopStar and the BPASS-300bin models with a fixed CO ratio of CO , a solar value, irrespective of metallicity. Compared to the values given by the Dopita et al. (2006) formula, the CO abundance ratio is higher by , , , , , and dex for the metallicities , , , , , and in our models. Figure 5 shows that a high CO abundance ratio increases carbon-to-helium line ratios and the EWs of the carbon emission. The EWs and the C34 ratio scale approximately linearly with the CO ratio. Therefore, the increase with respect to our standard models is more significant for low-metallicity models. The C4C3 ratio is less sensitive to the change of the CO ratio, as expected.
In some models the EWs of Ciii] and/or Civ become larger than the limits, EW(Ciii]) Å and EW(Ciii]) Å, that we find in the standard models. These models have a low metallicity ( where the Ciii] and/or Civ emission peaks) but a Carbon abundance as high as the solar value in CO, which can hardly be considered normal (cf. Sect. 7.2). Subsequently we therefore adopt the standard models using the prescription of Dopita et al. (2006) for the CO ratio, and refer to models with higher CO ratios only when the standard models are insufficient.
3.4 Age effects
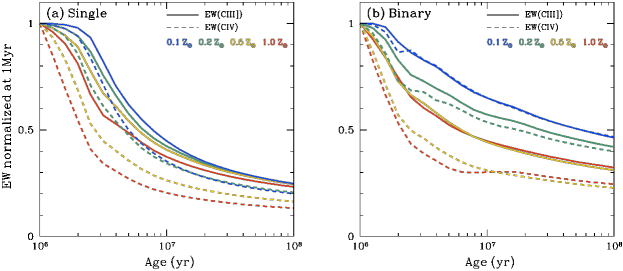
Although the youngest stellar population of Myr is convincingly reproducing emission line ratios of star-forming galaxies, it is not adequate to discuss their EWs since the continuum level strongly depends on the older stellar population. Here we discuss the age dependencies of the EWs for both the single and binary-stellar population models. Age is defined here as the time since the onset of the current star-formation period. The ages are sensitive to the UV continuum level, the shape of the ionizing spectrum, and thus to the parameter. Figure 6 presents the EWs of Ciii] and Civ and their changes as a function of age assuming a constant star formation. They are normalized at the age of 1 Myr, where the EW is maximal. To first order, as shown by the solid (dotted) lines, the relative decrease of the EW of Ciii] (Civ) with age is determined by the decrease of the number of ionizing photons with energies above the corresponding ionization potentials of eV ( eV) and the increase of the non-ionizing UV-continuum flux density around Å ( Å). Moreover, the nebular continuum is added to the UV continuum, as predicted by Cloudy. For this Figure we choose a typical ionization parameter 333 =, , , and for , , , and following an empirical relation (e.g., Kojima et al. 2017). and scale the nebular continuum with the number of ionizing photons. The decreases of EWs with age are in good agreement with the predictions directly modeled by Jaskot & Ravindranath (2016) for both the single and binary stellar population models. For example, for the single stellar population with , the EW of Ciii] (Civ) is suggested to decrease by a factor of about () and () at the age of and Myr, respectively, with respect to the EW at the age of Myr. On the other hand, if the binary stellar population is assumed, the EWs of Ciii] (Civ) become weaker by a factor of about () and () at the age of and Myr, respectively, even with the same metallicity of . The age dependence of EW is less significant if the binary stellar population is assumed (Jaskot & Ravindranath, 2016), as the effects of binary evolution tend to prolong the epoch over which blue stars dominate the spectrum (Stanway, 2017).
3.5 Active galactic nuclei
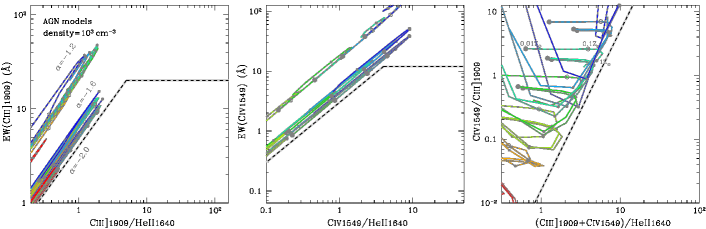
Figure 7 shows the grid of AGN models with power-law indices of , , and . The UV line diagrams look quite different if the AGN SEDs are adopted instead of the SEDs discussed in previous sub-sections. One notable difference is the lack of high (Ciii]Civ)He ii (and Ciii]He ii, CivHe ii) ratio. This is due to the strong He ii emission in the AGN models (e.g., Feltre et al. 2016). The power-law spectra are hard enough to provide a large number of ionizing photons with energies above eV, by orders of magnitudes more than pure star-forming galaxies (see Fig. 1b). The AGNs’ hard spectra also enhance the Civ and Ciii] emission. However, the enhancement of Ciii] is less significant because the AGN models assume dust-free gas clouds and lack the enhancement of the line strength due to the photoelectric heating in photoionized regions (van Hoof et al., 2004). If we adopt a harder index from to , the He ii and Civ become stronger when compared to Ciii]. Despite the changes of the line ratios, AGN models are generally distributed in a well-defined area on the C4C3–C34 diagram, separated from the star-forming galaxy models, as also shown by the “dividing” lines shown in Fig. 7 and discussed below.
Adopting a higher gas density ( cm-3 instead of cm-3), leads to changes of the EWs and line ratios similar to those seen in star-forming galaxies (Figs. 2 vs. 3). The higher gas density results in a stronger Ciii] emission, typically by a factor 2. For AGN SEDs, the maximum EW(Ciii]) is obtained for metallicities close to solar. An interesting possibility to note is that the EWs for the AGN models might be underestimated due to a possible attenuation of the continuum emission from the central accretion disk for type-II AGNs in the UV wavelength range (Sect. 2.2). If this were true, the EWs plotted in Fig. 7 would give lower-limits of EWs for a given ISM condition and index. If corrected for this effect, the difference between the star-forming galaxy models and the AGNs in the two EW plots would become much more significant (see also Sect. 4.1.2).
3.6 Star-forming galaxies with an active galactic nucleus
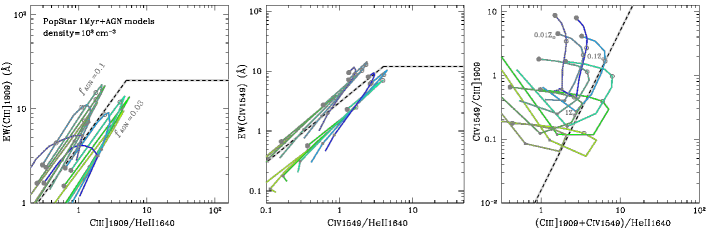
The UV line diagrams for star-forming galaxies with a contribution from an AGN are given in Fig. 8. Two cases are presented, and , with % and % contributions of AGN to the total number of ionizing photons, respectively. The main difference between pure star-formation and mixed star-formationAGN SEDs appears in the high-energy regime of eV (see Fig. 1). Therefore, stronger He ii emission is predicted for the star-formationAGN models. Indeed, Fig. 8 shows that only a few percent of AGN contribution strongly affects the He ii-related line ratios. If the AGN contribution exceeds % the line ratios are almost indistinguishable from those produced from pure AGNs. The EWs of Ciii] and Civ, on the other hand, do not change significantly even if an AGN component is added to the ionizing radiation. The UV continuum level and the parameter are thus considered to be particularly important for the UV EWs. If we adopt a harder index of , the carbon-to-helium ratios increase by less than , and the EWs of Ciii] and Civ by . Therefore, the hardness of the power-law component has little influence on the UV diagrams. Since the hardness of the power-law component and the AGN fraction are degenerate, we simply fix the index to and vary the AGN fraction in the following analyses. We note that even the star-formationAGN models cannot predict high Ciii] equivalent widths EW(Ciii]) Å.
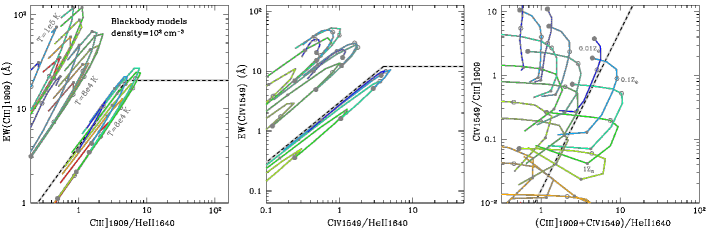
3.7 Blackbodies
Figure 9 presents the UV line diagrams for blackbodies with high effective temperatures as proxies for a harder ionizing photon spectrum by stars. The shape of the SED of the blackbody with a temperature of K appears similar to those provided by PopStar and BPASS in the range of – eV. Ionizing photons with higher energies of eV are, however, much more abundant for the blackbody than in stellar population models. Thus, stronger He ii emission is expected with blackbody spectra. However, a warning is needed for the EW predictions using blackbody spectra. In these models, we use a single blackbody SED over the entire energy range. Since these spectra show no Lyman break – in contrast to stellar models (see e.g., Raiter et al., 2010) – the predicted EWs are significantly larger than derived from more realistic stellar population models. For example, the maximum EW of Ciii] reaches Å and Å for blackbodies with K and K, respectively. Therefore, these EWs can be regarded as giving a very conservative upper-limit, which could be achieved by an extremely top heavy IMF at almost zero age or for spectra dominated by extreme massive stars such as the popIII stars (Sect. 3.8) The increase of the CivCiii] ratio with increasing temperature, due to the harder ionizing spectrum, is also noticeable. If the temperature is higher than K, the UV line ratios and EWs become similar to those of AGN.
3.8 PopIII star
Fig. 10 shows the results if the popIII stellar spectrum is used. The behaviour of the models in the UV line diagrams, in particular in the C4C3–C34 diagram, is quite similar to those of the K blackbody models in Fig. 9. This is reasonable, since the blackbody with a temperature of K provides a good approximation to the popIII SED below Å (Raiter et al., 2010). Since the more realistic popIII SED of Raiter et al. (2010) shows a Lyman break due to the hydrogen opacity in the atmosphere of the hot stars, it possesses a higher level of UV continuum. This results in the slightly decreased EWs of Ciii] and Civ (by a factor of ) compared to the K blackbody models. Overall, the UV line ratios and the EWs of the popIII star models resemble those of AGN.
We should note that if we assume a very metal-poor gas of , the EW(Ciii]) becomes smaller than Å and the C34 index smaller than . These popIII galaxy models fall out of the ranges presented in Fig. 10. Therefore, the models presented in Fig. 10 correspond to cases where the interstellar medium is relatively evolved (enriched), while the ionizing radiation field is very hot/hard as represented by pop III-like stellar spectrum. Whether or not such conditions are realized in nature remains to be determined.
4 Applications of the UV diagrams
We now show how the UV diagrams allow for distinction between AGN and stellar sources, and how they can be used to constrain physical properties of the ISM and star-formation ages.
4.1 UV diagnostics to separate AGN from stellar photoionization
The Cloudy models presented in Sect. 3 show that UV lines are sensitive to the shape of the incident radiation field. This implies that, in an analogous manner to that for optical lines, the UV lines can be used to distinguish the nature of the dominant ionizing source, that is, stellar photoionization of AGN-dominated objects, as already shown by earlier studies (e.g., Feltre et al. 2016; Gutkin et al. 2016). Here we discuss so-called diagnostic diagrams based on the Ciii], Civ, and He ii lines, the three most prominent/informative UV emission lines, including for the first time (to the best of our knowledge) diagnostics involving the equivalent widths of these UV lines.
We note that we have tested and confirmed that our models of star-forming galaxies and AGNs successfully reproduce the optical BPT diagram (Baldwin et al. 1981; Kewley et al. 2001; Kauffmann et al. 2003), except for the metal-poor AGN models with . The difficulty in isolating metal-poor AGNs with the BPT diagram has already been pointed out by earlier theoretical work (e.g., Kewley et al. 2013), suggesting that a different diagnostic might be needed for completely distinguishing AGNs from star-forming galaxies. The UV diagnostic diagrams we present below potentially have the ability to work for such metal-poor AGNs.
4.1.1 Diagnostic of C4C3–C34
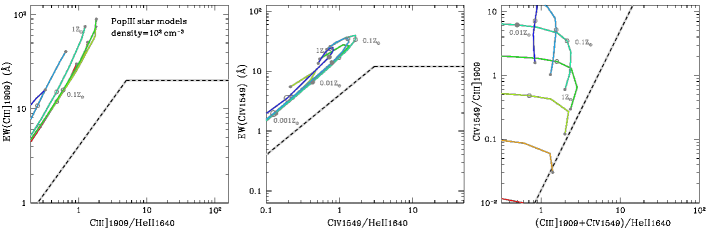
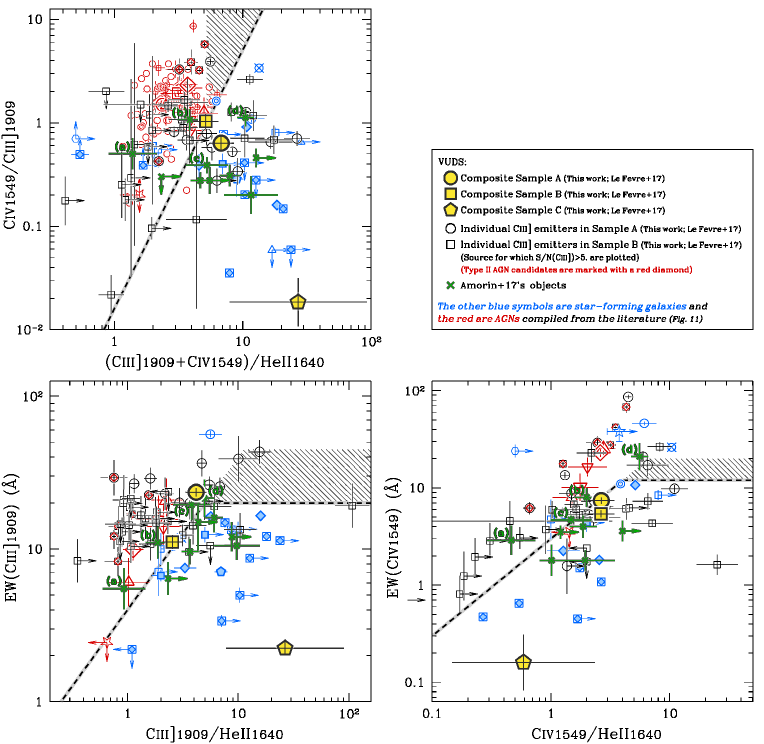
The top left panel of Fig. 11 shows the line ratios of CivCiii] (C4C3) and (Ciii]Civ)He ii (C34) for the models with the SEDs of star-forming galaxies and AGNs. We display both the single and binary stellar models for star-forming galaxies. For the AGN models, we plot those for the softest and the hardest spectra (i.e., and ). A remarkable difference is found in the C34 parameter between stellar and AGN models, such that AGNs tend to have a smaller C34 value for a fixed C4C3. The difference is primarily caused by the He ii strength, which is sensitive to the shape of the ionizing spectrum in the very high-energy regime of eV (Sect. 3).
The top-right panel of Fig. 11 shows the same C4C3–C34 diagram, illustrating now the position of observed star-forming galaxies and AGNs collected from the literature. We note that the compiled measurements of the Civ and He ii emission for star-forming galaxies need to be free of any possible stellar absorption and emission (see also Sect. 5 for the corrections done for the VUDS Ciii] emitters). If the Civ strength is measured with the emission line component alone (without the absorption component taken into account), we simply adopt the measured value as the nebular emission. As for the He ii emission, only a resolved narrow component is used as the nebular-origin He ii emission (e.g., Erb et al. 2010; Vanzella et al. 2016; Senchyna et al. 2017). Although the sample of sources remains quite small, the difference between galaxies and AGNs on the C4C3–C34 diagram is significant, and agrees well with our mode predictions in the top-left panel. Using the distributions of galaxies and AGNs in conjunction with our models, we define a method to distinguish star-forming galaxies from AGNs in the C4C3–C34 diagram as follows:
| (1) |
We note that Eq. (1) is also largely valid if galaxies have a higher CO abundance ratio (Fig. 5).
Using the sample of star-forming galaxies, which are classified by the optical BPT-diagnostics (Erb et al., 2010; Stark et al., 2014; Berg et al., 2016; Senchyna et al., 2017), and individual AGNs, Eq. (1) gives clean samples of galaxies and AGNs whose “classification success rates” are % ()444 We omit one galaxy (ID 110 from Senchyna et al. 2017) since it cannot be classified due to its weak lower limits on the ratios. and % (), respectively. We also note that one star-forming galaxy (ID 111 from Senchyna et al. 2017) falls significantly onto the AGN region. This could be because the strong He ii emission is not well corrected for the stellar emission. One caveat is that, as seen from the top-left panel of Fig. 11, there is a small region in this diagram where both AGN and SF models overlap, that is, our classification may be ambiguous. This region, with C4C3 and C34 – which is highlighted with a gray-shaded region, corresponds to SF models with a very low metallicity () and/or a high ionization parameter of . So far, such a high ionization parameter or low metallicities have rarely been reported. Using larger samples to further test and improve the proposed classification in the future will certainly be useful. For all other regions of this phase space the SF and AGN models are clearly separated.
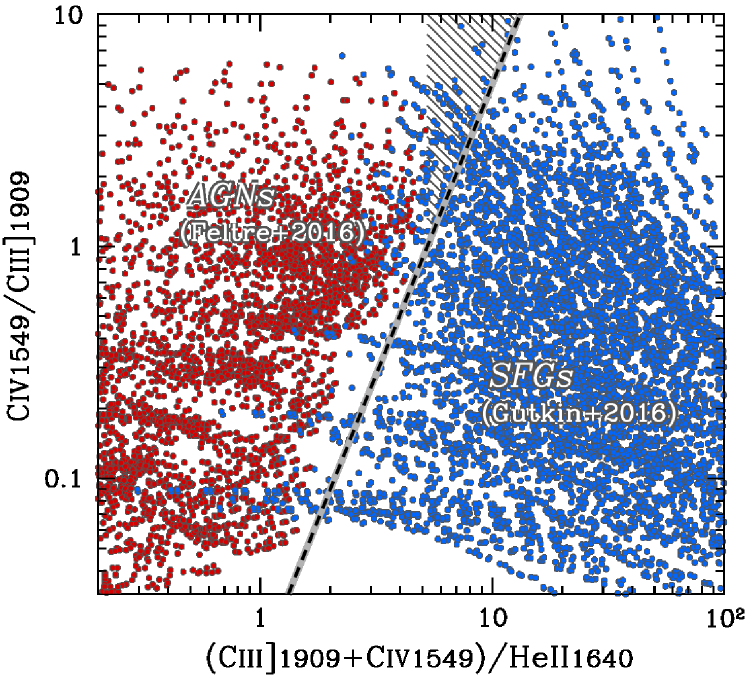
Figure 12 shows AGN and star-forming galaxy models from Feltre et al. (2016) and Gutkin et al. (2016), respectively, on the C4C3-C34 diagram. These models include more variants than ours, such as dust-to-metal mass ratio, CO abundance ratio, IMF, and so on, and are thus useful to check our diagnostic. Albeit with our simpler modeling, it is demonstrated that our models and the separation criteria of Eq. (1) are nicely consistent with these earlier UV modeling studies. We note that a small fraction of the modeled star-forming galaxies contaminate the AGN regime on the C4C3-C34 diagram. They are usually metal-poor galaxy models with . Practically, such a metal-poor gas cloud is thought to be associated with a high ionization parameter (; e.g., Onodera et al. 2016; Kojima et al. 2017). We thus do not worry about the contaminated models with C4C3 . For the contaminated SF models with C4C3 larger than unity and C34 – (gray-shaded region), such metal-poor and highly ionized galaxies could exist and could be missed by the current method, as we have found with our own models. We need more data to calibrate our model predictions. We emphasize again that these earlier studies only make use of the flux ratios. This paper additionally presents the EWs behaviors as a function of the incident radiation field for the first time, as presented in the following Section (Sect. 4.1.2).
4.1.2 Diagnostics using EWs of Ciii] and Civ
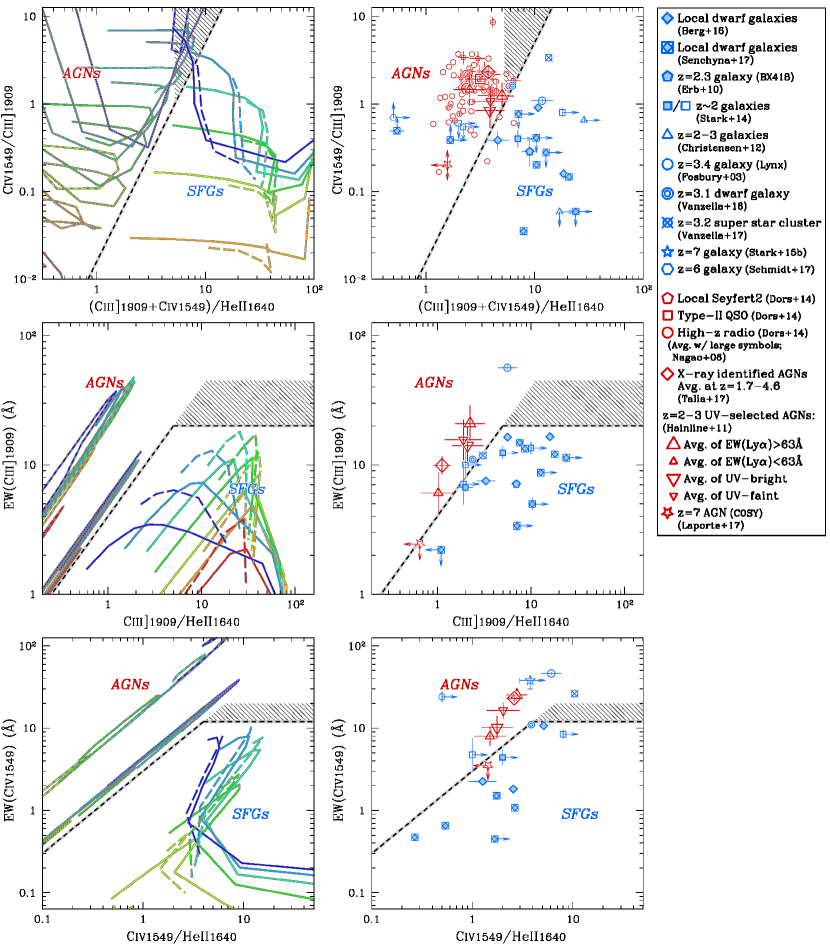
We now discuss the use of the UV diagnostics involving line EWs. The middle and bottom panels of Fig. 11 show the UV diagrams of EW(Ciii]) versus Ciii]He ii ratio and EW(Civ) versus CivHe ii ratio, respectively. The models presented in the left panels show that star-forming galaxies and AGNs are distributed differently in these plots, with AGNs having an EW of Ciii] (Civ) larger than that of star-forming galaxies at a fixed line ratio of Ciii]He ii (CivHe ii). From this we propose the following demarcation line to distinguish between star formation and AGN:
| (6) |
Similarly, for the EW(Civ) plot:
| (11) |
Comparisons between the observed data points and our models are found in the right-hand panels of Fig. 11. Again, although the observations are quite sparse, the EW diagnostics appear to work exceptionally well. Only and star-forming galaxies are found in the literature that can be plotted in the EW(Ciii]) and EW(Civ) plots, respectively, and that are diagnosed to be a star-dominated galaxy by the optical BPT-diagram. All of these objects are in the star-formation regions that we set in the EW(Ciii]) and EW(Civ) plots. Regarding the AGN sample, we use the Talia et al. (2017) and the Hainline et al. (2011) composite samples because most of the individual AGNs shown in the top right panel have no published EWs. Talia et al. (2017) use X-ray-identified type-II AGNs at , while Hainline et al. (2011) rely on the high-ionization UV lines of N v and Civ to construct the AGN sample at (cf. Steidel et al. 2002). Figure 11 shows that all of their composite AGNs are classified as AGN in both EW plots. In addition, a candidate AGN at named COSY is recently reported by Laporte et al. (2017) based on the detection of high-ionization lines of N v and He ii but the absence of Ciii] and Civ. As shown in Fig. 11 the upper limits on C34 and the Carbon equivalent widths are compatible with AGN models.
As mentioned in Sect. 3.3, the maximum EWs would become larger if metal-poor sources with an increased CO ratio existed. Since the carbon-to-helium ratios also scale linearly with C/O, a simple extension of the dividing line in the range of Ciii]He ii and CivHe ii in Eq. (6) and (11), respectively, would work to find such an unusual population as illustrated with a gray-shaded area in the middle and bottom panels of Fig. 11 We set the maximum EW of Ciii] as Å and that of Civ as Å when the CO ratio is as high as the solar ratio (Fig. 5). Interestingly, a few outliers are found in the star-forming galaxy sample with high Ciii] or Civ equivalent widths in the AGN region. These are the Lynx arc (Fosbury et al., 2003), which could however also be AGN-powered (Binette et al., 2003), the super star-clusters candidate (Vanzella et al., 2017), and galaxies at redshifts beyond (Stark et al., 2015b; Schmidt et al., 2017), which are discussed later (Sect. 7.3).
In summary, Fig. 11 nicely demonstrates that the UV line ratios and EWs of Ciii], Civ, and He ii can be combined in a single diagnostic diagram to identify whether the dominant ionizing source is from star formation or AGN, and that our models agree very well with the observations.
4.1.3 Diagnostics for LINERs
Some of the AGN models presented in Sect. 2.2 produce optical line ratios typical of low-ionization narrow emission-line regions (LINERs) based on the optical classification (e.g., Baldwin et al. 1981; Kewley et al. 2006). These LINER models are characterized by a high metallicity () and a low ionization parameter (), both of which are consistent with earlier work (Kewley et al., 2006). They occupy a region on the C4C3–C34 diagram with C4C3 and C34 . The C4C3–C34 diagram can thus work to discriminate between LINERs and other AGNs. There are, however, several caveats. Since the power source of LINERs is still under debate (e.g., Kewley et al. 2006, 2013 and references therein), it remains unclear whether or not the LINERs included in the AGN models are complete. Moreover, we cannot predict robust EWs for LINERs due to the uncertainty of their UV-continuum. Therefore it is preferable to use emission line ratios instead of EW diagrams in this case.
4.2 UV diagrams to estimate ISM properties and star-formation age
In addition to the shape of the incident radiation field, the UV diagrams would be helpful to infer the ISM properties such as metallicity and ionization parameter, especially for star-forming galaxies555 Refer to, e.g., Nagao et al. (2006) and Dors et al. (2014) for AGNs. . According to the C4C3–C34 diagram, the ionization parameter of the compiled galaxies and nearby dwarf galaxies are in the range from to associated with a metallicity of subsolar or smaller values. These are reasonably consistent with those estimated from the optical emission lines (Christensen et al., 2012; Stark et al., 2014; Berg et al., 2016). The two highly ionized galaxies, Lynx arc (Fosbury et al., 2003) and BX418 (Erb et al., 2010), could indeed be diagnosed as showing a very high ionization parameter of to if their metallicities are relatively high (Z ) as indicated with the optical emission lines.
Once the ISM properties are well constrained, we can use the EWs plots to estimate the star-formation age (or ), since EWs of UV lines are sensitive to the ratio of ionizing to non-ionizing UV photons (Fig. 6). Figure 13 presents the distributions of EWs of Ciii] and Civ for star-forming galaxies as a function of metallicity, and compared to our models. Plotted curves are our models. Except for some outliers with large uncertainties, Fig. 13 nicely demonstrates that our models give an upper-limit of EWs at a fixed metallicity. Many of the nearby galaxies show a small EW(Ciii]) of Å. This is because they possess an evolved stellar population with a low ionization parameter. If we adopt an empirical relation between metallicity and ionization parameter typically seen in the local universe; (Kojima et al., 2017), nearby galaxies in the metallicity range from to would have an ionization parameter from to , which are denoted by the yellow and orange curves, respectively, in Fig. 13. It is thus obvious that the Myr models usually over-predict the EW(Ciii]) for the given ISM condition, as expected, and that these galaxies experience a much longer star-formation of Myr (cf. Fig. 6).
In Fig. 13, it is interesting to note that below the subsolar metallicity, many of the compiled galaxies at any redshift show an EW(Ciii]) larger than Å. This suggests that such metal-poor galaxies require a hard ionizing spectrum or an efficient ionizing photon production achieved by a binary stellar population (e.g., Senchyna et al. 2017). Moreover, the Myr models are close to reproducing a number of low- galaxies with large EWs, while we regard these models as providing EW upper limits for a given ISM condition. This trend indicates that those low- galaxies are generally a very young population (Jaskot & Ravindranath, 2016).
Finally, we identify outlier emitters with a larger EW of Ciii] and/or Civ than predicted by our models. Many of them are compatible with our models within their large observational errors. A higher gas density than adopted in Fig. 13 ( vs. cm-3) would also help to alleviate the apparent discrepancies at least in the Ciii] diagram as models would return an increase of a factor of – in EW(Ciii]) at a fixed metallicity in the subsolar metallicity regime (Sect. 3.1). Still, a small fraction of galaxies reported in Berg et al. (2016) and Amorín et al. (2017) might show enhanced EWs of Ciii] and Civ. This could be because such peculiar objects possess a higher parameter than predicted by the binary stellar population models. Another possibility is that some of these objects contain an AGN. All of the galaxies of Berg et al. (2016) are confirmed to be star-forming based on the optical BPT diagram (Baldwin et al., 1981), while the Amorín et al. (2017)’s sample remains to be checked. This hypothesis is revisited in Sect. 6.2 for the objects of Amorín et al. (2017). Moreover, they could have a large CO abundance ratio (Sect. 3.3). In this low- regime, the Dopita et al. (2006) prescription we adopt gives a CO abundance ratio of . If those galaxies are more carbon-enriched, this could explain the EWs of Ciii] and/or Civ larger than predicted by our models. Indeed, higher CO abundance ratios than by dex are inferred for some of these outliers in the low-metallicity regime (Berg et al., 2016; Amorín et al., 2017). The higher CO ratios could result in stronger EWs than predicted by the standard models shown in Fig. 13 in the low-metallicity regime by a factor of –. This trend could suggest an importance of the CO abundance ratio to estimate the ISM properties and the star-formation age with the UV lines. (Sects. 6.2 and 7.1)
| A | Ciii] emitters with EW(Ciii]) Å |
|---|---|
| B | Ciii] emitters with EW(Ciii]) Å |
| C | star-forming galaxies |
| EW (Å) - - - - - - - - - - - - - - - - - - - - - - - - - - - - - - | Flux ratio relative to Ciii] - - - - - - - - - - - - - - - - - - - - - - - - - - | |||||||||
| Ciii] | Civ | Civcorr(1) | He ii | He iicorr(2) | Ciii] | Civ | Civcorr(1,3) | He ii | He iicorr(2,3) | |
| A | ||||||||||
| B | ||||||||||
| C | ||||||||||
(1) Civ strength corrected for stellar absorption. (2) He ii strength corrected for stellar emission. (3) Corrected for reddening (see Sect. 5).
5 Ciii] Emitters found by VIMOS Ultra Deep Survey
VUDS identifies the Ciii] emission from large numbers of galaxies at redshifts (Le Fèvre et al., 2015). Details of the construction of the Ciii] emitter sample are summarized in Le Fèvre et al. (2017). The sample contains individual Ciii] emitters with rest-frame EW(Ciii]) above a detection limit of 3 Å. Broad-line, type-I AGN are excluded from the sample. The EW distribution has a tail toward a very high Ciii] EW beyond Å (see Le Fèvre et al. 2017). These strong Ciii] emitters motivate us to create a large grid of photoionization models, providing a crucial test of what we can learn from the Ciii] and the other UV lines that are available from galaxies in the early universe.
In order to address the properties of the strongly Ciii]-emitting objects we use three subsamples based on the strength of the Ciii] emission (Table 2). Sample A contains the strongest Ciii] emitters whose EW(Ciii]) is larger than Å. The second strongest Ciii] emitters of objects with EW(Ciii]) – Å make up Sample B. For reference, Sample C presents all the UV-continuum-selected VUDS star-forming galaxies, containing galaxies.
Since only broad-line type-I AGN are excluded, our Ciii] emitter sample could contain type-II AGNs. Indeed, and Ciii] emitters in the classes of EW(Ciii]) Å and – Å, respectively, have an X-ray counterpart based on the work of Talia et al. (2017). Since one of the motivations of this paper is to understand the nature of the strong Ciii] emitters, we do not eliminate these likely type-II AGNs at this stage. We use them subsequently to test our UV emission line diagnostics.
For a detailed analysis of the UV lines of the Ciii] emitters we need several emission lines to be significantly identified. In this paper we use three UV lines: Ciii], Civ, and He ii recombination. We therefore make composite spectra in the three samples to increase the SN ratios of the important UV emission lines. For Sample A whose sample size is quite small, we adopt a median stacking of the normalized individual spectra to get a representative composite spectrum. For Samples B and C we simply average the normalized spectra. The composite spectra of the three samples are presented in Le Fèvre et al. (2017). The necessary emission lines are clearly identified except for the Civ in Sample C. The absence of the Civ emission in Sample C is due to the strong Civ absorption by the stellar population as indicated by the P-Cygni profile. To correct the Civ measurements for stellar absorption, we use EW(Civ) Å as obtained from the composite spectrum of all star-forming galaxies in VUDS with Ly in absorption (Le Fèvre et al., 2015), with the idea that this would minimize the contribution from galaxies with some Civ emission, and hence produce a Civ value more representative of the stellar absorption value. This value is quite close to that found by Shapley et al. (2003), but is best used for our VUDS samples. We note that the EW correction is valid only if the Civ strength is measured in the same way, that is, over the wavelength range of both the Civ absorption and emission components. Another caveat is that the He ii emission is known to be a composite of the stellar and nebular emission (e.g., Brinchmann et al. 2008; Erb et al. 2010). Since our photoionization models can only predict the nebular emission, we need to subtract the stellar He ii component before comparing with our photoionization models. In this paper, we assume the EW of the stellar He ii emission is Å, which is predicted by models of Brinchmann et al. (2008) with metallicities below the solar value at Myr or older. Although the stellar component could be stronger if the binary stellar evolution is taken into account (e.g., Erb et al. 2010; Steidel et al. 2016), we cannot further constrain its strength with the currently available data set.
To correct for the reddening effects on the line ratios, we rely on the UV slope directly obtained from the VUDS spectra. The UV slopes of , , and are inferred from the spectra of Samples A, B, and C, respectively (Le Fèvre et al., 2017). Using the SMC extinction curve that is preferred for high- galaxies (e.g., Reddy et al. 2017), these UV slopes correspond to , , and for Samples A, B, and C, respectively. We correct for the reddening of the line ratios using the value for each sample using the SMC extinction law (Gordon et al., 2003), assuming that the reddening of the nebular emission and stellar continuum are identical. Although we understand this assumption remains open to debate especially at high- (e.g., Förster Schreiber et al. 2009; Reddy et al. 2010), we adopt it for the Ciii] emitters because it is considered to be reasonable for actively star-forming galaxies at high- (e.g., Reddy et al. 2015). The correction for the CivCiii] ratio, which is the most reddened ratio presented in this paper, for example, is a factor of , , and , for Samples A, B, and C, respectively. Although the UV slope for Sample C is less steep than reported by Hathi et al. (2016) with a larger sample of VUDS, , this is likely because the Hathi et al. (2016)’s sample contains fainter, and thus bluer galaxies. We do not add the errors of the measurements (=0.02 – 0.08) as well as the difference between Sample C and the Hathi et al. (2016)’s sample to the corrected line ratios since they are much smaller than the errors originating from the corrections for the stellar emission / absorption for the Civ and He ii emission. As for the EWs, we adopt the observed values divided by as the intrinsic ones under the assumption that the reddenings of the nebular emission and stellar continuum are the same.
The EWs and fluxes of the UV lines for the three composite spectra are given in Table 3, taken from Le Fèvre et al. (2017). Both the observed and corrected values are listed for the Civ and the He ii emission. The individual spectra of the Ciii] emitters in Samples A and B are corrected in exactly the same way for each sample.
6 The nature of the Ciii] emitters from VUDS
We now examine the observed VUDS sources, both stacked spectra and individual sources, in the three UV diagnostic diagrams of Fig. 14, and we use them to infer properties of the incident radiation field and the ISM of the Ciii] emitters in the following subsections.
6.1 Stack of all VUDS star-forming galaxies at
The sample of all galaxies in VUDS (Sample C, Table 2) includes by definition all galaxies that are Ciii] emitters, in addition to all other star-forming galaxies. As shown in Fig. 14 this sample (yellow-filled pentagon) falls into the star-forming galaxy regions in all of the three UV diagnostic diagrams, as expected. We have confirmed that individual sources, most of which present only the Ciii] line, show line ratios and EWs consistent with those of the composite. Since such individuals provide poor constraints on the properties based on the UV diagrams, we only adopt the composite of Sample C to discuss the properties in this Section.
We now examine if the UV diagrams properly characterize the physical properties of galaxies in Sample C (Fig. 15). We first look into the line ratios of the C4C3–C34 diagram because the EW plots depend on the age of the current star formation as well as the ISM condition and the incident radiation field (Sect. 3.4). We adopt the binary stellar population models, which is preferred for high- star-forming galaxies (e.g., Steidel et al. 2016). Comparisons with the single stellar population models are presented later. The CivCiii] ratio and the C34-index of the Sample C composite give constraints on the metallicity and ionization parameter of (, ) from (, ) to (, ). Next, we consider the EW plots, especially the EW(Ciii]) plot. The composite of Sample C has large errors in the EW(Civ) plot due to the uncertain contribution to EW(Civ) from stellar populations. In the EW(Ciii]) plot, the ISM properties of (, ) (, ) – (, ) predict EWs(Ciii]) larger than the observed value by a factor of – , while the predicted Ciii]He ii ratios agree with the observed ratio. This discrepancy is easily resolved by adopting ages of () Myr for () instead of the unrealistically young Myr old population adopted by default (cf. Fig. 6). Therefore, the UV diagnostics tell us that typical star-forming galaxies at present a set of physical properties of (, , age) (, , Myr) – (, , Myr). Compared with the properties studied by other galaxy surveys at similar redshifts (e.g., Shapley et al. 2003; Mannucci et al. 2009; Onodera et al. 2016), the estimated ISM properties and age are in reasonably good agreement. The best-fit model (see Fig. 15) underestimates the EW(Civ) if the age of Myr is considered, albeit being consistent within the error. This illustrates the difficulty of using the EW(Civ) plot alone to estimate the physical quantities, since an accurate correction for stellar Civ absorption is needed, which requires a high SN and high spectral resolution, difficult to obtain at these redshifts.
In the similar method adopted for the binary models, we derive the best-fit parameters using the PopStar single star models as follows: (, , age) (, , Myr) – (, , Myr). A notable difference when using these models compared to the best binary models is that they output a younger age of star formation of less than Myr. One reason is that the binary models usually predict a larger maximum EW, which yields a larger gap between the maximum and the observed EW. Another is that the EW becomes weak more rapidly in the single stellar models if compared with the binary models (Fig. 6). These two factors result in a younger age for the current star formation from the single stellar population models. It is unlikely that the population of star-forming galaxies at these redshifts typically shows such a young starburst age. Furthermore, the ionization parameter of is smaller than estimated by earlier studies and for its relatively low-metallicity environment (e.g., Nakajima & Ouchi 2014; Onodera et al. 2016). The discrepancy between the predicted and observed (corrected) EWs of Civ becomes worse over the uncertainty in the single stellar models. Therefore, it is suggested that the binary stellar population models lead to a better and more reasonable agreement with the observation of typical star-forming galaxies at . This argument is consistent with the other individual studies (Sect. 4.2; Steidel et al. 2016; Jaskot & Ravindranath 2016).
6.2 Amorín et al. (2017)’s objects
Before moving to the stronger individual Ciii]-emitter samples, we re-examine the ten metal-poor compact galaxies found in VUDS at by Amorín et al. (2017). These objects have an intermediately strong Ciii] EW ranging from to Å (median value: Å). They are plotted with green crosses in Fig. 14, corrected for the possible stellar He ii emission in the same way as done for the other VUDS objects (Sect. 5). Since Amorín et al. (2017) measure the Civ by fitting only the emission component, we simply adopt their measurements as the nebular Civ strength. This sample is considered to be almost dust-free given a typical UV slope of . We therefore do not correct for the reddening since the effects on the line ratios are minimal. Figure 14 demonstrates that the line emission of the Amorín et al. (2017)’s objects is typically explained by star-formation as the ionizing source. A non-detection in X-ray also disfavors bright AGNs. However, a relatively large scatter of the sample is also visible in the diagrams. Six out of the ten objects are diagnosed as being powered by pure star formation from all three UV diagrams. We now discuss the remaining sources (labeled (a)–(d) in Fig. 14) in detail.
Among the four objects, one (ID 510583858; ; labeled (a) in Fig. 14) falls into the AGN regime in all three diagrams, irrespective of the corrections for the stellar He ii emission. Based on our diagnostics, this object is considered to be powered by AGN or mixed SF AGN with . Two other objects (ID 5101421970 and 5100998761; and ; (b) and (c) in Fig. 14, respectively) fall into the AGN regions, albeit close to the border. Their incident radiation field appears to be harder than that produced by pure star formation, and a SF AGN model or a soft AGN model can reproduce their UV lines strengths. If true, the metallicities derived by Amorín et al. (2017) for these sources might not be accurate. Specifically, the object (c) with ID 5100998761 is reported to have the lowest metallicity among the sample (), being an outlier in Fig. 13 having an EW(Ciii]) too strong for its metallicity to be explained by our star-formation models. This could be because the object is (partly) powered by an AGN-like hard ionizing source. If we adopt a hybrid model of SF AGN of 666 The fraction is inferred for the Ciii] emitters in VUDS (below). We simply linearly interpolate the models with the AGN contributions of and . the object is estimated to have a four times higher metallicity of , falling on a simple extrapolation of the mass-metallicity relation at (Steidel et al., 2014). Interestingly, the other two objects (a) and (b) (ID 510583858 and 5101421970, respectively) are suggested to be the two most massive galaxies in the sample () and to fall significantly below the mass-metallicity relation (Amorín et al., 2017). In the SFR– relation, they are almost in the star formation main sequence. This is in contrast to the other six pure star-forming metal-poor galaxies, which lie well above the star-formation main sequence. If we include an AGN ionizing spectrum, we find higher metallicity estimates than Amorín et al. (2017), and this would possibly affect their conclusions. If we adopt the SFAGN hybrid models, the line ratios and EWs of object (a) can be reproduced by either a high- (–) or a low- () model with . If the former solution is correct, this object is almost ten times more metal-rich than originally inferred by Amorín et al. (2017). In the same way, the object (b) is best-fitted by a – model with a metallicity of –, which is a factor of – higher than the original value. Moreover, if those objects are assumed to be completely powered by AGN (), they777 In this case, we use the line ratios and EWs uncorrected for the stellar He ii emission. could have a metallicity of – with a very high ionization parameter or a very low metallicity (–) with . Although we cannot reach a firm conclusion with the current data set, this demonstrates the importance of the shape of the incident radiation field when discussing ISM properties derived from the UV emission lines (Sect. 7.1).
The object ID 5100565880 ((d) in Fig. 14), showing the highest EWs of Ciii] and Civ ( Å) among the sample of Amorín et al. (2017) deserves special mention; also since it resembles many objects from the high-EW sample (A) discussed later. From the high EWs this source is classified as AGN, whereas it falls in the star-formation regime in the C4C3-C34 diagram. A hint to understanding this puzzling object is provided by the CO abundance ratio. This object shows a weak O iii] doublet with respect to the strong carbon emission lines. Amorín et al. (2017) thus derive an exceptionally high CO abundance ratio, , for its low metallicity of . This CO ratio is close to the solar abundance ratio (), a factor of higher than predicted by the Dopita et al. (2006)’s formula for its metallicity. The high CO abundance for its metallicity explains the “boost” of the Ciii] and Civ EWs of this object, and hence its unusual location in Fig. 13 as well as Fig. 14, in accordance with the fact that the EWs scale approximately linearly with CO (Sect. 3.3). This also suggests that the classifications using the EW plots could diagnose a galaxy as AGN if it possesses an enhanced CO abundance ratio.
In summary, Amorín et al. (2017)’s sample is mainly explained by star-formation as the ionizing source with a low metallicity. However, it could contain three objects that are, in part, powered by an AGN-like hard ionizing spectrum, and their metallicities could be higher than originally estimated if the harder ionizing spectrum is taken into account. Moreover, one source from Amorín et al. (2017) shows a very high CO abundance ratio, and presents boosted EWs of Ciii] and Civ for its ISM condition.
6.3 Intermediate Ciii] emitters with EW(Ciii]) – Å
Next, we examine the properties of the objects in Sample B, composed of intermediately strong Ciii] emitters with EW(Ciii])=– Å, using the diagnostics shown in Fig. 16.
6.3.1 Stars versus active galactic nuclei
As seen from Fig. 16 (cf. also Fig. 14), the composite of Sample B (yellow-filled square) falls on the border between the star-forming galaxy and the AGN regions. Individual objects in this class (black open squares) are distributed widely on the UV diagnostics. These trends suggest this galaxy population has an incident radiation field that is not fully explained by either a pure star-formation or an AGN. Based on our UV diagnostics, % of the sample is suggested to be likely star-forming galaxies, and % are likely AGNs or objects reproduced by a SF AGN model. The rest are uncertain due to a weak constraint on the He ii and/or Civ strengths.
Sample B includes four X-ray-identified type-II AGN candidates (Sect. 5). They are marked with a red diamond in Fig. 16, all being classified as AGNs based on the UV diagrams. This further confirms that these classification diagrams can be reliably used to separate star formation from AGN.
In the following, we examine how different models can explain the properties of the composite Sample B.
6.3.2 Mixed SF + AGN models
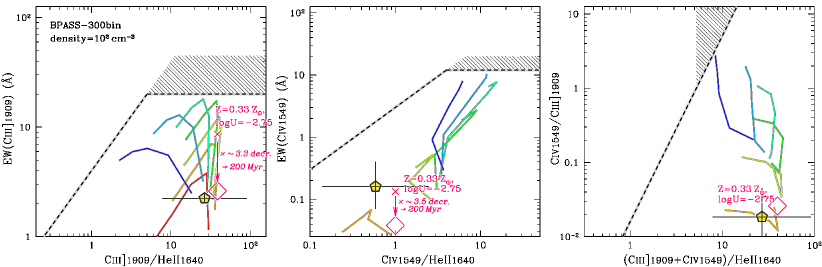
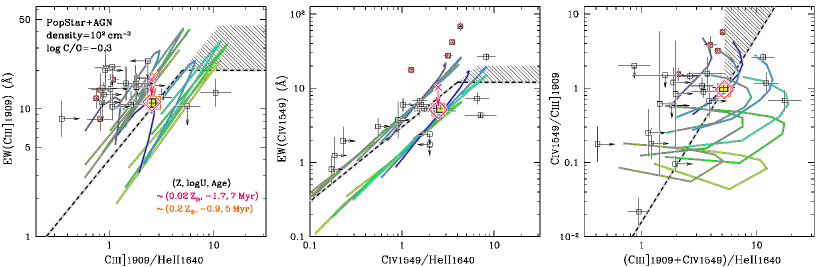
To infer the typical properties of Sample B, we reproduce the line ratios and EWs of the composite of Sample B with our models. Since the composite falls on the border between the star-forming galaxy and the AGN regions in Fig. 14, one simple interpretation of this population is that the shape of the incident radiation field is a combination of stellar population and AGN. Indeed, the measurements are reproduced by a hybrid model with an AGN contribution of , ISM properties of (, ) (, ), and the current star-formation age of Myr. We note that the AGN component becomes significant in the high-energy regime of eV. Adding the hard ionizing AGN spectrum to the stellar light implies that galaxies with a relatively strong Ciii] emission typically require a harder ionizing spectrum than produced by conventional stellar population synthesis codes. The binary stellar evolution might not be sufficient to fully reproduce these strong Ciii] emitters. If the SF AGN hybrid model is correct, a concern remains, however, as to whether such a high ionization parameter () is compatible with a relatively metal-enriched gaseous condition (). Previous studies have suggested that galaxies with typically have an ionization parameter of irrespective of redshift (e.g., Onodera et al. 2016; Kojima et al. 2017). If the best-fit parameters are correct, Sample B on average would have an ionization parameter higher than expected from the metallicity by nearly one order of magnitude. The presence of AGN could contribute to increase the ionization parameter for its metallicity. Other studies may be needed to further corroborate this result and interpretation. Another possible issue of the model is an underestimation of the flux of the O iii] doublet, which is not explicitly visible in the UV diagrams but is significantly detected in the composite spectrum (Le Fèvre et al., 2017). This indicates that the assumed CO ratio, given the measured oxygen abundance, may not be correct for the composite of Sample B, as it is for the default models (Sect. 3.3). This issue is revisited in Sect. 6.3.6.
6.3.3 Pure AGN models
If a pure AGN is assumed, a caution is that we should not correct for the stellar Civ absorption and the He ii emission for the observed line strength (Sect. 5). If we assume the observed Civ and He ii emission are entirely of nebular origin, the composite of Sample B would marginally fall in the AGN regime in the C4C3–C34 and EW(Ciii]) plots and become compatible with a faint () AGN model with ISM properties of (, ) (, ). However, the best-fit model predicts an EW(Civ) much larger than observed. Given the caution in Sect. 2.2 that EWs of our AGN models can be larger if the attenuation of UV-continuum by torus is more properly considered, the disagreement of the EW(Civ) (and possibly that of EW(Ciii])) would become much larger. Moreover, the composite of Sample B presents a Civ emission with a weak P-Cygni profile. We thus consider that Sample B should be dominated by a stellar population on average.
6.3.4 Pure SF models
Allowing for uncertainties in the corrections for the He ii and the Civ lines, there remains another possibility that the composite of Sample B could be explained by a pure star-formation model if the correction applied to He ii for the stellar contribution is too small. If the observed He ii emission is dominated by stellar emission ( %), Sample B could be reproduced by a binary stellar population with the ISM properties of () (, ) – (, ) and with a starburst age of less than a few Myr. Under this assumption, the stellar He ii emission would be Å. However such a large EW(He ii) is only expected from a stellar population with metallicities of and ages of Myr (Brinchmann et al., 2008); both of which are inconsistent with our estimations based on the UV diagrams. Therefore, we conclude that an ionizing field coming only from star formation is unlikely to explain the properties of this galaxy sample.
6.3.5 Blackbody SEDs
We explore blackbody spectra as an alternative explanation. Blackbodies with a high temperature could produce enough high-energy ionizing photons to explain the relatively strong He ii emission and the large EWs of Ciii] and Civ seen in Sample B. Indeed, a model with ISM properties of () = (, ) using a temperature of K could be consistent with the UV lines and EWs. However, as mentioned earlier, blackbody spectra may be unrealistic and hence predict large EWs due to their very high parameter, erg-1 Hz for K, which is much higher than typically found in high- galaxies ( erg-1 Hz ; Bouwens et al. 2016). This fit shows that Sample B could be explained with the properties above if such an efficient ionizing photon production is achieved. We note that values as high as erg-1 Hz can be reached in the BPASS 300bin models if the lowest metallicity () and the youngest starburst age ( Myr) are adopted. In this case one would need to invoke a significantly lower stellar metallicity compared to the gas phase value to mimic the blackbody case (cf. Steidel et al. 2016). Furthermore, we have indicated in Sect. 3.8 that a popIII-like stellar spectrum is approximated by a high-temperature blackbody. It could thus be claimed that Sample B has an extremely young stellar population, although it is unclear if such a population is associated with a relatively enriched () ISM condition.
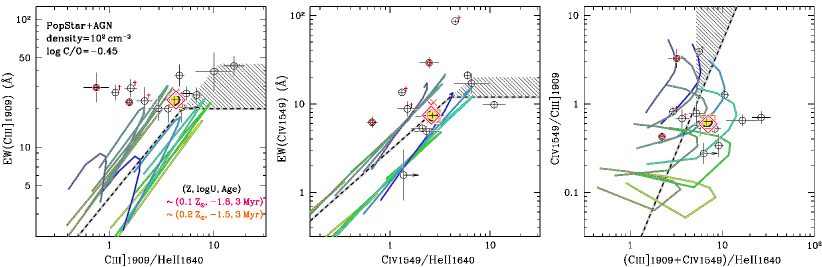
6.3.6 High CO abundance
One uncertainty in the above model fits is the CO abundance ratio. As mentioned in Sect. 3.3, the Ciii] and Civ EWs would be larger than predicted by the standard models if the sources turn out to be more carbon-enriched for their oxygen abundance. This could also affect the estimates of the ISM conditions. In order to assess this possibility, we use the method of Pèrez-Montero & Amorín (2017) to estimate the CO ratio from the (Ciii]Civ)O iii] ratio888See Eq. (7) of Pèrez-Montero & Amorín (2017). This equation could overestimate the CO abundance ratio for a metal-rich (), low-ionization parameter () galaxy. , for the composite of Sample B. We find a high ratio (Ciii]Civ)O iii] , which corresponds to an abundance ratio CO . which is usually found in chemically evolved galaxies (). Therefore, the high CO abundance ratio indicates that the sources of Sample B should have a solar metallicity or a higher carbon-to-oxygen abundance ratio than expected for its oxygen abundance.
To be more quantitative, we adopt the models with a fixed CO abundance ratio of CO instead of the lower values as detailed in Section 3.3 from the prescription of Dopita et al. (2006). Using models with the high CO abundance ratio, we find that the composite of Sample B is nicely explained by hybrid models combining star formation and AGN. The best-fit models include two different sets of ISM properties, one is a low- solution; (, , age, ) (, , Myr, ) – (, , Myr, ), and another is a high- one; (, , age, ) (, , Myr, ) – (, , Myr, ). Figure 16 shows the two best-fit models. We have also checked with our models that the (Ciii]Civ)O iii] ratio becomes as high as observed if the high CO ratio is adopted. Pure star formation would predict overly high carbon-to-helium line ratios, and adding an AGN is necessary to lower the ratios as seen in the composite spectrum. Although we do not have any definitive clue to determine which metallicity solutions are preferred, we consider the low- solution of more likely since it leads to a better agreement with the known – relation. If the best-fit model is correct, the CO abundance ratio is times higher than predicted by the relation of Dopita et al. (2006) for its low metallicity. The physical cause for the high CO abundance remains to be determined, and is briefly discussed below in Sect. 7.2.
6.3.7 Summary for intermediate-strength emitters EW(Ciii]) Å (Sample B)
In summary, the most likely interpretation of the composite of Sample B calls for a star-forming galaxy with a small contribution ( %) of an AGN-like hard ionizing radiation field, having an overabundance of carbon for its metal-poor condition (). However, the standard prescription of CO ratio as a function of metallicity could also reproduce the UV lines’ fluxes and EWs. The latter case requires an ionizing spectrum as hard, and an ionization parameter as high, as in the former case, but has a metallicity higher by an order of magnitude (). To reach a more definitive conclusion, we need further observations, especially of the rest frame-optical nebular emission lines, to confirm the ISM properties. The possible but more hypothetical blackbody model can be tested with the parameter, which will be directly estimated with the Hydrogen Balmer line luminosity as described in Sect. 6.4.2.
The above discussion is based on the composite of Sample B. As we note early in this Section, the sample contains a variety of objects with at least % nebular emission produced by a stellar ionizing spectrum. With our models, the likely star-forming galaxy population in this class is typically reproduced by a low-metallicity ( to , or could be smaller), high-ionization-parameter ( to ) model including binary stars. The age of the current star formation is predicted to be approximately Myr or shorter, and the parameter to be erg-1 Hz or as high as . This population is thus likely equivalent to the low- galaxy population selected by the Ciii]O iii] emission in VUDS (Amorín et al., 2017). Hence the sample could contain a variety of objects, including low-metallicity star-forming galaxies, pure AGNs, and objects with a hard ionizing spectrum reproduced by a mix of stars and AGN.
| Sample | Percentile | Input radiation | () | CO | Age (Myr) | (erg-1 Hz) | |
|---|---|---|---|---|---|---|---|
| A | % | pure AGN | – | – | – | – | – |
| % | PopStarAGN | ||||||
| (On average ) | () | ||||||
| B | % | pure AGN | – | – | – | – | – |
| % | BPASS 300bin | ||||||
| On average | PopStarAGN | ||||||
| ( – ) | or | ||||||
| C | On average | BPASS 300bin |
6.4 Strongest Ciii] emitters with EW(Ciii]) Å
Finally, we discuss the properties of Sample A whose Ciii] equivalent widths are larger than Å, and whose line properties are shown in Figs. 14 and 17.
6.4.1 Stars versus active galactic nuclei
As shown in Fig. 14 (or also Fig. 17) these sources occupy diverse areas in our SF–AGN diagnostic diagrams. Five sources, representing % of sample A, are consistently found in the AGN area of the three diagrams, suggesting a clear AGN classification. Of these five sources, two turn out to be detected in X-rays and identified as type-II AGN by Talia et al. (2017). The other three are highlighted with a red dagger in Fig. 17. Attention is now focused on the remaining % of sample A that are more puzzling. In the C4C3–C34 diagram on Fig. 17, all of them (i.e., black circles without a red diamond or a red dagger) fall in the star-formation region. On the other hand, all show an EW of Ciii] that exceeds the limit found by standard stellar population models, as well as an EW(Civ) exhibiting a similar behavior. The apparent inconsistency suggests that this small galaxy population has unusual properties regarding their incident radiation field and/or ISM condition.
We now explore the Cloudy models with the several different incident radiation fields as presented in Sect. 2 to constrain the nature of this sample. For this purpose we first use the median composite of the sample to investigate the detailed properties.
6.4.2 Blackbody models
Normal star-forming galaxies cannot have such a large EW(Ciii]) even with the binary stellar populations at the youngest starburst age of Myr. Pure AGNs are unlikely scenarios since the relatively weak He ii emission to the other metal lines is incompatible with any AGN model. Through the analyses using SFAGN, blackbody, and PopIII star as an incident radiation field, we find only one explanation for Sample A: the SED of a high-temperature blackbody. The blackbody model with K can reproduce the EWs and the flux line ratios with an ISM condition of (, ) = (, , ). Again, as discussed in Sect. 6.3.5, if the blackbody model were to give the best-fit to the UV spectrum, the objects in this sample would require a very high parameter ( erg-1 Hz ) plus a hard ionizing spectrum. However, it remains unclear if such an efficient ionizing photon production is achievable with stellar populations. In the study of Bouwens et al. (2016) a small number of galaxies is suggested to have a parameter as high as erg-1 Hz for the bluest galaxies. Even Ly emitters that are considered to present a strong Ciii] emission (cf. Stark et al. 2014; Rigby et al. 2015) possess a parameter reaching at maximum erg-1 Hz at (Nakajima et al., 2016). Although a higher would be expected for these galaxies if their escape fraction of ionizing photons was non-zero, potential local counterparts of high- galaxies, so called green pea galaxies, show a relatively modest parameter ( erg-1 Hz – ) after correction for the amount of escaped ionizing photons (Schaerer et al., 2016). In conclusion, sources with a very high ionizing photon production per UV luminosity ( erg-1 Hz ), corresponding to the blackbody spectrum which can explain Sample A, are not known so far and are difficult to justify theoretically.
6.4.3 High C/O abundance
An alternative explanation to reconcile the high EWs of Ciii] and Civ – indicative of AGNs – and the position in the C4C3–C34 diagram, which indicates stellar photoionization, is to invoke a high CO abundance, following the case of the individual source ID 5100565880 and possibly the composite of Sample B discussed earlier (Sects. 6.2 and 6.3.6). Using the (Ciii]Civ)O iii] ratio and the method of Pèrez-Montero & Amorín (2017) we estimate a typical CO ratio of this class of CO . With the relatively high CO ratio we re-analyze the composite through the several incident radiation fields, finding that the composite is reproduced by SF AGN models. The best-fit model has the ISM properties of (, , age) (, , Myr) – (, , Myr) with a fraction of AGN-like hard ionizing radiation field of . If the best fit model shown in Fig. 17 is correct, the CO ratio would be elevated by – dex compared with the standard models.
6.4.4 The nature of the strongest emitters in Sample A
The individual sources included in Sample A are also shown in Fig. 17. As mentioned earlier (Sect. 6.4.1), % of this sample are clearly identified as AGN. Interestingly, the other dominant population, which is represented by the median composite, shows only relatively little variety. Based on our method using the C4C3–C34 diagram, all of them are diagnosed as being star-forming galaxies, while their large EWs of Ciii] and Civ are incompatible with any standard model of star-formation. The most likely scenario for this puzzling but interesting population is that it is made of star-forming galaxies with a small contribution from an AGN-like hard ionizing radiation field. We derive the properties for the individual sources in the same manner as for the composite, finding that they require a radiation field made up of a mixture of a young stellar population plus an AGN component with – % and possess a moderately high CO ratio from CO to for their subsolar metal condition ( – ). These properties are well represented by the composite. A contribution from an AGN with a hard ionizing radiation field is necessary even for the objects that are not likely AGNs in the C4C3–C34 diagram.
7 Discussion
We have shown in Sect. 4 that the UV diagnostics proposed in Sect. 3 can distinguish AGN from star-formation-dominated galaxies, and that they can be used to constrain ISM properties of galaxies. We now discuss the properties of the Ciii] emitters from VUDS derived in Sect. 6, compare them with other studies at high redshift, and point out some implications.
7.1 The nature and physical properties of the Ciii] emitters in VUDS sample of star-forming galaxies
The main radiation field and ISM properties derived from the comparison of the UV emission lines with our grid of photoionization models are given in Table 4 for the three samples of Ciii] emitters defined above (cf. Table 2).
The composite spectrum of star-forming galaxies at , whose average Ciii] EW is approximately equal to 2 Å, is well described by stellar photoionization, as expected. We also suggest that adding binary stars (Stanway et al., 2015) is favored, as already pointed out by other studies (e.g., Steidel et al. 2016; Jaskot & Ravindranath 2016). The typical values inferred for the metallicity, ionization parameter, and age of the ionizing stellar population are (, , age) from (, , Myr) to (, , Myr). This is in agreement with earlier work (e.g., Steidel et al. 2014; Onodera et al. 2016 and references therein). Using EW(Ciii]) and the inferred ISM properties, we constrain the average efficiency of the ionizing photon production of this sample as erg-1 Hz – . The is higher than the canonical value usually assumed by typical models of reionization (; e.g., Robertson et al. 2013), but comparable to those of (bluer) Lyman break galaxy populations at (Bouwens et al., 2016). A revised relationship between UV slope and dust attenuation could elevate the canonical to reconcile the difference (Reddy et al., 2017).
Among the strong and intermediate Ciii] emitters (Samples A and B), approximately % are likely to be dominated by AGNs based on our UV diagnostics. Their average UV spectra indicate that the combination of a young stellar population and an AGN-like hard component is required for these strong Ciii] emitters. Furthermore, to fully explain the large EWs of Ciii] (and Civ) but faint O iii] emission, we suggest that the population typically has a high CO abundance ratio ( CO = and for samples A and B, respectively). With this assumption and a hard stellar AGN SED, we are able to reproduce the average UV observations. The inferred ISM properties are (, ) (, ) or (, ) for sample B, and ( – , to ) for sample A. Since the EW of Ciii] peaks for metallicities of , the selection of objects by strong Ciii] emission should result in a population with a subsolar metallicity (with a boost of CO, whose origin is discussed in Sect. 7.2). In this sense, Sample B covering weaker Ciii] emitters could contain galaxies that are less chemically enriched than Sample A. The large EW(Ciii])s indicate a young starburst age of – Myr and an efficient ionizing photon production of erg-1 Hz – for Samples A and B, as high as those observed in the bluest population of continuum-selected galaxies (Bouwens et al., 2016), LAEs (Nakajima et al., 2016), and galaxies at (Stark et al. 2017; Sect. 7.3). As shown in Le Fèvre et al. (2017), galaxies in the A and B samples overall show a smaller SFR than expected for their stellar mass compared to the main sequence of star-forming galaxies. This could be interpreted as a sign of feedback from the AGN component which suppresses surrounding star-formation (Le Fèvre et al., 2017), further reinforcing the analysis presented here.
The presence of an AGN-like hard radiation field can change the ISM properties derived from the UV high-ionization lines. Reexamining the VUDS sample of Ciii]O iii] emitters presented by Amorín et al. (2017), we find that three out of the ten Ciii] emitters could be partly powered by AGN. The stellar AGN hybrid models can reproduce their UV line spectra with metallicities by a factor of – higher than originally inferred, although we cannot fully rule out the low-metallicity solution for one of the three objects. If such high metallicities are considered, these objects would lie on (a simple extrapolation of) the mass-metallicity relation previously reported at similar redshifts (; e.g., Steidel et al. 2014). Although we require the observations of rest-frame optical emission lines to draw a firm conclusion, our study shows that a careful investigation of the powering source is essential for understanding the evolution of the ISM gaseous properties, particularly when only the UV high-ionization lines (and complicated Ly) are available.
7.2 On the origin of high CO abundance ratios
If the high CO abundance inferred for the intermediate and strong Ciii] emitters is correct as reported in Sects. 6.3.6 and 6.4.3, what is its physical origin? Generally, solar CO ratios are observed (e.g., Dopita et al. 2006) and predicted by chemical evolution models (e.g., Mattsson 2010) at high metallicities ( Z⊙). The trend of the increasing CO with metallicity at is usually explained with a delayed contribution to carbon enrichment from low- and intermediate-mass (i.e., longer-lived) stars along with metal-rich (PopI) massive stars. At very low metallicities, fast rotating stars are also predicted to produce yields with a high CO ratio (cf. Chiappini, 2006). However, this behavior is only expected for metallicities , which is significantly lower than the estimated metallicities of the star-forming galaxies at in our sample. Asymptotic giant branch (AGB) stars of intermediate mass, which could contribute to chemical enrichment on the relatively short timescales appropriate for these high-redshift sources, do not produce Carbon, since they are predicted to undergo hot bottom burning, which in fact destroys this element (Marigo, 2001). Only under special circumstances may this phase be avoided and high CO ratios be reached (Marigo, 2007). From these available nucleosynthesis predictions for single stars it appears therefore difficult to explain a solar or super-solar CO abundance ratio at the subsolar metallicities in the galaxies we are observing.
Alternatively, because both carbon and nitrogen are secondary nucleosynthesis elements at high metallicity, these apparent over-abundances at low metallicity (i.e., low OH ratio) could be due to a massive inflow of pristine gas into the system. This event would lower the OH ratio for a chemically evolved system but not alter the CO and NO ratios, resulting in apparent over-abundances of secondary nucleosynthetic elements of nitrogen and carbon for its metallicity. A similar idea has been suggested for explaining a nitrogen excess as the origin of the offset seen in the BPT diagram in high- star-forming galaxies (e.g., Sanders et al. 2016 and references therein) and their low- analogs (e.g., Amorín et al. 2010). If this scenario were correct, the VUDS intermediate and strong Ciii]-emitter samples would contain galaxies that are experiencing such a massive inflow and undergoing a burst of star formation. Moreover, incomplete metal mixing in the system might leave some pockets of pristine gas in which PopIII stars could form. The PopIII stellar population, comprising a small fraction of the total star-formation activity, could explain narrow He ii-line emitters (Cassata et al. 2013; see also Schaerer 2003; Raiter et al. 2010) as well as the hard ionizing spectra as suggested for the VUDS intermediate and strong Ciii]-emitter samples.
Furthermore, a significant population of carbon-sequence W-R (WC) stars could eject carbon into the ISM, leading to the observed enhancement of the CO abundance. This was also initially introduced to explain a possible cause of the nitrogen enhancement in galaxies with nitrogen-sequence W-R (WN) stars (e.g., Masters et al. 2014 and references therein). However, we consider this scenario unlikely, because (i) the fraction of massive stars entering the W-R phase becomes small in a low-metallicity regime, and because (ii) the W-R population is dominated by WN stars in a metal-poor ISM environment (e.g., Crowther 2007).
We can test these scenarios by examining the CN abundance ratio as a function of metallicity, for example. A further discussion of the possible variation of the CO abundance ratio in high- objects will be presented elsewhere using our VUDS sample (Amorín et al. in prep. 2017). In any case, we emphasize that the objects potentially possessing a very high CO ratio are quite rare in the large VUDS sample, thus only rarely requiring such extraordinary explanations.
7.3 Comparison with other high-redshift sources
7.3.1 The Lynx arc at
Interestingly, we note that the Lynx arc at (Fosbury et al., 2003; Villar-Martín et al., 2004) presents similar UV spectroscopic properties to the strongest Ciii]-emitter sample from VUDS, with very large EWs of Ciii] and Civ ( Å)999 We calculate the EWs by using the given fluxes and the continuum flux densities, which are estimated from the SED plot (Fosbury et al., 2003). . However, line ratios place this object in the star-formation regime on the C4C3-C34 diagram (blue circle in Figs. 11 and 14). Its rest-frame optical nebular spectrum suggests an ISM condition of a high-ionization parameter () and a low metallicity (). The presence of an AGN is not required according to Fosbury et al. (2003) and Villar-Martín et al. (2004), although Binette et al. (2003) show that AGN models with an absorbed power-law distribution are able to reproduce the UV-to-optical line spectrum. We thus need a relatively high CO abundance ratio to explain the large EWs of Ciii] and Civ for this object. Indeed, is inferred using the method of Pèrez-Montero & Amorín (2017). Furthermore, a high NO abundance ratio is suggested for this object by a factor of – compared with the solar abundance (Villar-Martín et al., 2004).
7.3.2 Recent Ciii] detections at high redshift
Stark et al. (2014) have reported Ciii] emission in 16 lensed galaxies. Five of them also show Civ, which is weaker than Ciii], as we would expect. When possible these sources have been included in the relevant Figures discussed above. For three sources with multiple line detections, Stark et al. (2014) determine metallicities from their complex photoionization modeling including a Bayesian analysis, finding with relatively large uncertainties (see Fig. 13). The comparison with our models shows that the observed line strengths of their Ciii] emitters can be reproduced with the ionization field of star-forming galaxies, either from PopStar or BPASS models. This is in agreement with the conclusions of Stark et al. (2014).
A more peculiar source, named A383-5.2 with strong Ciii] emission (EW(Ciii]) Å), was found at by Stark et al. (2015a). Fitting only one UV line plus the broad-band SED of this galaxy, Stark et al. (2015a) determine a very low-metallicity , a high ionization parameter, and a relatively high CO abundance for its low metallicity. In addition, Stark et al. (2017) recently report another Ciii] detection with a large EW of Å from a luminous high- source, EGS-zs8-1, at . The ISM properties including the CO ratio are inferred to be quite similar to those of A383-5.2. Whether these explanations are unique remains, however, questionable. If the metallicity is correct, it places these sources in a very similar location as some sources of Amorín et al. (2017), as seen from Fig. 13. From this consideration and from the resemblance of these sources to those from our intermediate and strong Ciii]-emitter sample, we suspect that these high- sources could also be enriched in Carbon. More data are needed to better constrain these sources.
7.3.3 Civ emitters at –
Recent spectroscopic observations of galaxies at redshift have identified strong Civ emission with rest-frame EW Å or larger (Stark et al. 2015b; Schmidt et al. 2017; Mainali et al. 2017; Fig. 14). If these objects are powered by star formation, their high Civ EWs cannot be reproduced by conventional binary or single stellar populations, as demonstrated above. This suggests that these early galaxies possess a much harder ionizing spectrum, a more efficient ionizing photon production (i.e., a higher parameter), and/or an elevated CO abundance ratio. Although no evidence for AGN has so far been found for these objects, we cannot fully rule out an AGN-powering radiation field with a weak upper-limit on the He ii emission. For example, Schmidt et al. (2017) discuss the ionizing source of a object using the AGN models of Feltre et al. (2016) and galaxy models of Gutkin et al. (2016) on the line ratios diagrams of CivCiii] and CivHe ii, concluding that the object does not favor an AGN. We think the situation is unclear. It is true that their emission line limit of CivHe ii is consistent with many of the star-forming galaxy models and with only a small number of AGN models. However, most of the observed AGNs are reproduced by the “minority” of the AGN models, with line ratios of CivHe ii – (see top-right panel of Fig. 11; Nagao et al. 2006; Dors et al. 2014; Hainline et al. 2011). Since the AGN models of Feltre et al. (2016) are based on a large grid of parameter sets, some of which might be unrealistic, comparing an observation with the abundance of the generated models to judge its ionizing source could be misleading. For this particular example of a object, Mainali et al. (2017) provide a stronger constraint on the CivHe ii ratio of , leading to the conclusion that the source is powered by star formation.
A lensed Ly emitter at showing strong Civ emission with EW(Civ) 40 Å was discovered by Stark et al. (2015b). Again, using the models mentioned above, they derive a very low metallicity () and a high ionizing photon flux. The assumed or derived CO abundance is not mentioned. According to Stark et al. (2015b) this source can be explained by stellar photoionization or by an AGN. From our modeling we do not see how such a high Civ EW could be reproduced without a significant CO overabundance, that is, close to solar value, in case of stellar photoionization. Alternatively, we agree that an AGN-like hard spectrum could explain the currently available observations. In fact the properties of this source resemble those of some of our strongest Ciii] emitters (Sample A), whose nature, including an AGN-powered source of ionizing photons, was discussed above.
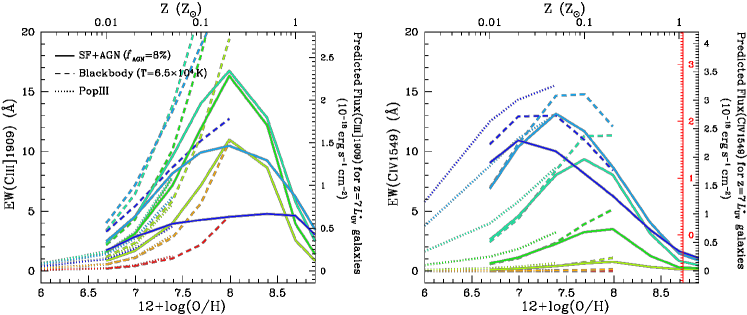
Since Civ line photons can be trapped in the ionized nebular regions by resonant scattering, they would be preferentially absorbed and weakened if internal dust existed. Strong Civ emission is thus likely to be observed from young, dust-free sources. Indeed, at , low-mass () young galaxies and super star clusters with a blue UV continuum (UV slope ) are observed using strong-lensing effect to present strong Civ emission of EW Å (Vanzella et al., 2016, 2017; Smit et al., 2017). The Civ emitters found at higher- (Stark et al., 2015b; Mainali et al., 2017) would be a similarly dust-free population if the main ionizing sources were stars.
7.4 Implications
Finally, we discuss the possibility of using the Ciii] and/or Civ as a probe of galaxies in the early universe. First, we revisit the claimed positive correlation between EW(Ly) and EW(Ciii]) (Shapley et al., 2003; Stark et al., 2014; Rigby et al., 2015). Rigby et al. (2015) suggest that the correlation is dominated by the strongest emitters with EW(Ly) Å and EW(Ciii]) Å. The correlation looks weaker in the range below EW(Ly) Å. Our models corroborate these trends. One of the key quantities that govern the correlation is the UV-continuum level, or the star-formation age. We demonstrated in Sect. 4.2 that strong Ciii] emitters require a very young starburst age to have a large EW(Ciii]). In the early phase of the current starburst, galaxies should have a large EW(Ly) as well. If galaxies are more evolved, that is, if the metallicity and age become increased, both of the EWs of Ly and Ciii] become smaller. In addition, in the evolved system, radiative transfer effects on Ly complicate the Ly visibility. In the correlation of Rigby et al. (2015), there are several galaxies that present a modest Ciii] emission (EW Å) while no Ly in emission. This would indicate that these galaxies have more dust extinction, which preferentially absorbs the resonantly-scattered Ly photons due to their relatively long mean free paths. Alternatively, a scatter in the CO abundance ratio as a function of metallicity could add another uncertainty (cf. Sect. 4.2). Such complexities would result in the weaker correlation in the range of EW(Ly) Å as suggested by Rigby et al. (2015).
We can also speculate on the relationship between EWs of Ly and Ciii] for much stronger emitters, that is, in the range of EW(Ly) Å. If we assume such a strong Ly is emitted by a very young galaxy with intense bursts of star formation, a key property is the hardness of the incident radiation field to further enhance the EW(Ly). Based on our models that assume the gas-phase and stellar metallicities are the same, a more metal-poor galaxy tends to have a harder ionizing spectrum and a higher . Therefore, the EW(Ly) is considered to monotonically increase with decreasing metallicity. On the other hand, as we present in Fig. 13, the EW(Ciii]) becomes smaller with decreasing metallicity below due to a smaller amount of carbon. We thus predict that the positive correlation between EW(Ly) and EW(Ciii]) becomes weaker in the range of EW(Ly) Å, and that EW(Ciii]) could even start to drop with EW(Ly). Indeed, Le Fèvre et al. (2017) use a large sample of Ciii] emitters to find that these objects are not always strong Ly emitters, and vice versa. Although their plot might be contaminated by Ciii] emitters powered by a hidden AGN, the positive correlation is suggested to not be as strong as previously thought. More Ciii] observations for strong Ly emitters will clarify that trend.
Figure 18 presents our model predictions of the EWs of Ciii] and Civ as a function of metallicity if the radiation field is given by the mix of SF AGN (), by a blackbody ( K), or by a PopIII star. The former two are favored to reproduce our strong and intermediately strong Ciii] emitters. Here we adopt the “standard” assumption of the CO abundance ratio (Dopita et al., 2006). All of these models are considered to be at a very young star-formation age: Myr for the SF AGN models, and zero-age for the blackbody and PopIII star models. Compared with the BPASS binary-star models in Fig. 13, the SF AGN models present a similar trend of EWs with metallicity. The SF AGN models have a peak of EW(Ciii]) at , predicting a lower EW with higher and lower metallicities. EW(Civ) is predicted to have a peak at a somewhat lower metallicity of . These trends are well reproduced and extrapolated to a lower metallicity regime with the blackbody and PopIII star models. Therefore, it is likely that these models enable us to make a firm prediction of the EWs of Ciii] and Civ in the low-metallicity regime, where high- galaxies in the reionization era should lie.
In order to evaluate the detectability of the carbon lines from early galaxies, we estimate typical fluxes of these lines from galaxies at for reference. An galaxy at has an absolute UV magnitude of (Bouwens et al., 2015). Using this UV continuum level and assuming a flat in the FUV range, we derive fluxes of Ciii] and Civ predicted for galaxies at as shown in the right ordinate of each panel in Fig. 18. One suggestion we obtain is that at a low metallicity regime of , the Civ emission looks stronger, and therefore appears to be a more prominent probe than the Ciii] emission if a high-ionization parameter is associated with the low metallicity (). Such low metallicity is considered to be likely, since brighter (and more evolved) galaxies at are suggested to have (Stark et al., 2017). We thus focus on the metallicity range of here. If the metallicity is , both of the EWs could be as large as Å, which corresponds to and erg s-1 cm-2 in fluxes of Ciii] and Civ, respectively. These are obtainable with currently available ground-based instruments such as Keck/MOSFIRE within a reasonable amount of time of a few hours on-source integration, given the typical sensitivity provided by Steidel et al. (2014). If a lower metallicity of is considered, the maximum EW of Ciii] drops to Å, while that of EW(Civ) remains as large as Å. In this case, the predicted flux of Ciii] and Civ is and erg s-1 cm-2, respectively. Therefore, for such a metal-poor galaxy, Civ is considered to provide a better probe for its identification. Although the observed Civ emission might become weaker if the stellar absorption exists, our calculation suggests that the stellar absorption of EWabs(Civ) Å, which we adopt for the VUDS sample, does not significantly decrease the visibility of the Civ emission (cf. red ordinate in the right panel of Fig. 18).
However, we need to acknowledge some caveats. One is that these calculations are for galaxies at . The predicted fluxes would be decreased by for sub- galaxies. Another difficulty is that we cannot simply state that brighter galaxies present stronger carbon emission lines, because the EWs presented in Fig. 18 assume a very young starburst age. If brighter galaxies were more evolved, their EWs would become lower as shown in Fig. 6. Indeed, Shibuya et al. (2017) argue a tentative101010 Since the anti-correlation is dominated by strong Civ emitters with EW Å, which our standard models cannot explain, it is not obvious whether the correlation is universally correct or not. anti-correlation between EW(Civ) and UV-continuum luminosity. This suggests that a less luminous galaxy tends to be younger, less chemically enriched (and hence to have a higher ionization parameter), and have a harder ionizing spectrum. Finally, the absolute strengths of the Carbon emission would become stronger if the CO ratio was enhanced. An analysis of multiple UV lines such as the one we perform with the VUDS Ciii] emitters, ideally including the O iii] doublet, is preferred for resolving the degeneracy. Such studies should be possible for high-redshift () galaxies from the ground with NIR spectrographs and using the upcoming James Webb Space Telescope (JWST).
8 Summary and conclusions
In order to interpret the observed UV spectra of distant galaxies, we present the theoretical predictions for the behavior of the UV emission, in particular of Ciii], Civ, and He ii lines, from extensive grids of photoionization models. The models use several incident radiation fields (stellar population, AGNs, a mixture of stars and AGNs, and so on) and cover a wide range of ISM properties. We have tested these models on existing sources with known ionization field and/or ISM properties. Our main results concerning the UV emission line predictions are summarized as follows.
-
•
From the photoionization models we propose new spectral UV line diagnostics using rest-frame EWs of Ciii] and Civ and the line ratios of Ciii], Civ, and He ii. Extending earlier predictions for UV lines (e.g., Feltre et al., 2016; Gutkin et al., 2016; Jaskot & Ravindranath, 2016), we demonstrate that the UV diagrams of CivCiii] versus (Ciii]Civ)He ii, EW(Ciii]) versus Ciii]He ii, and EW(Civ) versus CivHe ii are useful for classifying the nature of the ionizing radiation field of galaxies and for constraining their ISM properties.
-
•
For star-forming galaxies, our models predict that Ciii] EW peaks at subsolar metallicities ( Z⊙), whereas Civ EW becomes maximal at even lower metallicities. Standard models show that sources with EW(Ciii]) Å and EW(Civ) Å cannot be explained by purely stellar photoionization: an enhanced carbon abundance (with CO up to solar) or an AGN-like ionizing spectrum is needed to explain such sources.
Subsequently, we used these models and UV diagnostic diagrams to analyze new spectroscopic observations from the VIMOS Ultra Deep Survey (VUDS). Le Fèvre et al. (2017) identify Ciii]-emitting galaxies at in VUDS. We binned the sources in three categories, according to strong (Sample A) and intermediate (Sample B) EW(Ciii]), and a reference sample, Sample (C), of all star-forming galaxies. The average properties of the three samples are the following:
-
•
All star-forming galaxies (Sample C; sources; EW(Ciii]) Å): We find that they typically require a stellar photoionization including binary stars. Using the incident radiation field generated by BPASS (Stanway et al., 2015), the ISM properties of metallicity () and ionization parameter () are inferred to be (, ) from (, ) to (, ), and the age of the current star formation to be from Myr to Myr. The ionizing photon production efficiency parameterized by is calculated to be erg-1 Hz – .
-
•
Intermediate Ciii] emitters (Sample B; ; EW(Ciii]) – Å): We suggest the sample contains a variety of objects, at least % of which are metal-poor ( – ) star-forming galaxies and % are pure AGNs. A pure stellar photoionization is insufficient to explain their average UV observations, irrespective of the inclusion of binary stars. They are best described by an SED including a mix of stellar AGN photoionization with a contribution of – % of the ionizing photons from the AGN. Furthermore, to fully explain the large EWs of Ciii] and Civ but faint O iii] emission, we indicate that the population typically requires a high CO abundance ratio ( CO ). With these conditions, the ISM properties are best inferred as (, ) (, ) or (, ). A young starburst age of Myr and an efficient ionizing photon production of erg-1 Hz are derived.
-
•
Strong Ciii] emitters (Sample A; ; EW(Ciii]) Å): With the UV diagrams we classify % of the sample as AGNs. We find that stellar photoionization is clearly insufficient to explain the UV observation of the average and the other % dominant population. A radiation field consisting of a mixture of a young stellar population ( erg-1 Hz – ) plus an AGN component with % is necessary. Furthermore, an enhanced CO ratio ( CO ) is needed for ISM properties of (, ) from (, ) to (, ).
The analyses of the VUDS Ciii] emitters have provided the following discussion for the high- star-forming population:
-
•
Since the EW of Ciii] peaks for metallicities of , the selection of objects by strong Ciii] emission should result in a population with a subsolar metallicity. A young starburst age of Myr and a high ionizing photon production efficiency of erg-1 Hz are required for the strong Ciii] emission of EW(Ciii]) Å.
-
•
The possible addition of AGN to the ionizing spectrum indicates that the shape of stellar ionizing spectrum in the very high-energy regime might not be sufficiently reproduced by conventional stellar population synthesis codes. If the inclusion of an AGN-like hard radiation field is correct for the strong Ciii] emitters, this could alter the ISM properties that are estimated with the UV high ionization lines alone under the assumption of a pure stellar photoionization.
-
•
Using the ionizing spectrum as inferred for the VUDS intermediate and strong Ciii] emitters, we offer a prospect of the visibility of the Ciii] and Civ emission from galaxies in the reionization epoch of . We predict that both Ciii] and Civ could be equally as strong as EW Å and detectable with currently available instruments from galaxies if the metallicity is subsolar. If these galaxies are more metal-poor by an order of magnitude, the maximum EW of Ciii] would drop to Å, while that of Civ would remain as large as Å. In a metal-poor environment, Civ would provide a better probe of objects in the early universe.
This paper presents a useful means to identify the main source of ionizing photons in distant galaxies based on UV rest-frame emission lines. This will be further improved, including the addition of a full suite of emission lines over the rest-frame UVoptical wavelength range. The methods presented in this paper provide useful analysis and classification tools to study the properties of galaxies with the upcoming JWST, with future extended large spectroscopic surveys such as Subaru/PFS (Takada et al., 2014) or VLT/MOONS (Cirasuolo et al., 2014), and m-class telescopes.
Acknowledgements.
This work is supported by funding from the European Research Council Advanced Grant ERC–2010–AdG–268107–EARLY and by INAF Grants PRIN 2010, PRIN 2012 and PICS 2013. K.N. acknowledges the JSPS Overseas Research Fellowships, and R.A. acknowledges support from the ERC Advanced Grant 695671 ‘QUENCH’. This work is based on data products made available at the CESAM data center, Laboratoire d’Astrophysique de Marseille.References
- Allen et al. (2008) Allen, M. G., Groves, B. A., Dopita, M. A., Sutherland, R. S., & Kewley, L. J. 2008, ApJS, 178, 20 Amorín, R. O., Pérez-Montero, E., & Vílchez, J. M. 2010, ApJL, 715, L128
- Amorín et al. (2010) Amorín, R. O., Pérez-Montero, E., & Vílchez, J. M. 2010, ApJL, 715, L128
- Amorín et al. (2017) Amorín, et al. 2017, NatAs, 1, 0052
- Asplund et al. (2009) Asplund, M., Grevesse, N., Sauval, A. J., & Scott, P. 2009, ARA&A, 47, 481
- Baldwin et al. (1981) Baldwin, J. A., Phillips, M. M., & Terlevich, R. 1981, PASP, 93, 5
- Bayliss et al. (2014) Bayliss, M. B., et al. 2014, ApJ, 790, 144
- Berg et al. (2016) Berg, D. A., Skillman, E. D., Henry, R. B. C., Erb, D. K., & Carigi, L. 2016, ApJ, 827, 126
- Binette et al. (2003) Binette, L., Groves, B., Villar-Martín, M., Fosbury, R. A. E., & Axon, D. J. 2003, A&A, 405, 975
- Bouwens et al. (2015) Bouwens, R. J., et al. 2015, ApJ, 803, 34
- Bouwens et al. (2016) Bouwens, R. J., et al. 2016, ApJ, 831, 176
- Brinchmann et al. (2004) Brinchmann, J., Charlot, S., White, S. D. M., et al. 2004, MNRAS, 351, 1151
- Brinchmann et al. (2008) Brinchmann, J., Pettini, M., & Charlot, S. 2008, MNRAS, 385, 769
- Cassata et al. (2013) Cassata, P., et al. 2013, A&A, 556, A68
- Cassata et al. (2015) Cassata, P., et al. 2015, A&A, 573, A24
- Chabrier (2003) Chabrier, G. 2003, PASP, 115, 763
- Chiappini (2006) Chiappini, C., Hirschi, R., Meynet, G., Ekström, S., Maeder, A., & Matteucci, F. 2006, A&A, 449, 27
- Christensen et al. (2012) Christensen, L., et al. 2012, MNRAS, 427, 1953
- Cirasuolo et al. (2014) Cirasuolo, M., et al. 2014, Proc. SPIE, 9147, 91470N
- Crowther (2007) Crowther, P. A. 2007, ARA&A, 45, 177 Cresci, G., Mannucci, F., Sommariva, V., Maiolino, R., Marconi, A., Brusa, M., 2012, MNRAS, 421, 262
- Crowther (2016) Crowther, P. A., et al. 2016, MNRAS, 458, 624
- de Barros et al. (2016) de Barros, S., et al. 2016, A&A, 585, A51
- Dopita et al. (2006) Dopita, M. A., et al. 2006, ApJS, 167, 177
- Dors et al. (2014) Dors, O. L., Jr, Cardaci, M. V., Hägele, G. F., & Krabbe, Â. C. 2014, MNRAS, 443, 1291
- Elvis et al. (1994) Elvis, M., et al. 1993, ApJS, 95, 1
- Elvis et al. (2002) Elvis, M., Risaliti, G., & Zamorani, G. 2002, ApJL, 565, L75
- Erb et al. (2010) Erb, D. K., Pettini, M., Shapley, A. E., Steidel, C. C., Law, D. R., Reddy, N. A., 2010, ApJ, 719, 1168
- Fan et al. (2006) Fan, X., Carilli, C. L., & Keating, B. 2006, ARA&A, 44, 415
- Feltre et al. (2016) Feltre, A., Charlot, S., & Gutkin, J. 2016, MNRAS, 456, 3354
- Ferland et al. (1998) Ferland, G. J., et al. 1998, PASP, 110, 761
- Ferland et al. (2013) Ferland, G. J., et al. 2013, RMxAA, 49, 137
- Fosbury et al. (2003) Fosbury, R. A. E., et al. 2003, ApJ, 596, 797
- Förster Schreiber et al. (2009) Förster Schreiber et al. 2009, ApJ, 706, 1364
- Francis et al. (1993) Francis, P. J., Hooper, E. J., & Impey, C. D. 1993, AJ, 106, 417
- Garnett et al. (1995) Garnett, D. R., et al. 1995, ApJ, 443, 64
- Gordon et al. (2003) Gordon, K. D., Clayton, G. C., Misselt, K. A., Landolt, A. U., & Wolff, M. J. 2003, ApJ, 594, 279
- Gutkin et al. (2016) Gutkin, J., Charlot, S., & Bruzual, G. 2016, MNRAS, 462, 1757
- Hainline et al. (2011) Hainline, K. N., Shapley, A. E., Greene, J. E., & Steidel, C. C. 2011, ApJ, 733, 31
- Hathi et al. (2016) Hathi, N. P., et al. 2016, A&A, 588, A26
- Heckman et al. (2011) Heckman, T. M., et al. 2011, ApJ, 730, 5
- Jaskot & Oey (2013) Jaskot, A. E. & Oey, M. S. 2013, ApJ, 766, 91
- Jaskot & Ravindranath (2016) Jaskot, A. E. & Ravindranath, S. 2016, ApJ, 833, 136
- Kauffmann et al. (2003) Kauffmann, et al. 2003, MNRAS, 346, 1055
- Kennicutt (1998) Kennicutt, R. C., Jr., 1998, ARA&A, 36, 189
- Kewley et al. (2001) Kewley, L. J., Dopita, M. A., Sutherland, R. S., Heisler, C. A., & Trevena, J. 2001, ApJ, 556, 121
- Kewley & Dopita (2002) Kewley, L. J. & Dopita, M. A. 2002, ApJS, 142, 35
- Kewley et al. (2006) Kewley, L. J., Groves, B., Kauffmann, G., & Heckman, T. 2006, MNRAS, 372, 961
- Kewley et al. (2013) Kewley, L. J., et al. 2013, ApJ, 774, 100
- Kojima et al. (2017) Kojima, T., Ouchi, M., Nakajima, K., et al. 2017, PASJ in press, arXiv e-prints, arXiv:1605.03436
- Konno et al. (2014) Konno, A., Ouchi, M., Ono, M., et al. 2014, ApJ, 797, 16
- Kroupa (2001) Kroupa, P. 2001, MNRAS, 322, 231
- Laporte et al. (2017) Laporte, N., Nakajima, K., Ellis, R. S., Zitrin, A., Stark, D. P., Mainali, R., & Roberts-Borsani, G. 2017, arXiv e-prints, arXiv:1708.05173
- Le Fèvre et al. (2015) Le Fèvre, O., et al. 2015, A&A, 576, A79
- Le Fèvre et al. (2017) Le Fèvre, O., et al. 2017, arXiv e-prints, arXiv:1710.10715
- López-Sánchez et al. (2012) López-Sánchez, Á. R., Dopita, M. A., Kewley, L. J., Zahid, H. J., Nicholls, D. C., & Scharwächter, J. 2012, MNRAS, 426, 2630
- Mainali et al. (2017) Mainali, R., et al., 2017, ApJL, 836, L14
- Masters et al. (2014) Masters, D., et al. 2014, ApJ, 785, 153
- Mattsson (2010) Mattsson, L. 2010, A&A, 515, A68
- Mannucci et al. (2009) Mannucci, F., et al. 2009, MNRAS, 398, 1915
- Marigo (2001) Marigo, P. 2001, A&A, 370, 194
- Marigo (2007) Marigo, P. 2007, A&A, 467, 1139
- Mollá et al. (2009) Mollá, M., García-Vargas, M. L., & Bressan, A. 2009, MNRAS, 398, 451
- Nagao et al. (2006) Nagao, T., Maiolino, & R., Marconi, A. 2006, A&A, 447, 863
- Nagao et al. (2011) Nagao, T., Maiolino, R., Marconi, A., & Matsuhara, H. 2011, A&A, 526, 149
- Nakajima & Ouchi (2014) Nakajima, K. & Ouchi, M. 2014, MNRAS, 442, 900
- Nakajima et al. (2016) Nakajima, K., Ellis, R. S., I. Iwata, et al. 2016, ApJL, 831, L9
- Onodera et al. (2016) Onodera M., et al. 2016, ApJ, 822, 42
- Pagel et al. (1979) Pagel, B. E. J., Edmunds, M. G., Blackwell, D. E., Chun, M. S., & Smith, G. 1979, MNRAS, 189, 95
- Pentericci et al. (2014) Pentericci, L., et al. 2014, ApJ, 793, 113
- Pettini & Pagel (2004) Pettini, M. & Pagel, B. E. J. 2004, MNRAS, 348, L59
- Pèrez-Montero & Amorín (2017) Pèrez-Montero, E. & Amorín, R. 2017, MNRAS, 467, 1287
- Raiter et al. (2010) Raiter, A., Schaerer, D., & Fosbury, R. A. E. 2010, A&A, 523, 64
- Ranalli et al. (2003) Ranalli, P., Comastri, A., & Setti, G. 2003, A&A, 399, 39
- Reddy et al. (2010) Reddy, N. A., et al. 2010, ApJ, 712, 1070
- Reddy et al. (2015) Reddy, N. A., et al. 2015, ApJ, 806, 259
- Reddy et al. (2017) Reddy, N. A., et al. 2017, arXiv e-prints, arXiv:1705.09302
- Rigby et al. (2015) Rigby, J. R., et al. 2015, ApJL, 814, L6
- Robertson et al. (2013) Robertson, B. E., et al. 2013, ApJ, 768, 71
- Salpeter (1955) Salpeter, E. E. 1955, ApJ, 121, 161
- Sanders et al. (2016) Sanders, R. L., et al. 2016, ApJ, 816, 23
- Schaerer (2003) Schaerer, D. 2003, A&A, 397, 527
- Schaerer et al. (2016) Schaerer, D., et al. 2016, A&A, 591, L8
- Schenker et al. (2014) Schenker, M. A., Ellis, R. S., Konidaris, N. P., & Stark, D. P. 2014, ApJ, 795, 20
- Schmidt et al. (2017) Schmidt, K. B., et al. 2017, ApJ, 839, 17
- Senchyna et al. (2017) Senchyna, P., et al. 2017, arXiv e-prints, arXiv:1706.000881
- Shapley et al. (2003) Shapley, A. E., Steidel, C. C., Pettini, M., & Adelberger, K. L. 2003, ApJ, 588, 65
- Shibuya et al. (2017) Shibuya, T., et al. 2017, arXiv e-prints, arXiv:1705.00733
- Smit et al. (2017) Smit, R., Swinbank, A, M., Massey, R., Richard, J., Smail, I., & Kneib, J. -P. 2017, MNRAS, 467, 3306
- Stanway et al. (2015) Stanway, E. R., Eldridge, J. J. & Becker, G. D. 2015, MNRAS, 456, 485
- Stanway (2017) Stanway, E. R. 2017, the Proceedings of IAU Symposium 329: “The Lives and Death Throws of Massive Stars”, arXiv e-prints, arXiv:1702.07303
- Stark et al. (2011) Stark, D. P., Ellis, R. S., & Ouchi, M. 2011, ApJ, 728, L2
- Stark et al. (2014) Stark, D. P., et al. 2014, MNRAS, 445, 3200
- Stark et al. (2015a) Stark, D. P., et al. 2015a, MNRAS, 450, 1846
- Stark et al. (2015b) Stark, D. P., et al. 2015b, MNRAS, 454, 1393
- Stark et al. (2017) Stark, D. P., et al. 2017, MNRAS, 464, 469
- Stasińska et al. (2015) Stasińska, G., Izotov, Y., Morisset, C., & Guseva, N. 2015, A&A, 576, 83
- Steidel et al. (2002) Steidel, C. C., et al., 2002, ApJ, 576, 653
- Steidel et al. (2014) Steidel, C. C., Rudie, G. C., Strom, A. L., et al., 2014, ApJ, 795, 165
- Steidel et al. (2016) Steidel, C. C., Strom, A. L., Pettini, M., Rudie, G. C., Reddy, N. A., & Trainor, R. 2016, ApJ, 826, 159
- Storchi-Bergmann et al. (1994) Storchi-Bergmann, T., Calzetti, D., & Kinney, A. L. 1994, ApJ, 429, 572
- Stroe et al. (2017) Stroe, A., Sobral, D., Matthee, J., Calhau, J., & Oteo, I. 2017, MNRAS, 471, 2558
- Takada et al. (2014) Takada, M., et al. 2014, PASJ, 66, R1
- Talia et al. (2017) Talia, M., et al. 2017, MNRAS, 471, 4527
- Trainor et al. (2016) Trainor, R. F., et al. 2016, ApJ, 832, 171
- van Hoof et al. (2004) van Hoof, P. A. M., Weingartner, J. C., Martin, P. G., Volk, K., & Ferland, G. J. 2004, MNRAS, 350, 1330
- Vanzella et al. (2009) Vanzella, E., et al. 2009, ApJ, 695, 1163
- Vanzella et al. (2016) Vanzella, E., et al. 2016, ApJL, 821, L27
- Vanzella et al. (2017) Vanzella, E., et al. 2017, ApJ, 842, 47
- Villar-Martín et al. (1997) Villar-Martín, M., Tadhunter, C., & Clark, N. 1997, A&A, 323, 21
- Villar-Martín et al. (2004) Villar-Martín, M., Cerviño, M., & Delgado, G. 2004, MNRAS, 355, 1132
- Zamorani et al. (1981) Zamorani, G., Henry, J. P., Maccacaro, T., et al. 1981, ApJ, 245, 357