BAT AGN Spectroscopic Survey – V. X-ray properties of the Swift/BAT 70-month AGN catalog
Abstract
Hard X-ray ( keV) observations of Active Galactic Nuclei (AGN) can shed light on some of the most obscured episodes of accretion onto supermassive black holes. The 70-month Swift/BAT all-sky survey, which probes the 14–195 keV energy range, has currently detected 838 AGN. We report here on the broad-band X-ray (0.3–150 keV) characteristics of these AGN, obtained by combining XMM-Newton, Swift/XRT, ASCA, Chandra, and Suzaku observations in the soft X-ray band ( keV) with 70-month averaged Swift/BAT data. The non-blazar AGN of our sample are almost equally divided into unobscured () and obscured () AGN, and their Swift/BAT continuum is systematically steeper than the 0.3–10 keV emission, which suggests that the presence of a high-energy cutoff is almost ubiquitous. We discuss the main X-ray spectral parameters obtained, such as the photon index, the reflection parameter, the energy of the cutoff, neutral and ionized absorbers, and the soft excess for both obscured and unobscured AGN.
Subject headings:
galaxies: active — X-rays: general — galaxies: Seyfert — quasars: general — X-rays: diffuse backgroundI. Introduction
Active Galactic Nuclei111See Beckmann & Shrader (2012); Netzer (2013, 2015); Brandt & Alexander (2015); Ramos Almeida & Ricci (2017) for recent reviews on the subject. (AGN) are among the most energetic phenomena in the Universe, and are believed to play a significant role in the evolution of galaxies (e.g., Kormendy & Richstone 1995; Ferrarese & Merritt 2000; Gebhardt et al. 2000; Tremaine et al. 2002; Schawinski et al. 2006; Kormendy & Ho 2013). One of the most distinctive features of AGN is their strong emission in the X-ray regime, which is produced by Comptonization of optical and UV photons (e.g., Haardt & Maraschi 1991) in a hot plasma located very close to the accreting supermassive black hole (SMBH). X-ray emission is therefore an important tracer of the physical properties of the accreting system, and can constrain the amount of matter along the line of sight, typically parameterized as the neutral hydrogen column density (). X-ray emission can also be used to shed light on the structure of the circumnuclear material, by studying the spectral features created by the reprocessing of the primary X-ray radiation on the material surrounding the SMBH. The two main features produced by reprocessing of X-ray radiation in neutral material are the iron K line at keV and a broad Compton “hump” peaking at keV (e.g., Matt et al. 1991, Murphy & Yaqoob 2009).
The integrated emission of unresolved AGN gives rises to the Cosmic X-ray background (CXB; e.g., Giacconi et al. 1962; Bauer et al. 2004; Harrison et al. 2016). Studies carried out below 10 keV have shown that the shape of the CXB is significantly flatter (with a photon index , e.g., De Luca & Molendi 2004) than the typical X-ray spectrum of unobscured AGN (, e.g., Nandra & Pounds 1994). This, together with the fact that the CXB shows a clear peak at , where the bulk of the reprocessed X-ray radiation is emitted, suggests that heavily obscured AGN contribute significantly to the CXB. Synthesis models of the CXB (e.g., Ueda et al. 2003, 2014, Gilli et al. 2007, Treister & Urry 2005; Treister et al. 2009, Draper & Ballantyne 2010, Akylas et al. 2012) have shown that a fraction of of Compton-thick [CT, ] AGN are needed to reproduce the CXB. The fraction of CT AGN inferred from synthesis models of the CXB is, however, strongly dependent on the assumptions made on the fraction of reprocessed X-ray emission, with stronger reflection components resulting in smaller fractions of CT AGN (e.g., Gandhi et al. 2007; Treister et al. 2009; Ricci et al. 2011; Vasudevan et al. 2013b, 2016; Ueda et al. 2014).
Radiation at hard X-rays ( keV) is less affected by the obscuring material, at least up to (see Figure 1 of Ricci et al. 2015), due to the decline of the photoelectric cross-section with increasing energy. Hard X-ray observations are therefore very well suited to detect heavily obscured AGN, and allow us to obtain the least biased X-ray sample of local AGN, and to directly study the X-ray emission responsible for the peak of the CXB. Currently, there are four operating hard X-ray observatories in-orbit. IBIS/ISGRI on board INTEGRAL (Winkler et al. 2003) was launched in 2002, and has detected so far more than 200 AGN (Beckmann et al. 2006, 2009; Paltani et al. 2008; Panessa et al. 2008; de Rosa et al. 2008, 2012; Ricci et al. 2011; Malizia et al. 2012; Bottacini et al. 2012). NuSTAR (Harrison et al. 2013), launched in 2012, is the first focussing hard X-ray telescope on-orbit, and its serendipitous survey has detected 497 sources in the first 40 months of observations (Lansbury et al. 2017b, see also Chen et al. 2017). Thanks to its revolutionary characteristics, NuSTAR has been very efficient in constraining the properties of heavily obscured AGN (e.g., Baloković et al. 2014; Gandhi et al. 2014; Stern et al. 2014; Koss et al. 2015, 2016b; Brightman et al. 2015; Lansbury et al. 2015, 2017a; Annuar et al. 2015, 2017; Boorman et al. 2016; Ricci et al. 2016a, b, 2017a, 2017b). The recently launched mission AstroSat (Singh et al. 2014) carries on board two hard X-ray instruments: the Large Area Xenon Proportional Counters (LAXPC; 3–80 keV) and the Cadmium-Zinc-Telluride coded-mask imager (CZTI, 10–150 keV). Finally, the NASA mission Swift (Gehrels et al. 2004), launched in 2005, carries on board the Burst Alert Telescope (BAT, Barthelmy et al. 2005; Krimm et al. 2013). BAT is a hard X-ray detector that operates in the 14–195 keV energy range and has proved to be an extremely valuable tool for studying AGN in the local Universe, since it is the only hard X-ray instrument to continuously survey the whole sky.
Early studies of Swift/BAT AGN (e.g., Tueller et al. 2008; Ajello et al. 2008; Winter et al. 2008, 2009a; Burlon et al. 2011; Ajello et al. 2012) were focussed on the first releases of the Swift/BAT catalog (Markwardt et al. 2005; Tueller et al. 2010; Segreto et al. 2010; Cusumano et al. 2010a, b) or on relatively small subsamples (e.g., Vasudevan et al. 2013a). The latest release of the Swift/BAT catalog (70-month, Baumgartner et al. 2013) has however considerably increased the number of hard X-ray selected AGN, detecting more than 800 extragalactic sources. The all-sky coverage of Swift/BAT allows to detect very luminous and rare sources, and, being one of the least biased samples of AGN available, it allows to study a growing number of local heavily obscured AGN. A large number of works have already been carried out studying pointed X-ray observations (e.g., Winter et al. 2009b; Ricci et al. 2010; Tazaki et al. 2011, 2013; Kawamuro et al. 2016b; Tanimoto et al. 2016; Marchesi et al. 2017; Oda et al. 2017) and the multi-wavelength properties of Swift/BAT AGN. This includes radio (e.g., Burlon et al. 2013; Wong et al. 2016), far-IR (e.g., Meléndez et al. 2014; Mushotzky et al. 2014; Shimizu et al. 2015, 2016), mid-IR (e.g., Meléndez et al. 2008; Weaver et al. 2010; Ichikawa et al. 2012, 2017), near-IR (e.g., Mushotzky et al. 2008; Lamperti et al. 2017; Onori et al. 2017a, b; Ricci et al. 2017d), optical (e.g., Vasudevan et al. 2009; Koss et al. 2010; Winter et al. 2010; Ueda et al. 2015) and -ray (e.g., Sambruna et al. 2010; Teng et al. 2011) studies, as well as works focussed on the host galaxy properties (e.g., Koss et al. 2011a), variability (e.g., Shimizu & Mushotzky 2013; Soldi et al. 2014) and on peculiar sources (e.g., Koss et al. 2012; Hogg et al. 2012; Smith et al. 2014; Schawinski et al. 2015). Moreover, NuSTAR has been observing Swift/BAT AGN since its launch in the framework of a legacy survey (Baloković et al. in prep.), providing high-quality data in the 3–80 keV energy range.
Our group has been working on a systematic study of the multi-wavelength properties of a very large number of Swift/BAT selected AGN from the currently available 70-month catalog (Baumgartner et al. 2013) and a forthcoming extension (105 months, Oh et al. 2017a). A large effort has been made to collect optical spectroscopy for most of the sources reported in the 70-month Swift/BAT catalog, which allowed to infer black hole masses for both obscured and unobscured objects (Koss et al. 2017). The first results of the Swift/BAT AGN Spectroscopical Survey (BASS222www.bass-survey.com) include the study of the CT AGN detected by BAT (Ricci et al. 2015, see also Koss et al. 2016a and Akylas et al. 2016), the analysis of the correlation between high-ionisation optical emission lines and AGN X-ray emission (Berney et al. 2015), the study of the relationship between optical narrow emission lines and the physical parameters of the accreting SMBH (Oh et al. 2017b), a near-IR spectroscopic study (Lamperti et al. 2017), and the analysis of the relationship between the X-ray photon index and the mass-normalized accretion rate (Trakhtenbrot et al. 2017). The detailed multi-wavelength analysis of a large sample of local AGN333See also She et al. 2017a, b for a soft X-ray study of lower luminosity local AGN. will be a very important benchmark for studies of AGN at higher redshifts, where the typical fluxes are significantly lower.
In this paper we present a compilation and analysis of the X-ray data available for the AGN of the 70-month Swift/BAT catalog. This paper is structured as follows. In II we present our sample, in III we describe the data analysis of the soft X-ray data, while in IV we illustrate the procedure adopted for the broad-band X-ray spectral analysis of the sources, and the models used. In V.1 we discuss the luminosity and flux distributions of our sample, in V.2 we examine the characteristics of the X-ray continuum, in V.3 we report on the results obtained for the neutral and ionized absorbing material, while in V.4 we discuss about the properties of the soft excess of obscured and unobscured AGN. Finally, in VI we summarize our findings and present our conclusions. Throughout the paper we adopt standard cosmological parameters (, , ). Unless otherwise stated, uncertainties are quoted at the 90% confidence level.
II. Sample
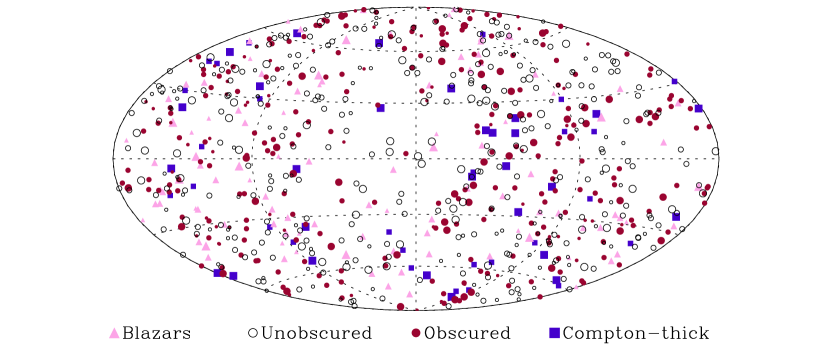
Our sample consists of the 838 AGN detected within the 70-month Swift/BAT catalog444http://swift.gsfc.nasa.gov/results/bs70mon/ (Baumgartner et al. 2013, Fig. 1). We flagged all blazars in our sample according to the latest release (5.0.0, Massaro et al. 2015) of the Roma BZCAT555http://www.asdc.asi.it/bzcat/ catalog (Massaro et al. 2009), and using the results of recent works on BAT detected blazars (Ajello et al. 2009; Maselli et al. 2013). Overall 105 objects are classified as blazars. Of these 26 are BL Lacs (BZB), 53 are Flat Spectrum Radio Quasars (BZQ) and 26 are of uncertain type (BZU). This is a different terminology than that used in the optical catalog of Koss et al. (2017) which refers to these sources as beamed AGN. Several sources have been identified as possible blazars by Koss et al. (2017) using optical spectroscopy, and are not treated as blazars here. In Table 5 we report the list of sources in our sample, together with their counterparts, coordinates, redshifts and blazar classification. For completeness, we also report the results obtained for the only non-AGN extragalactic source detected by Swift/BAT, M 82 (a nearby starburst with X-ray emission produced by star formation, e.g., Ranalli et al. 2008), although we do not include it in our statistical analysis.
II.1. Counterpart identification
The counterparts of the Swift/BAT sources were mostly taken from Baumgartner et al. (2013) and from recent follow-up studies (e.g., Parisi et al. 2009; Masetti et al. 2010b; Lutovinov et al. 2012; Masetti et al. 2012; Parisi et al. 2012). In order to confirm the counterpart association, for all sources we studied the 2–10 keV images of the fields using XMM-Newton/EPIC, Swift/XRT and Chandra/ACIS (we provide additional information on these data-sets in III). Furthermore, the object coordinates were cross-checked with the Two Micron All Sky Survey (2MASS, Skrutskie et al. 2006) and Wide-field Infrared Survey Explorer (WISE, Wright et al. 2010) point source catalogs, and deviations larger than 3′′were investigated individually. In 27 cases, the coordinates of the associated counterparts in the original BAT catalog do not accurately point to the nuclei of the systems, which in all cases are identified with a relatively bright WISE and 2MASS source. In further five cases the situation is more complex, because the original counterpart does not point to an individual galaxy, but to a pair or triple. In these cases, the closest galaxy to the X-ray source with WISE colours consistent with an AGN was selected. In Appendix A we discuss the objects for which new counterparts were found, while in Appendix B we discuss the Swift/BAT sources which host dual AGN. In three cases, where both dual AGN contributed significantly to the BAT flux, we report the spectral parameters of the two AGN (named D1 and D2).
II.2. Redshifts and distances
II.2.1 Spectroscopic redshifts and redshift-independent distances
Spectroscopic redshifts are available for most of the sources of our sample (803, i.e. %). The redshifts were taken from the first release (DR1) of the BASS optical catalog (Koss et al. 2017) and from the literature. For the closest objects in our sample (at ), whenever available, we used redshift-independent measurements of the distance, using the mean reported in the NASA/IPAC Extragalactic Database (NED). Redshift-independent distances were considered for 44 objects.
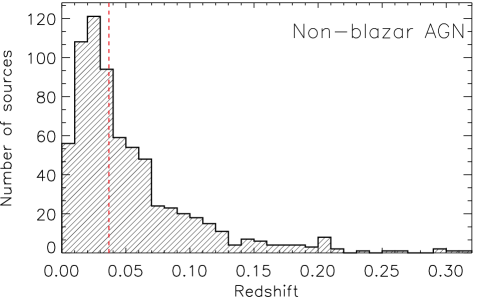
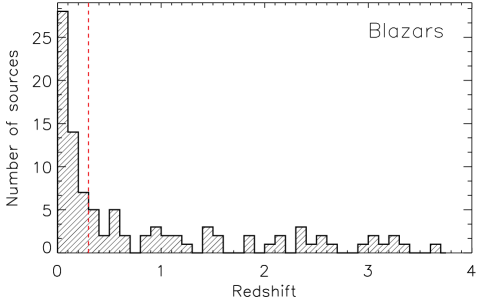
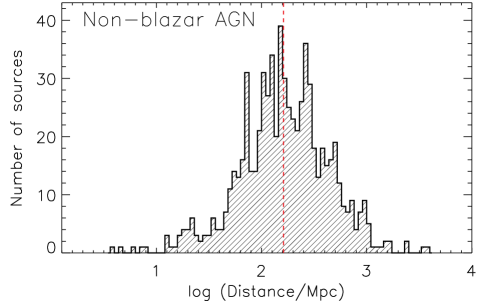
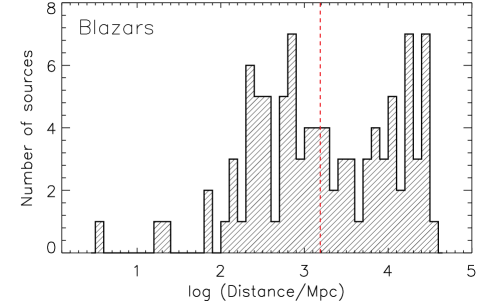
The redshift and distance distribution of the non-blazar AGN (left panels) and the blazars (right panels) in our sample are presented in Fig. 2, respectively. The median redshift and distance of non-blazar AGN (, Mpc) is significantly lower than that of blazars (, Mpc), consistent with the very different luminosity distributions of these two classes of objects (see V.1 and Fig. 14).
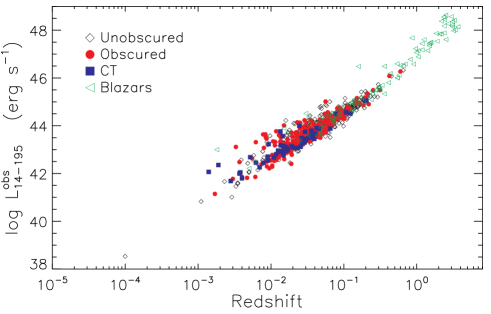
Fig. 3 presents the observed 14–195 keV Swift/BAT luminosity versus redshift for unobscured (), obscured [], CT () AGN and blazars in the sample.
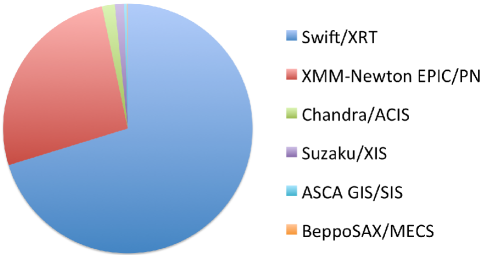
| Facility/Instrument | Sources |
|---|---|
| Swift/XRT | 588 |
| XMM-Newton EPIC/PN | 220 |
| Chandra/ACIS | 14 |
| Suzaku/XIS | 10 |
| ASCA GIS/SIS | 3 |
| BeppoSAX/MECS | 1 |
II.2.2 Photometric redshifts
The Swift/BAT 70-month sample includes 28 non-blazar AGN and 7 blazars with no redshift measurement. For the sub-sample of non-blazar AGN we calculated photometric redshifts using the LePHARE666http://www.cfht.hawaii.edu/ arnouts/LEPHARE/lephare.html code (Arnouts et al. 1999; Ilbert et al. 2006), which is a Spectral Energy Distribution (SED) fitting code based on minimization. We adopted a set of templates from Salvato et al. (2009, 2011), which includes some AGN models from Polletta et al. (2007) and hybrid templates combining AGN and host-galaxy emission. This library has been optimized and extensively tested for SED-fitting of AGN-dominated sources (see Salvato et al. 2009 for further details). Dust extinction was added to each template as a free parameter in the fit, by assuming the Calzetti et al. (2000) attenuation law.
To perform the SED-fitting, we collected multi-wavelength photometry in the ultraviolet, optical and infrared regimes. We made use of the publicly available data from the Galaxy Evolution Explorer (GALEX, Martin et al. 2005) in the far-ultraviolet ( 1550Å); the Sloan Digital Sky Survey Data Release 10 (SDSS-DR10, Ahn et al. 2014) in the optical (, , , and bands); the 2MASS catalog in the near-infrared (, and bands); the WISE and AKARI catalogues in the mid-infrared ( 3.4, 4.6, 12, 18 and 22m); the Infra-Red Astronomical Satellite (IRAS, Neugebauer et al. 1984) in the far-infrared ( 60 and 100m). We collected broad-band photometry for 27 out of the 28 sources without a listed redshift777For one source, SWIFT J1535.8-5749, we did not retrieve enough data to perform SED-fitting, therefore no redshift is available for this object..
The LePHARE code also builds a probability distribution function (PDF) through the comparison of the observed SED with all the models in the library. This allows us to quantify the uncertainty of the resulting photometric redshift. We finally note that, since they represent a very small fraction (%) of our sample, sources with photometric redshifts were only listed out of completeness, and were not used for any study which used the X-ray luminosity.
III. X-ray data and data analysis
The spectral analysis was carried out combining the 70-month time-averaged Swift/BAT spectra with data obtained by several X-ray facilities: ASCA (III.1), Chandra (III.2), Suzaku (III.3), Swift/XRT (III.4), and XMM-Newton (III.5). Only two AGN (SWIFT J1119.5+5132 and SWIFT J1313.6+3650A) were not observed by any X-ray facility in the 0.3–10 keV range, implying a completeness rate of . The highest energy bin (i.e., 150–195 keV) of the Swift/BAT spectrum was not used due to its poor response, such that it has a signal-to-noise ratio a factor of lower than the other seven BAT energy bins (Koss et al. 2013, see top panel of Fig. 2 of their paper).
The core of our analysis is the spectral decomposition of all the X-ray data available for the Swift/BAT AGN, to provide measurements of key physical properties related to the X-ray emission, including the intrinsic X-ray luminosity and the column density of matter along the line-of-sight. Therefore we first checked the results obtained by fitting the Swift/XRT spectrum with a power-law model (see IV), visually inspecting the resulting best-fit models and the residuals. We then used X-ray data from Swift/XRT for the spectral analysis of unobscured sources, unless: i) we found evidence of ionized absorption or peculiar features; ii) Swift/XRT data had low signal-to-noise ratio or were not available. For these objects we used XMM-Newton EPIC/PN data, or if no XMM-Newton observation was publicly available Suzaku/XIS, Chandra/ACIS or ASCA SIS0/SIS1 and GIS2/GIS3 data were used. For obscured sources we used XMM-Newton EPIC/PN, Suzaku/XIS, Chandra/ACIS or ASCA SIS0/SIS1 and GIS2/GIS3 data. In case none of those were available we used Swift/XRT observations. For blazars we used Swift/XRT data, unless none were available. Whenever more than one observation was available, we used the deepest (after accounting for data filtering). We privileged XMM-Newton EPIC/PN observations over Suzaku/XIS, Chandra/ACIS, and ASCA SIS0/SIS1 and GIS2/GIS3 because of its larger collecting area in the 0.3–10 keV region, and due to the fact that XMM-Newton observed a larger number of sources compared to the other satellites. In one case (SWIFT J2234.8-2542) the source was only observed by BeppoSAX below 10 keV, and we report the results of study of Malizia et al. (2000) combined with the analysis of the Swift/BAT spectrum.
In the following we briefly describe the X-ray instruments we used, and the procedure we adopted, for the spectral extraction. Details of the soft X-ray observation used for the broad-band X-ray spectral analysis of each source are reported in Table 6. Fig. 4 shows the distribution of different instruments used for the analysis of the soft X-ray emission of Swift/BAT AGN (see also Table 1).
III.1. ASCA
We used ASCA SIS0/SIS1 and GIS2/GIS3 data for three sources. The reduced spectra were obtained from the Tartarus database888http://heasarc.gsfc.nasa.gov/FTP/asca/data/tartarus/ (Turner et al. 2001), which collects the products obtained for 611 ASCA observations of AGN.
III.2. Chandra
Chandra (Weisskopf et al. 2000) ACIS (Garmire et al. 2003) data were used for 14 sources. The reduction of Chandra/ACIS data was performed using CIAO v.4.6 (Fruscione et al. 2006) following the standard procedures. The data were first reprocessed using chandra_repro, and the source spectra were then extracted using circular apertures of radius, centered on the optical counterpart of each source. Background spectra were extracted using circular regions with identical apertures, centered on regions where no other source was present. Both spectra were extracted using the specextract tool. Sources with significant pileup were modelled with the addition of the pileup model in xspec.
III.3. Suzaku
Suzaku (Mitsuda et al. 2007) X-ray Imaging Spectrometer (XIS, Koyama et al. 2007) data were used to complement Swift/BAT spectra for ten source. For most of its operating time XIS was composed of three cameras, the front-illuminated (FI) XIS 0 and XIS 3, and the back-illuminated (BI) XIS 1 (hereafter BI-XIS).
For each of the three XIS cameras, we reprocessed the data and extracted the spectra from the cleaned event files using a circular aperture with a radius of centred on the source. The background was taken from a source-free annulus centred at the source peak, with an internal and external radius of and , respectively. We generated the ancillary response matrices (ARFs) and the detector response matrices (RMFs) using the xisrmfgen and xissimarfgen tasks (Ishisaki et al. 2007), respectively. The spectra obtained by XIS 0 and XIS 3 were merged using mathpha, addrmf and addarf.

III.4. Swift/XRT
The X-ray telescope (XRT, Burrows et al. 2005) on board Swift followed up nearly all of the sources detected by BAT in the first 70-months of operations. Swift/XRT data analysis was performed using the xrtpipeline following the standard guidelines (Evans et al. 2009). Swift/XRT observations were used for a total of 588 sources.
III.5. XMM-Newton
We used XMM-Newton (Jansen et al. 2001) EPIC/PN (Strüder et al. 2001) observations for 220 sources. The original data files were reduced using the XMM-Newton Standard Analysis Software version 12.0.1 (Gabriel et al. 2004), and the raw PN data files were then processed using the epchain task.
For every observation, we inspected the background light curve in the 10–12 keV energy band, in order to filter the exposures for periods of high-background activity. Only patterns corresponding to single and double events (PATTERN ) were selected. We extracted the source spectra from the final filtered event list using circular apertures centred on the object, with a typical radius of . Regions with smaller radii were used for the sources detected with a low signal-to-noise ratio. The background was extracted from circular regions of radius, located on the same CCD as the source, where no other X-ray source was detected. We checked for the presence of pile-up using the epatplot task. For observations with significant pile-up we used an annular region with an inner radius set such that no pile-up was present. Finally, we created ARFs and RMFs using the arfgen and rmfgen tasks, respectively.
IV. X-ray spectral analysis
The X-ray spectral analysis was carried out using xspec v.12.7.1b (Arnaud 1996). For all models reported in what follows, we took into account Galactic absorption in the direction of the source, by adding photoelectric absorption (i.e., using the tbabs component in xspec, Wilms et al. 2000), fixed to the value from the HI maps of Kalberla et al. (2005), assuming Solar metallicity. The combined X-ray spectra were then analyzed using a series of models of successive complexity, which are listed in Table 2. First, all sources were fitted using a simple power-law model [tbabs(zpow) in xspec], and the residuals were then visually inspected to assess whether the X-ray spectrum showed signatures of neutral or ionized absorption. A cross-calibration constant () was added to all models to take into account possible variability between the 70-month averaged Swift/BAT spectra and the considerably shorter soft X-ray observations, as well as cross-calibration uncertainties. It should be remarked that this factor does not take into account possible spectral variability between the hard and soft X-ray spectra, which might accompany flux variability.
Sources were divided into two main categories depending on their BZCAT classification: non-blazar AGN (IV.2.1 and IV.2.2) and blazars (IV.2.3). The spectra of eight sources originally classified as blazars show signatures of reprocessed X-ray emission, or are heavily contaminated by other components, and were therefore fitted using non-blazar models. These sources are 3C 120 (Kataoka et al. 2007), 3C 273 (Haardt et al. 1998, Soldi et al. 2008), Cen A (Evans et al. 2004), Mrk 348 (Marchese et al. 2014), NGC 1052 (Brenneman et al. 2009) and NGC 7213 (Bianchi et al. 2008b). Besides these sources, the X-ray spectrum of Mrk 1501 also shows evidence of reprocessed X-ray radiation, in the form of a Fe K feature. NGC 1275 was also fitted using a different model, since its X-ray spectrum shows peculiar features due to the fact that the source is located at the center of the Perseus cluster. Non-blazar AGN were then further divided, based on the initial power-law fit, into two categories: those showing relatively weak intrinsic absorption from neutral material (IV.2.1) and those showing clear signatures of obscuration (IV.2.2). Different sets of models were used for sources in different categories. In all cases we started with the simplest models and, after visual inspection of the residuals, we increased their complexity, adding components if the fit was significantly improved.
We used statistics to fit the soft X-ray spectra when the number of counts was , and Cash statistics (C-stat, Cash 1979) when it was below 200. For the 692 sources for which more than 200 source counts were available, we rebinned the spectral data to have 20 counts per bin and used statistics. For the remaining 144 objects we rebinned the soft X-ray spectra to have one count per bin and adopted Cash statistics, while we still used statistics for the Swift/BAT spectra. The median number of counts across the entire sample is 1,600. Fig. 5 presents the distribution of counts below 10 keV. Fits were considered to be significantly improved by the addition of a component if (or ) for each extra free parameter.


| Model | tbabs | zphabs | cabs | zxipcf | zpcfabs | pexrava | bb | apec | Sources | ||
|---|---|---|---|---|---|---|---|---|---|---|---|
| A1 | ✓ | ✓ | ✓ | ✓ | ✓ | 101 | |||||
| A2 | ✓ | ✓ | ✓ | ✓ | ✓ | ✓ | 170 | ||||
| A3 | ✓ | ✓ | ✓ | ✓ | ✓ | ✓ | 35 | ||||
| A4 | ✓ | ✓ | ✓ | ✓ | ✓✓ | ✓ | 6 | ||||
| A5 | ✓ | ✓ | ✓ | ✓ | ✓ | ✓ | ✓ | 33 | |||
| A6 | ✓ | ✓ | ✓ | ✓ | ✓✓ | ✓ | ✓ | 5 | |||
| A7 | ✓ | ✓ | ✓ | ✓ | ✓ | ✓✓ | 1 | ||||
| A8 | ✓ | ✓ | ✓ | ✓ | ✓ | ✓ | ✓ | ✓ | 1 | ||
| Model | tbabs | zphabs | cabs | zxipcf | zpcfabs | cutoffpl | pexravb | apec | scatt | ||
| B1 | ✓ | ✓ | ✓ | ✓ | ✓ | ✓ | ✓ | 272 | |||
| B2 | ✓ | ✓ | ✓ | ✓ | ✓ | ✓ | ✓ | ✓ | 87 | ||
| B3 | ✓ | ✓ | ✓ | ✓ | ✓ | ✓ | ✓✓ | ✓ | 19 | ||
| B4 | ✓ | ✓ | ✓ | ✓ | ✓ | ✓ | ✓✓✓ | ✓ | 1 | ||
| B5 | ✓ | ✓ | ✓ | ✓ | ✓ | ✓ | ✓ | ✓ | ✓ | 1 | |
| B6 | ✓ | ✓ | ✓ | ✓ | ✓✓ | ✓a | 3 | ||||
| B7 | ✓ | ✓ | ✓ | ✓ | ✓ | ✓ | ✓✓c | ✓ | 1 | ||
| B8 | ✓ | ✓ | ✓ | ✓ | ✓ | ✓ | ✓c ✓c | ✓ | 1 | ||
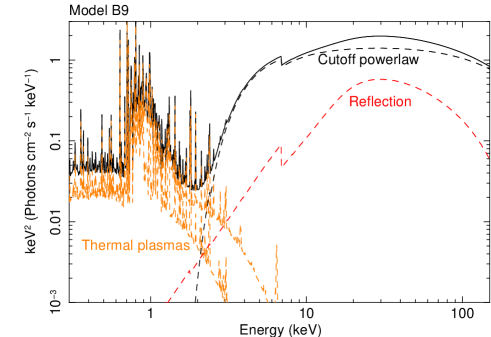
| B9 | ✓ | ✓ | ✓ | ✓ | ✓ | ✓ | ✓✓ | 1 | |||
| Model | tbabs | zphabs | cabs | zxipcf | pow | bkn | bkn2 | bb | scatt | ||
| C1 | ✓ | ✓ | ✓ | ✓ | ✓ | 52 | |||||
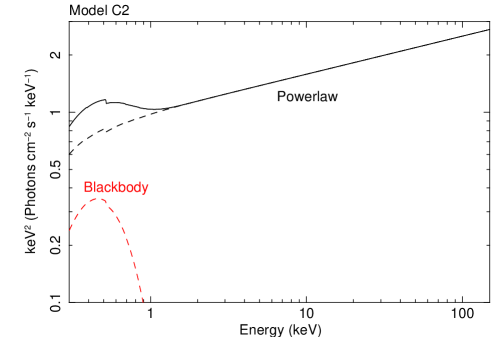
| C2 | ✓ | ✓ | ✓ | ✓ | ✓ | ✓ | 10 | ||||
| C3 | ✓ | ✓ | ✓ | ✓ | ✓ | ✓ | 3 | ||||
| C4 | ✓ | ✓ | ✓ | ✓ | ✓✓ | ✓ | 2 | ||||
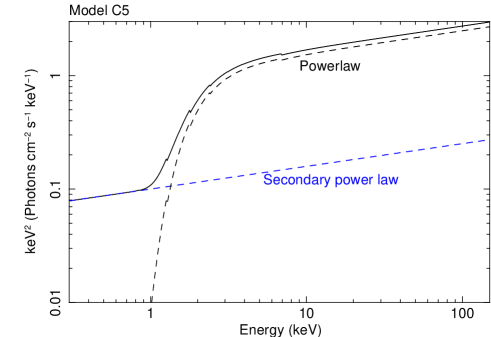
| C5 | ✓ | ✓ | ✓ | ✓ | ✓ | ✓ | 6 | ||||
| C6 | ✓ | ✓ | ✓ | ✓ | ✓ | 23 | |||||
| C7 | ✓ | ✓ | ✓ | ✓ | ✓ | ✓ | 1 |
Note. — The table lists the different components that were used by the models, and the number of sources for which each model was adopted. When more than one checkmark is reported, the component was used more than once. scatt is the scattered component (cutoffpl in xspec), while is the cross-calibration constant (cons in xspec). Details about the spectral components can be found in IV.1, while the accurate syntax used in xspec is reported in IV.2.1–IV.2.3.


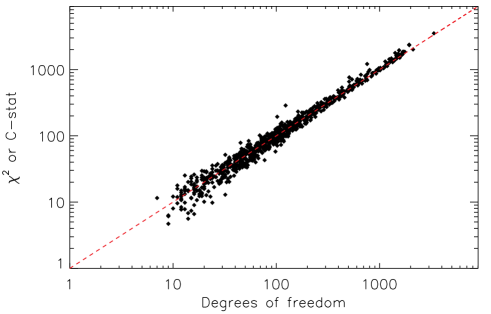
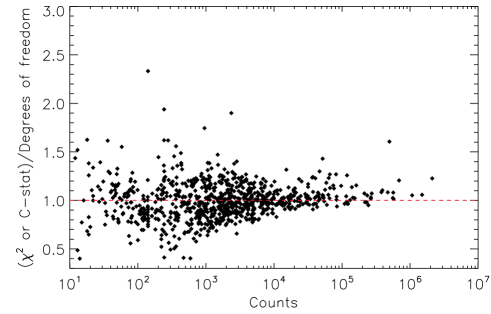
In the next sections, we report in detail the spectral components (IV.1) and the models (IV.2.1, IV.2.2 and IV.2.3) we used for the broad-band X-ray spectral fitting. The histograms showing the number of times each best-fit model was used are illustrated in Fig. 7 for unobscured AGN (top panel), obscured AGN (middle panel), and blazars (bottom panel). The main spectral parameters obtained by the broad-band X-ray spectral fitting are reported in Table 7. In the top panel of Fig. 6 we show the values of the /C-stat obtained with the best-fit model versus the number of degrees of freedom (DOF) for the sources in our sample, while in the bottom panel we show the ratio between (or C-stat) and the DOF versus the number of counts. The median value of the ratio between and the DOF is , confirming the satisfactory quality of the spectral fitting.
IV.1. Model components
In the following we describe the different components used for the X-ray spectral fitting and the free parameters of each model.
IV.1.1 X-ray continuum
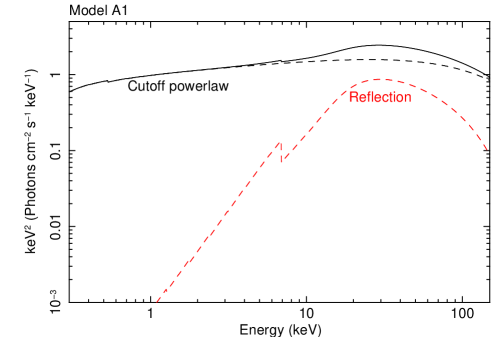
For the X-ray continuum of the non-blazar AGN we used a power-law component with a high-energy cutoff (cutoffpl in xspec). The free parameters of this model are the photon index (), the energy of the cutoff () and the normalization (). To take into account reprocessing of the primary X-ray continuum by circumnuclear material we used the pexrav model (Magdziarz & Zdziarski 1995), which assumes reflection by a semi-infinite slab. The inclination angle was fixed to degrees for all objects, in order to have a value of the reflection parameter (, where is the covering factor of the reflecting material) independent of any assumption on the geometry of obscured and unobscured AGN. The metallicity was fixed to solar, and thus the sole free parameter of this model is . For blazars we used a simple power-law model (pow) or, when required by the fit, a broken (bkn) or a double-broken (bkn2) power-law. For the power-law model the free parameters are the photon index () and the normalization ().
The broken power-law model considers a continuum that changes its slope at an energy . The two different photon indices are and for and , respectively. The free parameters of this model are , , and the normalization (). In the double broken power-law model the continuum changes slope twice: at and . The photon indices are , and for , and , respectively. The free parameters are , , , , and the normalization (). No reflection component was considered for blazars, since most of the X-ray emission arises from the jets, which washes out any signature of reprocessed radiation. In Table 7 we report the values of for the blazars for which a broken power-law continuum was used, while the values of , , and are reported in Table C.
IV.1.2 Absorption
Absorption of the X-ray radiation by neutral material occurs due to the combined effect of photoelectric absorption and Compton scattering. Photoelectric absorption was taken into account using the zphabs model, with the redshift fixed to the systemic redshift of each source. Compton scattering was considered using the cabs model. The only free parameter for these two models is the column density, which was tied to have the same value in all fits [i.e., ==]. Whenever the column density could not be constrained because the source was completely unobscured, it was fixed to . The redshift was fixed to for the sources for which no spectroscopic redshift was available. When required by the data we used a partial covering neutral absorber model zpcfabs, whose free parameters are and the covering fraction (). The values of from the best-fit models are listed in Table 7
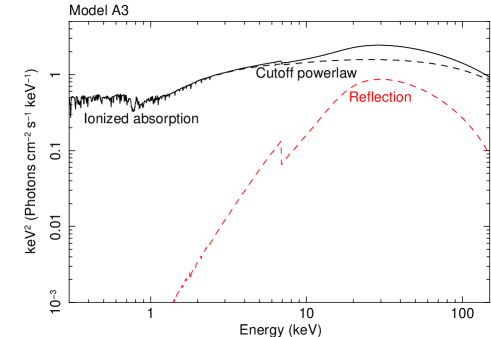
Absorption by ionized gas (also referred to as “warm absorption”) was taken into account using the zxipcf model (Reeves et al. 2008), which uses a grid of XSTAR absorption models (Bautista & Kallman 2001; Kallman & Bautista 2001). The free parameters of this model are the column density (), the ionization parameter () and the covering factor () of the warm absorber. The ionisation parameter is defined as , where is the density of the absorber, is the ionizing luminosity of the source in the range 5 eV–300 keV, and is the distance between the ionizing source and the absorbing material. The values of , and obtained by our spectral analysis are listed in Table LABEL:tbl-wa.
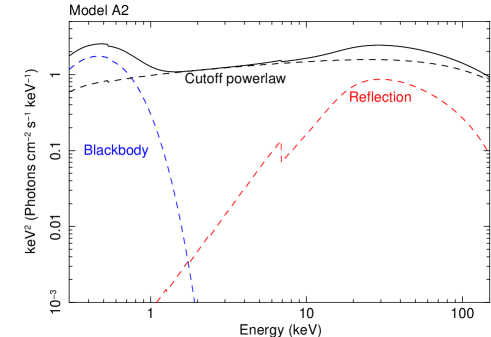
IV.1.3 Soft excess
An excess over the X-ray primary emission below keV (the “soft excess”) has been found in both obscured and unobscured sources, although it is widely believed to have a very different physical origin in the two cases. For unobscured objects the soft excess might be due to any of three potential mechanisms: i) blurred relativistic reflection (e.g., Crummy et al. 2006; Fabian et al. 2009; Vasudevan et al. 2014); ii) Comptonization of the seed optical/UV photons in plasma colder than that responsible for the primary X-ray component (e.g., Mehdipour et al. 2011; Done et al. 2012; Boissay et al. 2014, 2016); iii) smeared absorption by ionized material (e.g., Gierliński & Done 2004). For obscured objects this feature could have one or several of the following origins: i) emission from a thermal plasma possibly related to star formation (e.g., Iwasawa et al. 2011); ii) radiative-recombination continuum created by gas photoionized by the AGN (e.g., Bianchi et al. 2006; Guainazzi & Bianchi 2007); iii) scattering of the primary X-ray emission in Compton-thin circumnuclear material (e.g., Ueda et al. 2007).
Given the different physical origin, we adopted different models to reproduce the soft excess in unobscured and obscured AGN. For unobscured sources we used a blackbody component (bbody), with the free parameters being the temperature () and the normalization. This is not a physical model, and it provides only a phenomenological representation of this feature; given the uncertain origin of the soft excess we deem this to be the best approach. For obscured AGN a second cutoff power-law component was added to the model, with the values of the photon index, the cutoff energy and the normalizations fixed to those of the primary X-ray emission. A multiplicative constant (), of typically a few percents of the primary X-ray emission (V.4.2), was added to this second cutoff power-law to renormalise the flux, as a free parameter. For obscured sources we also added, when necessary, a collisionally ionized plasma (apec). The free parameters of the apec model are the temperature () and the normalization. It should be noted that an unobscured scattered component could also be due to a partially covering absorber, in particular for values of .
IV.1.4 Fe K emission lines
The fluorescent iron K emission line has been observed almost ubiquitously in the X-ray spectra of AGN (e.g., Mushotzky et al. 1993; Shu et al. 2010), and is composed of a narrow (e.g., Shu et al. 2011; Iwasawa et al. 2012; Ricci et al. 2013a, b, 2014b) and a broad (e.g., Mushotzky et al. 1995; Nandra et al. 1997; Patrick et al. 2012) component. The narrow Fe K line could originate in the molecular torus (e.g., Nandra 2006; Ricci et al. 2014a), in the broad-line region (e.g., Bianchi et al. 2008b), in an intermediate region between these two (Gandhi et al. 2015), and from very extended ( pc) material (e.g., Young et al. 2001; Arévalo et al. 2014; Bauer et al. 2015).
The broad component is likely to be due to relativistic reflection from the innermost region of the accretion flow (e.g., Fabian et al. 2000; Brenneman & Reynolds 2009; Reynolds 2014), although at least for some objects it might be due to the distortion of the X-ray continuum created by highly-ionized absorbing material along the line-of-sight (e.g., Turner & Miller 2009 and references therein).
In this work we do not attempt to reproduce the broad Fe K emission line in the Swift/BAT AGN under study, and we limit our analysis to the more prominent and more common narrow component. This was done by adding a Gaussian emission line profile (zgauss in xspec) to all high-quality spectra (i.e., XMM-Newton EPIC/PN, Chandra, Suzaku/XIS) unless the line could not be constrained. A Gaussian line was also taken into account for Swift/XRT spectra if residuals at keV were found fitting the continuum. The parameters of this component are the peak energy, the width () and the normalization () of the line. The energy of the line was fixed to 6.4 keV if it could not be constrained, while the width was fixed to 10 eV (i.e., lower than the energy resolution of the X-ray instruments we used) if the line was not resolved. The values of the energy, equivalent width (EW), width and normalization of the lines obtained are listed in Table LABEL:tbl:kalphalines. The properties of the Fe K line, and its relation with the physical characteristics of the accreting SMBH, will be discussed in detail in a forthcoming publication.
IV.2. Spectral models
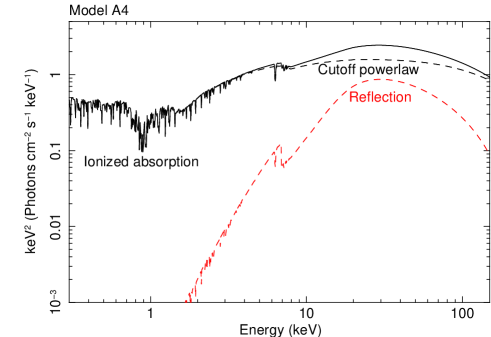
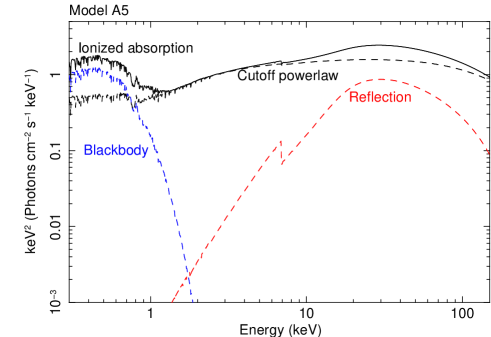
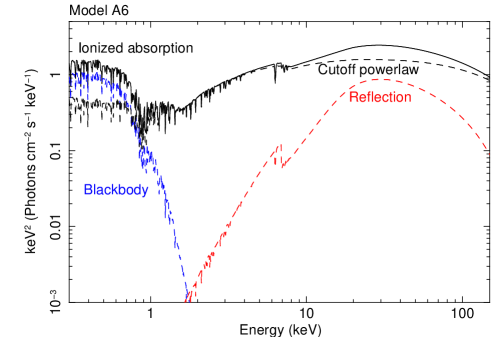
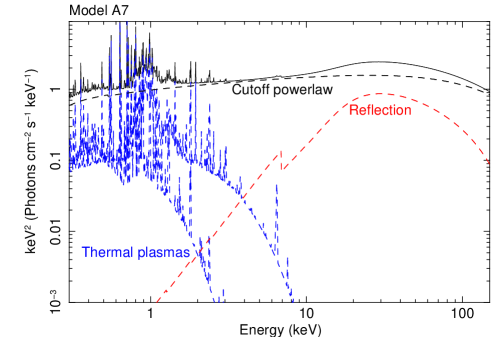
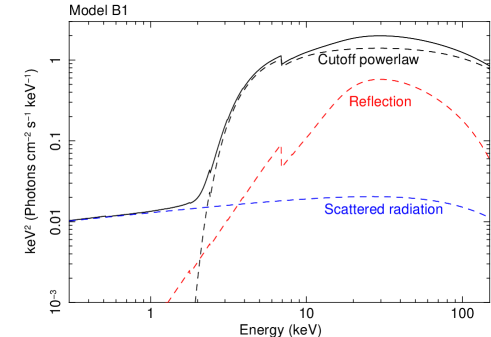
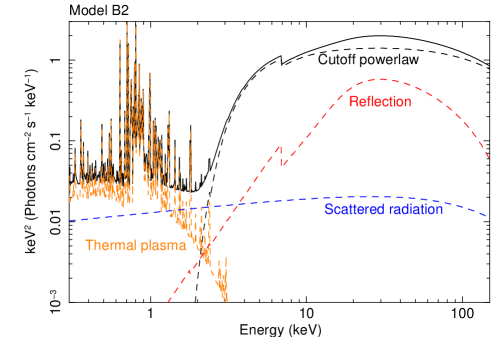
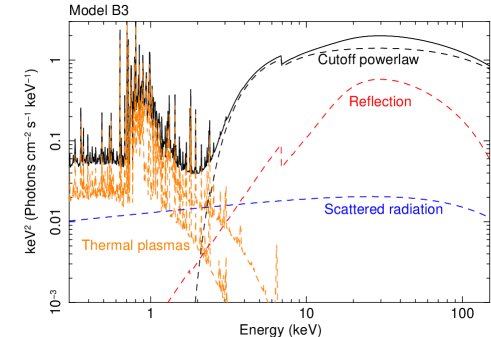
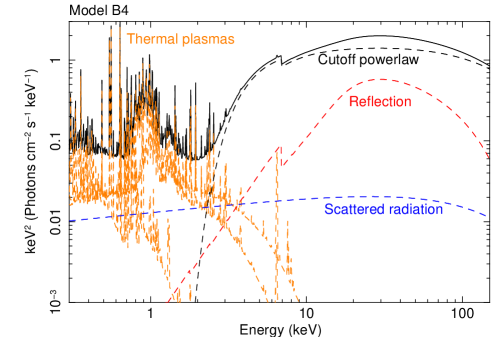
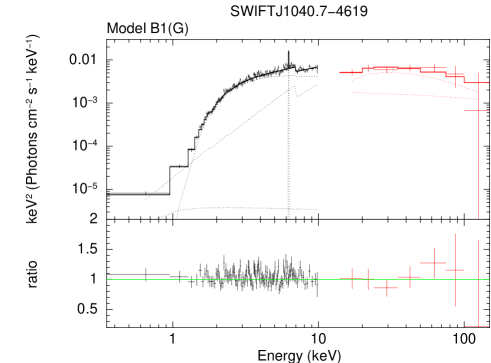
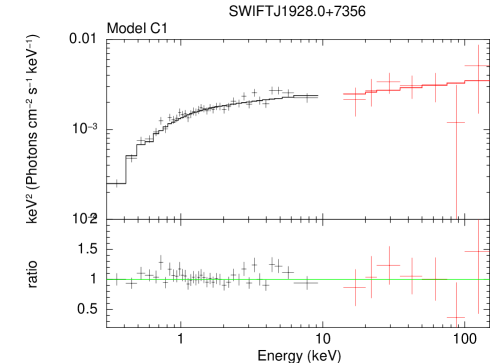
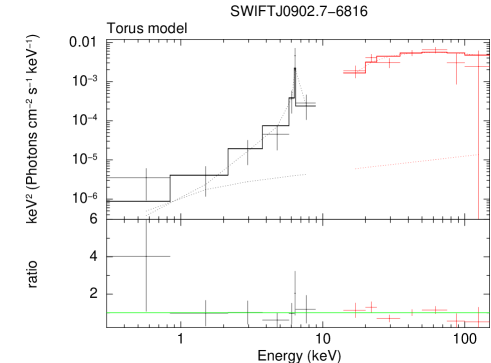
In the following we list the different models that we adopted for the X-ray spectral fitting of our sources. In Table 2 we summarize the different spectral models, while in Figs. 8–11 we illustrate the models we used, highlighting the different components. In Fig. 12 we show, as an example of the typical fitting quality, four broad-band X-ray spectra of different types of AGN (unobscured, obscured, blazar and CT).
IV.2.1 Unobscured sources
A total of 352 AGN were fitted using this set of models (i.e., model A1 to A8, top panel of Fig. 7).
Model A1:
tbabszphabscabspexrav.
This model includes primary X-ray emission and reflection, both of them obscured by the same column density. Used for 101 AGN.
Model A2:
tbabszphabscabs(pexrav + bb).
This model is the same as model A1, with the addition of a blackbody component to take into account the presence of a soft excess below 1 keV. Used for 170 sources.
Model A3:
tbabszphabscabszxipcfpexrav.
Same as model A1 plus a layer of partially covering ionized material. Used for 35 AGN.
Model A4:
tbabszphabscabszxipcf zxipcfpexrav.
Same as Model A3 plus another layer of partially covering ionized material. Used for 6 objects.
Model A5:
tbabszphabscabszxipcf(pexrav + bb).
Same as model A2 plus a partially covering ionized absorber. Used for 33 X-ray spectra.
Model A6:
tbabszphabscabszxipcf zxipcf(pexrav + bb).
Same as model A5 plus another partially covering ionized absorber. Used for 5 sources.
Model A7:
tbabs(zphabscabspexrav + apec + apec)
This model was used only for SWIFT J0955.56907 (M81) and adds emission from two components of collisionally ionized plasma to model A1. These two components, with different temperatures, are included to take into account the emission from hot gas, possibly associated to star formation and point sources (Page et al. 2003).
Model A8:
tbabszpcfabszxipcfcabs(pexrav + bb)
This model was used only for SWIFT J1210.53924 (NGC 4151) and adds a partially covering neutral absorber to model A5. These two components, with different temperatures are added to take into account the emission from hot gas, possibly associated to star formation and point sources (Page et al. 2003).
IV.2.2 Obscured sources
A total of 386 objects were fitted using this set of models (i.e., model B1 to B9, middle panel of Fig. 7). For obscured sources we separated the primary X-ray emission from the reflection in order to leave the latter unobscured. Reprocessed X-ray radiation was taken into account by tying the values of the normalization of the power-law and of the cutoff energy to those of the primary X-ray emission, while leaving the reflection component free to vary. The value of was set to have only negative values, in order to consider only X-ray reflection in the model. For the sources for which reprocessed and primary X-ray emission were decomposed, the cross-calibration constant was added only to the primary X-ray emission. This reflects a scenario in which most of the X-ray variability is due to the obscured primary X-ray continuum, while unobscured reflected radiation, produced in the torus and/or in the BLR, does not vary significantly on the timescales probed here (e.g., Arévalo et al. 2014).
Model B1:
tbabs(zphabscabscutoffpl + pexrav + cutoffpl).
This model considers an absorbed primary X-ray emission, an unobscured reflection component, and a scattered component. Used for 272 sources.
Model B2:
tbabs(zphabscabscutoffpl + pexrav + cutoffpl + apec).
Same as model B1 plus a collisionally ionized plasma component. Used for 87 AGN.
Model B3:
tbabs(zphabscabscutoffpl + pexrav + cutoffpl + apec + apec).
Same as model B2 plus a second collisionally ionized plasma. Used for 19 objects.
Model B4:
tbabs(zphabscabscutoffpl + pexrav + cutoffpl + apec + apec + apec).
Same as model B3 plus a third collisionally ionized plasma. Used only for SWIFT J1322.21641 (MCG 0334064).
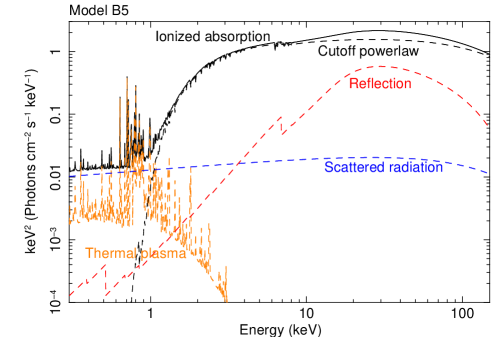
Model B5:
tbabs(zphabscabszxipcfcutoffpl + pexrav + cutoffpl + apec).
Same as model B2 plus a partially covering ionized absorber. Used only for SWIFT J0333.63607 (NGC 1365).
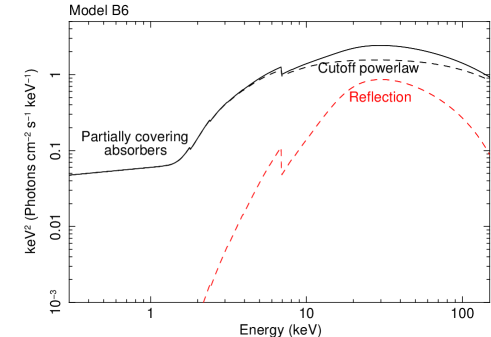
Model B6:
tbabs(zpcfabszpcfabscabspexrav).
Considers a double partially covering absorber instead of fully covering material. This model was used only for SWIFT J0552.20727 (NGC 2110), SWIFT J2124.65057 (4C 50.55) and SWIFT J2223.90207 (3C 445). For the latter also a thermal plasma was added to the model. The column density of the cabs term was fixed to the sum of the values of of the two partially covering absorbers, weighted over their covering factor.
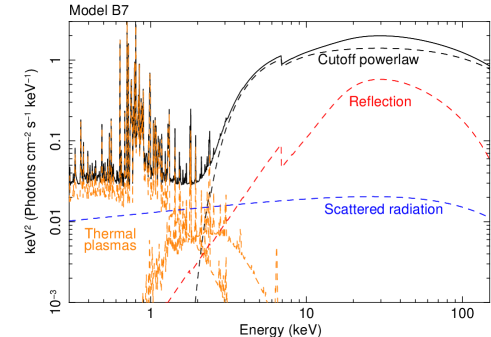
Model B7:
tbabs(zphabscabscutoffpl + pexrav + cutoffpl + zphabsapec + apec).
Same as Model B3 plus neutral absorption for one of the two collissionally ionized plasma models. Used only for SWIFT J1206.25243 (NGC 4102).
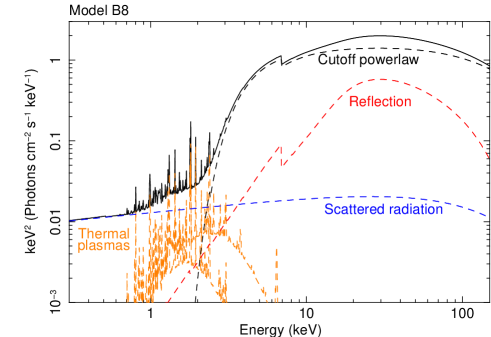
Model B8:
tbabs(zphabscabscutoffpl + pexrav + cutoffpl + zphabsapec + zphabsapec).
Same as model B3 plus two neutral absorption components, one for each of the collissionally ionized plasma components. Used only for SWIFT J1652.90223 (NGC 6240).
Model B9:
tbabs(zphabscabscutoffpl + pexrav + apec + apec).
Same as model B3, with the exception of the scattered component. This model was applied only for SWIFT J0319.74132 (NGC 1275).
IV.2.3 Blazars
A total of 97 objects were fitted using this set of models (i.e., C1 to C7, bottom panel of Fig. 7). For all the blazars, with the exception of the eight listed in IV, we considered a power-law for the primary X-ray emission and did not take into account reprocessed radiation. The models we applied are the following.
Model C1:
tbabszphabscabspow
This model considers an absorbed power-law continuum. Used for 52 objects.
Model C2:
tbabs(zphabscabspow+bb)
Same as model C1 plus a blackbody component. Used for ten blazars.
Model C3:
tbabszphabscabszxipcfpow
Same as model C1, including also an ionized absorption component. Used for three objects: SWIFT J0507.76732, SWIFT J1224.92122 and SWIFT J1625.94349 (87GB 050246.4+673341, PG 1222+216 and 87GB 162418.8+435342, respectively).
Model C4:
tbabszphabscabszxipcfzxipcfpow
Same as model C1 plus two ionized absorption components. Used for two objects: SWIFT J1557.87913 (PKS 154979) and SWIFT J2346.85143 (2MASX J23470479+5142179).
Model C5:
tbabs(zphabscabspow+pow)
Same as model C1 plus a power-law component, which might be either unobscured jet emission or scattered emission as in obscured non-blazar AGN. Used for six blazars.
Model C6:
tbabszphabscabsbkn
In this model the primary X-ray emission is produced by a broken power-law. Used for 23 sources.
Model C7:
tbabs(zphabscabsbkn2)
In this model the primary X-ray component is described by a double broken power-law. Used only for SWIFT J1256.20551 (3C 279).
IV.2.4 Other models
For two objects (SWIFT J0956.1+6942 and SWIFT J2234.82542) we used two additional models to reproduce their X-ray emission.
Model D1:
tbabs[zphabscabscutoffpl+
zphabscabs(apec+apec)]
Just in one case, the nearby star forming galaxy SWIFT J0956.1+6942 (M 82, , i.e. the closest extragalactic Swift/BAT source), it was necessary to use a model which consisted of a cutoff power-law X-ray continuum and two absorbed collisional plasmas. No AGN is present in this object (e.g., Gandhi et al. 2011), and all the X-ray flux can be explained by star formation (e.g., Ranalli et al. 2008). In this model the cutoff power-law represents the X-ray emission of the population of X-ray binaries, while the two collissionally ionized plasma models take into account the emission from hot gas. The results obtained by the spectral analysis for this object are summarised in Appendix C.
Model D2:
tbabszphabscabspow
IV.2.5 Compton-thick AGN
In order to self-consistently take into account absorbed and reprocessed X-ray radiation, the 75 sources that, after being fitted with the models reported above, were found to have column density values consistent with within their 90 uncertainties, were fitted with the spherical-toroidal model of Brightman & Nandra (2011). The free parameters of this model are the column density, which is the same for every line-of-sight intercepting the torus, the half-opening angle of the torus () and the inclination angle (). We left free to vary unless the parameter could not be constrained, in which case it was fixed to 60 degrees. To reduce the degree of complexity of the models, the value of was fixed to the maximum allowed value (87 degrees) for all sources. The main properties of the CT AGN from our sample have been reported in a recently published paper (Ricci et al. 2015), while the spectral parameters obtained are listed in Table LABEL:tbl-torpar.
V. Results
In the following we report the results obtained by the broad-band X-ray spectral analysis of the 836 AGN of our sample. In V.1 we describe how we calculated the fluxes and luminosities, and discuss the luminosity distributions of different classes of AGN. In V.2 we discuss the properties of the X-ray continuum, and in particular of the photon index (V.2.1), the cross-calibration constant (V.2.2), the high-energy cutoff (V.2.3), and the reflection component (V.2.4). In V.3 we summarize the properties of the neutral (V.3.1) and ionized (V.3.2) absorbers, while in V.4 we discuss those of the soft excess for unobscured (V.4.1) and obscured (V.4.2) non-blazar AGN. The median values of the parameters of non-blazar AGN and blazars are reported in Table 3 and Table 4, respectively. Through the paper the errors on the median values are the median absolute deviations.
V.1. Fluxes and Luminosities
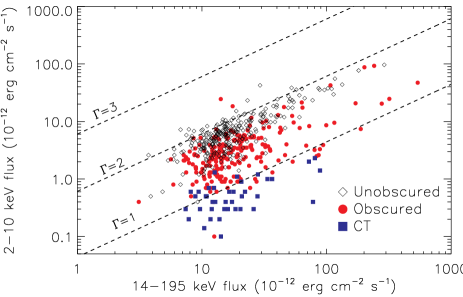
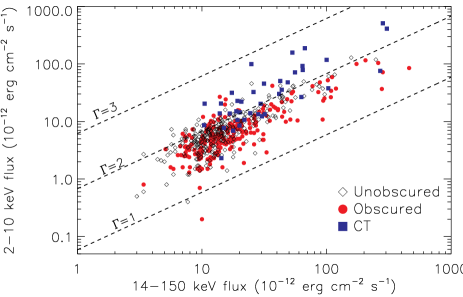
The absorption-corrected fluxes of the continuum emission (i.e., excluding the soft excess and Fe K component) were measured in three energy bands: 2–10, 20–50 and 14–150 keV (, and , respectively). To be consistent with what was reported in the Swift/BAT catalogs we also report the fluxes in the 14–195 keV band (), which were obtained by extrapolating the 14–150 keV fluxes by assuming a power-law with a photon index of , consistent with the typical value found for Swift/BAT AGN (see §V.2.1). In the left panel of Fig. 13 we show the observed 2–10 flux versus the 14–195 keV flux, while in the right panel the absorption-corrected 2–10 versus the absorption-corrected 14–150 keV flux. The plot shows that, once the emission has been corrected for absorption, most of the sources lie in the region predicted for a power-law continuum with a slope in the range . In Table LABEL:tbl:fluxes we report the values of the observed 2–10 and 14–195 keV fluxes ( and , respectively), and of the intrinsic 2–10, 20–50, 14–150 and 14–195 keV fluxes for all the sources of our sample.
The absorption-corrected and -corrected continuum luminosities were calculated, for the 803 sources for which spectroscopic redshifts were available, in the 2–10, 20–50, 14–150 and 14–195 keV bands (, , and , respectively) using the following relation:
| (1) |
where is either the 2–10, 20–50, 14–150 or 14–195 keV flux, and is the luminosity distance. We used redshift-independent distance for the 44 objects at for which these measurements were available (see II.2.1). For blazars the -correction was calculated using the broad-band for , and the photon index obtained by fitting the Swift/BAT spectra with a single power-law model () for the , and luminosities. The observed (i..e., k-corrected but not absorption-corrected) 2–10 keV and 14–195 keV luminosities ( and , respectively) were calculated in a similar way. In Table LABEL:tbl:luminosities we report the observed 2–10 keV and 14–195 keV luminosities, and the intrinsic 2–10 keV, 20–50 keV, 14–150 keV and 14–195 keV luminosities for all the sources in our sample with spectroscopic redshifts.
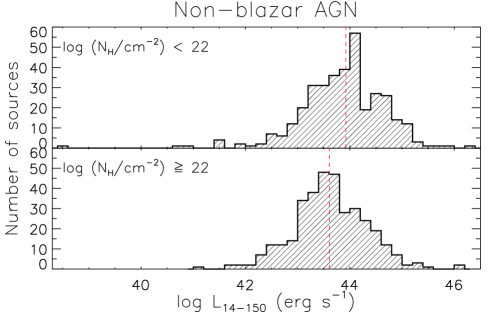
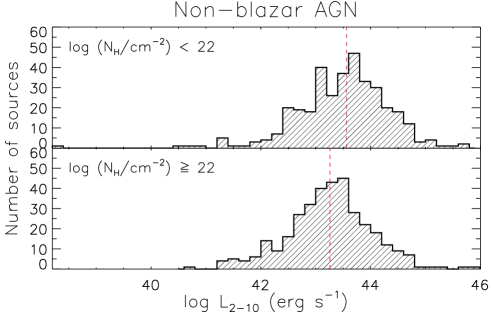
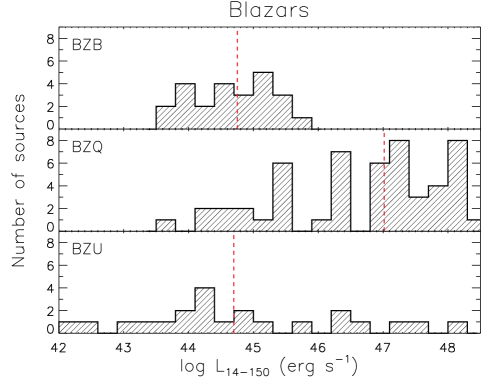
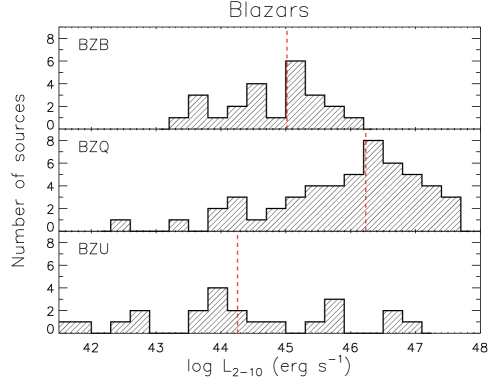
The distributions of and for non-blazar AGN are shown in the top panels of Fig. 14. These panels show that the median luminosity of unobscured AGN is higher than that of obscured AGN. This is likely related to the intrinsically different luminosity functions of obscured and unobscured AGN (e.g., Della Ceca et al. 2008; Burlon et al. 2011; Aird et al. 2015), and is consistent with the observed decrease of the fraction of obscured sources with increasing luminosity (e.g., Ueda et al. 2003; Treister & Urry 2006; Burlon et al. 2011; Ueda et al. 2014). Due to the strong beaming, blazars (right panel of Fig. 14) have on average higher luminosities than non-blazar AGN. As seen in many previous studies, among the blazars the Flat Spectrum Radio Quasars are significantly more luminous than the BL Lacs (e.g., Fossati et al. 1998; Ghisellini et al. 2010).
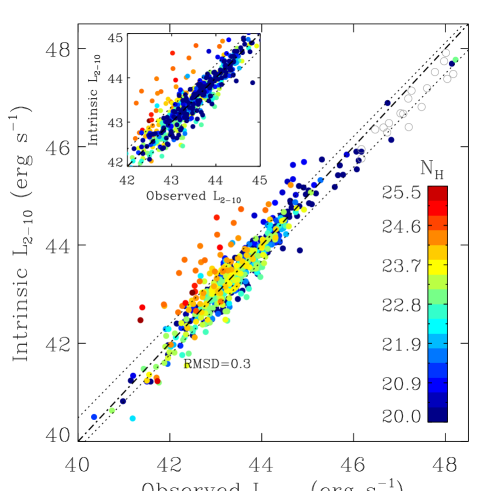
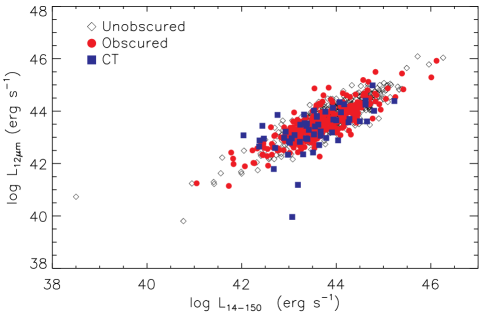
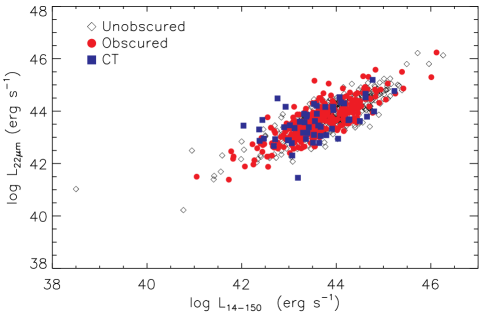
In Koss et al. (2017) we reported the observed 2–10 keV luminosities obtained by transforming the observed 14–195 keV luminosities into 2–10 keV luminosities using a correction factor of 0.37 [i.e., ]. In Fig. 15 we show that the values of for objects with are in good agreement with the 2–10 keV luminosities inferred from our spectral analysis. The scatter of dex in the plot is likely due to differences in the shape of the X-ray continuum, and to intrinsic flux variability of the primary X-ray emission. Above Compton scattering becomes non-negligible, and even the hard X-ray emission is depleted (see Fig. 1 of Ricci et al. 2015), resulting in underestimated values of . It should be remarked that, while most CT AGN lie in the range (Fig. 13), a few sources have absorption-corrected 2–10 keV fluxes considerably higher than those expected using the 14–150 keV flux, and their emission might be overestimated. In the top panel of Fig. 16 we illustrate the relation between the intrinsic 14–150 keV luminosity and the 12m luminosity (from WISE and high spatial resolution observations) for the objects of our sample. A clear correlation between the mid-IR and X-ray luminosity of non-blazar AGN has been found in the past years by a large number of studies (e.g., Lutz et al. 2004; Gandhi et al. 2009; Asmus et al. 2015; Stern 2015; Ichikawa et al. 2012, 2017), and has been interpreted as the signature of reprocessing of the accreting SMBH emission by dust in the torus. The plot shows that CT AGN follow the same trend as obscured and unobscured sources, thus confirming that we are able to accurately constrain the intrinsic hard X-ray luminosity for these objects. A similar trend is also observed considering the 22m luminosities (bottom panel of Fig. 16). We therefore recommend, for CT AGN, to use the 20–50 keV and 14–150 keV fluxes and luminosities, and the intrinsic 2–10 keV fluxes and luminosities obtained from Swift/BAT luminosities assuming (see Table LABEL:tbl:lumfluxCT).
V.2. X-ray continuum properties
V.2.1 Photon index
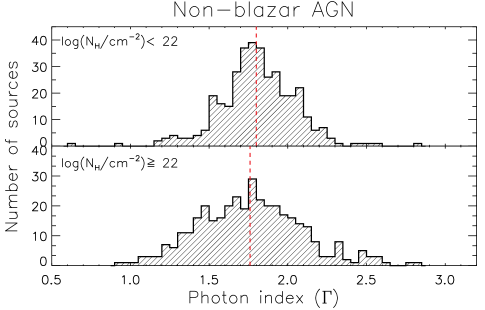
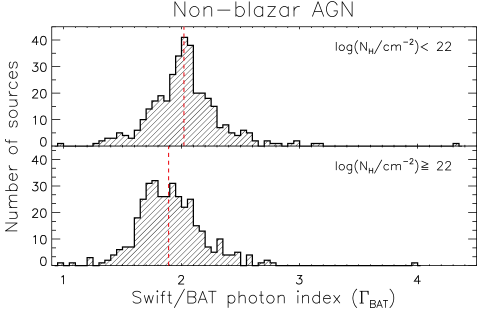
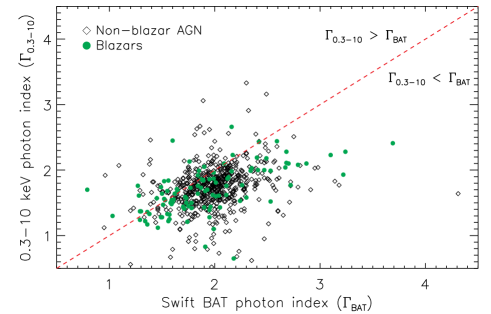
The distribution of photon indices inferred from the broad-band spectral analysis is shown in the top left panel of Fig. 17 for unobscured and obscured AGN999The median of the uncertainties on the photon index for the whole sample of non-blazar AGN is .. We find that the median values (red dashed vertical lines) of for sources with and are consistent ( and , respectively). The total-non-blazar sample has a median of , consistent with the value found by Winter et al. (2009a) (see also Alexander et al. 2013). Compton-thin obscured AGN have significantly lower photon indices () than unobscured objects, while CT AGN are found to typically have steeper slopes (). The distribution of of sources with is broader than that of AGN with , and a Kolmogorov-Smirnov test results in a p-value of , suggesting that the two populations are significantly different. The origin of this difference might be related to the larger fraction of sources with lower 0.3–10 keV counts amongst the obscured sources, which increases the scatter of , and to the population of CT AGN with . A significant difference between sources with and is found for the photon indices obtained by fitting the 14–195 keV Swift/BAT spectrum with a simple power-law model (, top right panel of Fig. 17), with unobscured AGN showing a steeper X-ray spectrum () than their counterparts (). This is likely related to the fact that is affected by obscuration, and that for the hard X-ray continuum is flattened by the presence of the reprocessed X-ray radiation emerging from the obscured primary continuum.
To further study the shape of the X-ray continuum we calculated the photon indices using two alternative approaches. First, we re-fitted all the non-blazar AGN of our sample using the same models described in IV, fixing the high-energy cutoff to the maximum value allowed ( keV), in order to minimize the spectral curvature due to the cutoff. We report the values of the photon index obtained using this approach () in Table LABEL:tbl:otherGamma. Second, we set keV, excluded the X-ray reprocessed emission101010This was done fixing the reflection parameter to for the models A1–A8 and B6, and removing the reflection component for the models B1–B5 and B7–B9, and fitted the data only in the 0.3–10 keV band. This was done using the same best-fitted model obtained from the broad-band X-ray spectral analysis, ignoring, besides the high-energy cutoff and the reflection component, also the cross-calibration constant. The photon index obtained with this approach is affected by absorption for objects in which the line-of-sight column density is , since Compton scattering would significantly deplete the X-ray emission and the relative influence of the reprocessed X-ray emission would be stronger. The values of the photon index obtained following this procedure () are also reported in Table LABEL:tbl:otherGamma.
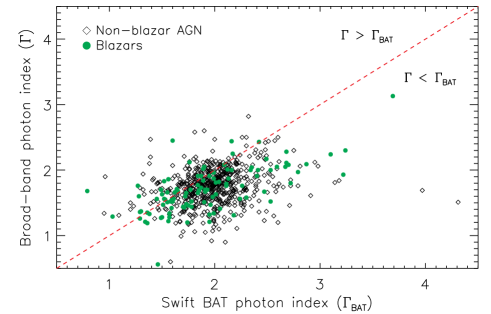
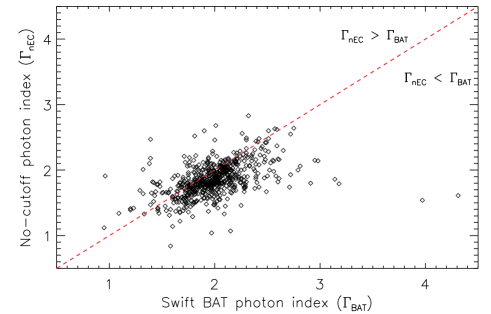
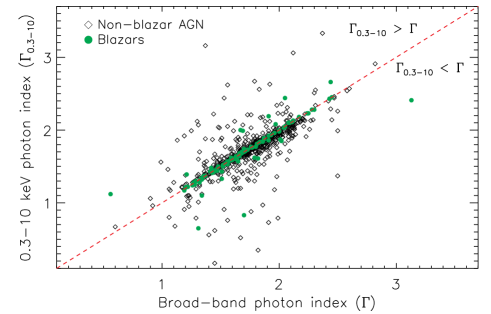
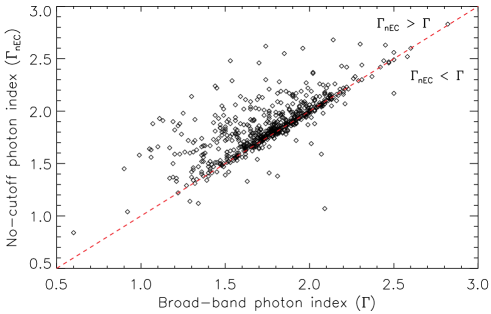
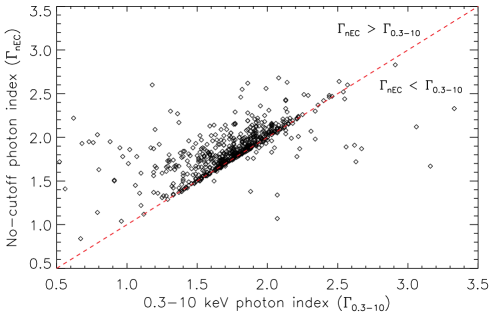
In Fig. 18 we compare the four different photon indices described above. We consider only objects with since obscuration would most significantly affect above this value. The top left panel compares with for blazars and non-blazar AGN. The plot shows that for non-blazar AGN the values of are typically lower than . This difference is likely due to the presence of a cutoff in the modelling of the primary X-ray continuum, as found by several studies of broad-band X-ray emission of AGN (e.g., Ballantyne et al. 2014; Baloković et al. 2015; Lubiński et al. 2016). In agreement with the idea that a high-energy cutoff is almost ubiquitous in the X-ray spectra of AGN, we find that the large majority () of the objects have (top right panel). Similarly, also tends to be lower than (central left panel).
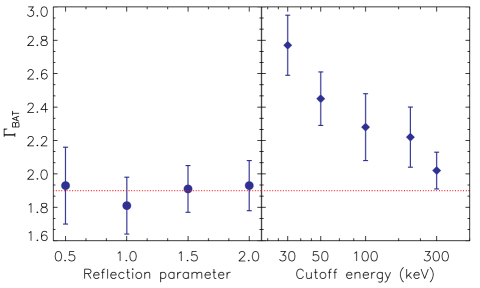
To test how reflection influences the observed value of we simulated Swift/BAT spectra using pexrav, setting and keV, the 14–195 keV flux to (consistent with the typical flux of the BAT AGN of our sample) assuming different values of the reflection parameter. The spectrum was then fitted with a simple power-law model, similar to what has been done for the Swift/BAT 70-month catalog. The value of does not increase significantly for larger values of the reflection parameter (left panel of Fig. 19). We then carried out similar simulations, fixing the reflection parameter and varying the energy of the cutoff, and found that increases significantly as the energy of the cutoff decreases (right panel of Fig. 19). This clearly shows that the steepening of with respect to is due to the presence of a cutoff.
We further find that, for most of our AGN (both blazars and non-blazar sources), (central right panel of Fig. 18). For the blazars this is due to the fact that no cutoff or reflection were considered in the fitting, while for the non-blazar AGN this implies that we are able to recover the intrinsic value of for most objects. The values of are substantially higher than those of (bottom left panel) and (bottom right panel). In particular, only () of the objects have (). This is due to the fact that, to compensate for the spectral curvature due to the cutoff, the broad-band X-ray spectral fit carried out to obtain results in larger values of and in steeper slopes.
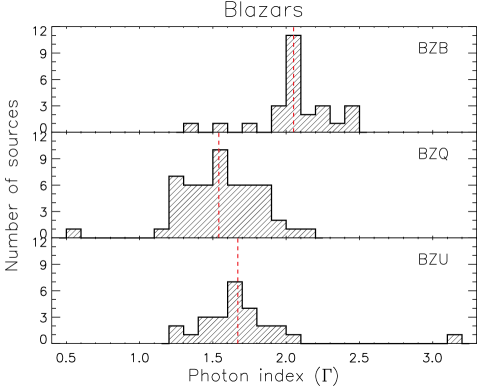
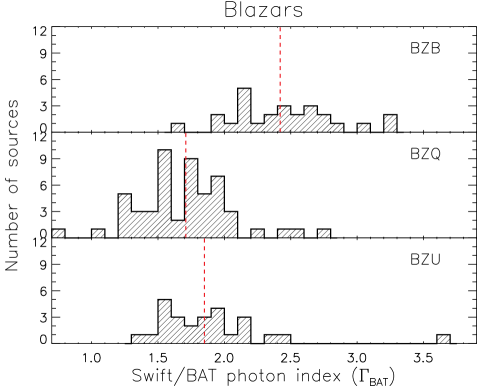
The median value of both and is lower for blazars (, ) than for the non-blazar AGN (, ). The distributions of and are illustrated in the left and right bottom panels of Fig. 17, respectively. The X-ray continuum of the Flat Spectrum Radio Quasars is very flat (, ), and it differs significantly from that of BL Lacs, which typically show steeper X-ray emission (, ). These differences in spectral shape are consistent with what has been found by Sambruna et al. (2010) who, combining Swift/BAT with Fermi/LAT spectra, argued that this behaviour (i.e., more luminous blazars are flatter in the hard X-ray band) is in agreement with the so called “blazar sequence” (e.g., Fossati et al. 1998; Inoue & Totani 2009).
V.2.2 Cross-calibration constant
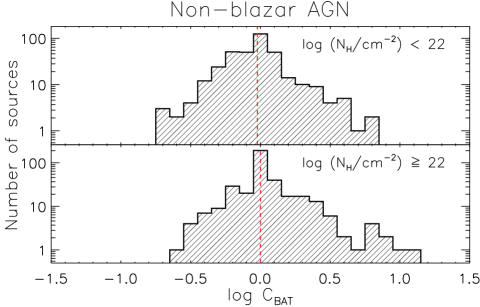
As mentioned in IV, a cross-calibration constant between the soft X-ray spectra and the 70-month averaged Swift/BAT spectra () was added to all models. We find that both the obscured and unobscured sample have a median of , consistent with the idea that the 0.3–10 keV observations are randomly sampling the variable flux of the X-ray source. In the top panel of Fig. 20 we illustrate the distribution of for objects with (top panel) and (bottom panel). The standard deviation of for the latter ( dex) is consistent with that of the former ( dex).
The uncertainties on the values of are typically higher for more obscured objects (with a median of ) than for those with () and blazars (). This difference is likely related to the complexity of the modelling when absorption is present, and to the fact that the soft X-ray spectra of the most obscured sources typically have a lower number of counts.
The standard deviation found for the whole sample of non-blazar AGN ( dex) is similar to the dispersion obtained comparing to (0.3 dex, Fig. 15). The difference between these two values (0.22 dex and 0.3 dex) could be related to differences in the spectral shape of the X-ray continuum, which would increase the dispersion of versus , as discussed in V.1. Studying a sample of 45 Compton-thin obscured Swift/BAT AGN with Suzaku, Kawamuro et al. (2016a) found a dispersion in of dex, which is consistent with the value obtained here. This confirms that with our spectral analysis we are able to quantify the intrinsic variability of the X-ray source, and that, on the timescales probed by our study (days to several years), the X-ray variability of non-blazar AGN is dex.
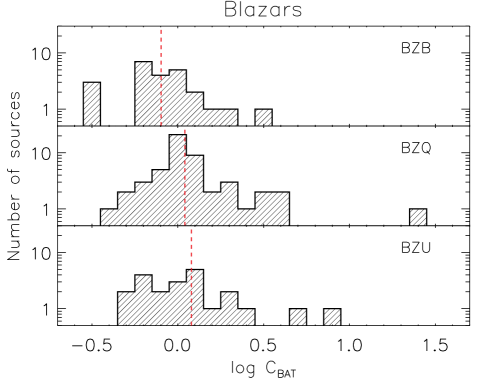
While the median value of blazars is also consistent with one (, bottom panel of Fig. 20), it has a larger scatter ( dex) than for the non-blazar AGN, consistent with the stronger variability of these objects, observed across the entire electromagnetic spectrum (e.g., Ulrich et al. 1997). The number of blazars with (10) is larger than that of objects of the same class with (5). This is likely related to the fact that several soft X-ray observations of the blazars in our sample have been triggered by the object being in a bright state (e.g., Stroh & Falcone 2013).
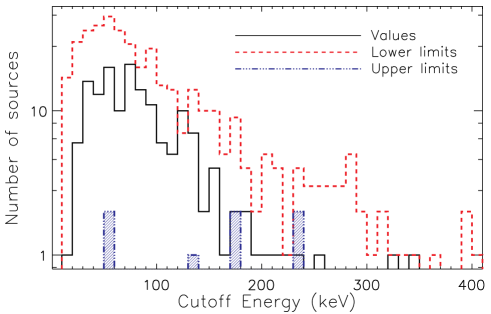
V.2.3 High-energy cutoff
The distribution of the cutoff energies for the non-blazar AGN of our sample are shown in the left panel of Fig. 21. For 418 (7) sources only a lower (upper) limit of could be obtained. As expected, most of the 161 sources for which it was possible to constrain have values keV, i.e. within the energy range covered by our spectral analysis, and a median value of keV. We found that AGN with and those with have consistent median cutoff energies ( keV and keV, respectively). The eight CT AGN for which could be constrained have a median of keV, lower than Compton-thin and unobscured objects. This is probably due to the fact that pexrav fails to identify the curvature of the spectra of these heavily obscured objects as reprocessed emission, and associates it with an X-ray continuum with a low cutoff energy, and confirms the importance of using physical torus models to study CT AGN. We find that the mean of our sample is keV and a standard deviation of keV. This is lower than the value found by Malizia et al. (2014) studying the broad-band X-ray spectra of a sample of 41 type-I AGN ( keV, keV). We compared the values of the cutoff energy obtained by our study with those found by the analysis of NuSTAR observations (Tortosa et al. 2017, Marinucci et al. 2016 and references therein), and found that the values are roughly in agreement (Fig. 22), with the exception of NGC 5506, for which the energy of the cutoff found by NuSTAR ( keV, Matt et al. 2015) is significantly higher than that inferred using Swift/BAT ( keV). For two of the objects reported by Marinucci et al. (2016), 3C 382 (Ballantyne et al. 2014) and Fairall 9 (Fabian et al. 2015), the data did not allow to constrain the energy of the cutoff.
Since for most of the sources of our sample we could only obtain lower and upper limits on the energy of the cutoff, the median and mean values reported above are not representative of the whole sample of Swift/BAT AGN. To better constrain the median of the sample, including also upper and lower limits, we performed 10,000 Montecarlo simulations for each value of . For each simulation we used the following approach: the values of of the detections were substituted with values randomly selected from Gaussian distribution centered on the best-fit value, with the standard deviation given by its uncertainty; ii) the upper limits were substituted with a random value from a uniform distribution in the interval ; the lower limits were substituted with a value randomly selected from a uniform distribution in the interval L. In the last step we assumed that the maximum value of the cutoff energy is 1,000 keV. For each Montecarlo run we calculated the median of all values, and then used the mean of the 10,000 simulations. The values obtained are reported in Table 3. We find that the whole sample has a median cutoff energy of keV, and the value of AGN with ( keV) is consistent with that of objects with ( keV), and with the one obtained for CT AGN ( keV). Considering a maximum cutoff energy of 500 keV (800 keV) we obtain, for the total sample, a median of keV ( keV). These values are in good agreement with what was obtained by Ballantyne (2014) ( keV) fitting the X-ray luminosity function of local AGN in four energy bands.
To further test the typical values of the cutoff energy, and avoid issues related to the choice of the maximum cutoff energy, we also calculated the mean and median using the Kaplan-Meier estimator and including the lower limits (see §5 of Shimizu et al. 2016 for details). We found that, for the whole sample, the median (mean) is keV ( keV), while for unobscured AGN is keV ( keV). For objects with the median (mean) is keV ( keV), and for CT AGN is keV ( keV).

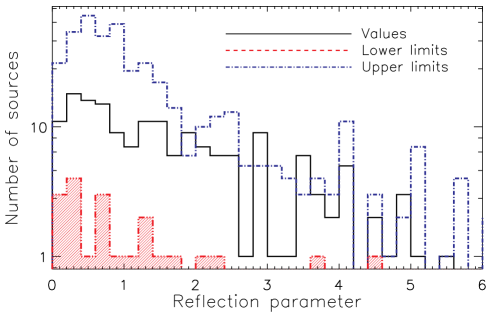
V.2.4 Reflection
The distribution of the reflection parameters () are shown in the right panel of Fig. 21. We could constrain for 170 objects, while for 490 we obtain an upper limit and for 23 a lower limit. The median value of among the sources for which the parameter could be constrained is . It should be noted that this value does not correspond to the intrinsic median of hard X-ray selected AGN, since it is typically easier to infer this parameter when its value is large. We found that 51 objects have values of , albeit most of them have large uncertainties (the median fractional error is ), and only 16 are consistent with within their respective uncertainties. Most of the objects (35) with are unobscured AGN. This might lend support to the idea that this enhanced fraction of reprocessed flux with respect to the primary X-ray emission is caused by relativistic reflection, as predicted by the light-bending scenario (e.g., Miniutti & Fabian 2004).
We took into account the upper and lower limits on following the same approach used for (V.2.3). In this case however we allowed the values to vary in the range , i.e. we assumed a maximum value of . We find that the median of the whole sample is . AGN with typically have larger reflection parameters () than those with (). We also find that CT AGN have significantly lower intensity of the reprocessed X-ray continuum relative to the primary X-ray luminosity (). The decrease of the reflection component with increasing obscuration would be in agreement with the idea that most of the reprocessing in AGN is due to the accretion disk, so that objects observed pole-on are able to see more of the reprocessed radiation than those observed edge-on. Our results are in disagreement with what was found by Ricci et al. (2011) stacking INTEGRAL IBIS/ISGRI spectra, and with the results of Vasudevan et al. (2013b) and Esposito & Walter (2016) obtained by stacking Swift/BAT spectra. All these works in fact showed that the stacked spectra of obscured AGN tend to have more reflection than those of their less obscured counterparts. Similar results were also obtained by stacking XMM-Newton data by Corral et al. (2011). While the origin of this difference is still not clear, a possible explanation could be that the stacking of spectra with different column densities would artificially produce the curvature observed in the averaged spectrum.
V.3. Absorption properties
V.3.1 Neutral absorption


A total of 366 non-blazar AGN in our sample have , while 365 have (top and middle panels of Fig. 23). Among the blazars, only 13 sources are obscured, while the remaining 92 objects are unobscured (bottom panel of Fig. 23). The difference between the column density distributions of blazars and non-blazar AGN could be either related to: i) the very strong radiation field of the former; ii) the fact that in blazars a significant fraction of the X-ray emission is emitted by the jet, which implies that the region producing X-ray radiation is more extended and hence more difficult to significantly obscure in blazars than in non-blazar AGN; iii) the fact that blazars are observed pole-on and therefore it is less likely for the X-ray source to be obscured by the torus.
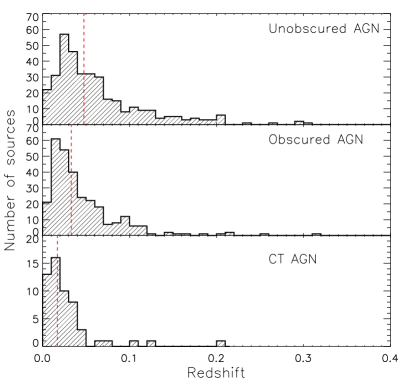
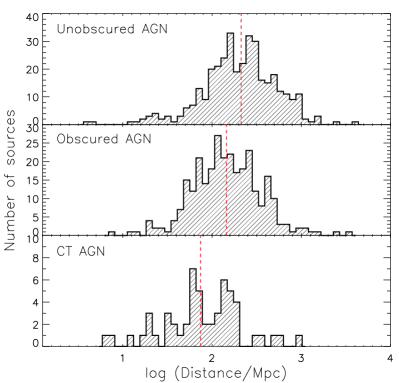
In Fig. 24 we show the redshift (left panel) and distance (right panel) distribution of non-blazar AGN, divided according to their line-of-sight column density into unobscured (top panel), obscured Compton-thin (middle panel) and CT (bottom panel). The fact that obscured Compton-thin AGN (middle panel) have a lower median redshift () than the unobscured AGN () is related to the difference in their luminosity distributions (see V.1 for discussion), while the lower redshift of CT AGN () is instead due to the influence of obscuration, which allows to detect only the nearest objects of this class (see Fig. 3 of Ricci et al. 2015).
In Fig. 25 we illustrate the ratio between the observed fluxes in the 2–10 keV and 14–195 keV bands () versus the column density. Due to the very different impact of absorption in these two bands, we expect that, as the line-of-sight column density increases, would decrease. For absorption plays a significant role also in the 14–195 keV band, so that the trend is expected to flatten. The plot shows a clear decrease of for . In particular of the non-blazar AGN for which have . For flux ratios of , of the AGN are CT.
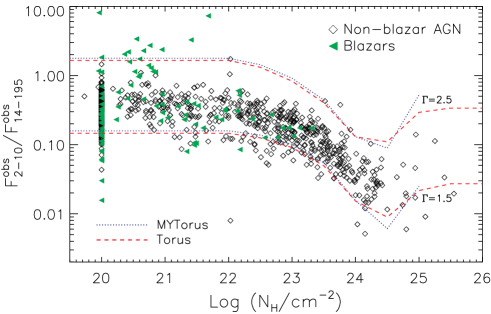
However, we identify a few exceptions to this general trend. Two AGN with have , both of which are well known CT AGN: ESO 138G001 (; e.g., Piconcelli et al. 2011) and NGC 1068 (; e.g., Bauer et al. 2015). These two objects are amongst the most obscured of our sample, and the 14–195 keV flux is also strongly affected by absorption, which naturally leads to a higher value of with respect to the transmission-dominated CT AGN. In Fig. 25 we also illustrate that for most sources is consistent with the expected flux ratios. These theoretical values were obtained using two different spectral models: the torus model of Brightman & Nandra (2011, red dashed lines) and MYTorus (Murphy & Yaqoob 2009, black dotted lines). The expected were calculated considering the maximum value of the inclination angle allowed by the models, a half-opening angle of for the torus model of Brightman & Nandra (2011), and two different values of the photon index ( and ). We added to the models a scattered power-law component with , consistent with the typical value found for Swift/BAT AGN (see V.4.2). The only Compton-thin object with a very low flux ratio () is UGC 12243. This source requires a very large cross-calibration constant () which could be due to extreme variability, with the source being in a very low-flux state at the time of the XMM-Newton observation.


While for most sources we consider only a single layer of neutral obscuring material, the unabsorbed power-law component used in our analysis to reproduce the scattered emission allows to account also for partially covering obscuration of the X-ray source. Typically, the values of of optically-selected AGN are of the order % (e.g., Bianchi & Guainazzi 2007), so that values considerably larger than this might imply the contribution of some leaked primary X-ray continuum. In our sample we find that a total of 22 (40) non-blazar AGN have (). Alternative explanations for the significant contribution of an unobscured component at low energies include the presence of strong star formation or a jet component dominating the X-ray emission below keV. This has been found to be the case for radio galaxies (Hardcastle et al. 2006, 2009), which very often show additional unobscured power-law emission. In agreement with this, we find that several of the objects with are radio loud, such as for example Cygnus A () and 4C +21.55 (). Three out of the six blazars for which a scattered component was added to the X-ray spectrum also show . For three objects, SWIFT J0552.20727 (NGC 2110)111111For NGC 2110 the two absorbers have column densities of and , and cover and of the X-ray source, respectively. An additional, fully covering, absorber with a column density of is required to well reproduce the data., SWIFT J2124.65057 (4C 50.55)121212For 4C 50.55 the absorbers have column densities of and , covering and of the X-ray source, respectively , and SWIFT J2223.90207 (3C 445)131313For 3C 445 the two absorbers have column densities of and , covering and of the X-ray source, respectively., we find that two layers of partially covering neutral material are needed to reproduce the X-ray spectrum. For these sources the values of the column density reported in Table 7 are the sum of the different components multiplied by the covering factor (as noted in IV.2).
To better constrain the column density, the 75 objects with values of consistent with within their 90% confidence interval were fitted with the torus model of Brightman & Nandra (2011) (see Table LABEL:tbl-torpar for the parameters obtained by the spectral fitting). With this approach we found that 55 Swift/BAT AGN are CT (Ricci et al. 2015), of these 26 were identified as CT candidates for the first time. A similar study was recently carried out by Akylas et al. (2016), who found 53 CT AGN, confirming the CT nature of most of our candidates. The two objects reported by Akylas et al. (2016) as CT but not listed in Ricci et al. (2015) are NGC 4941 and NGC 3081. Both of these sources have column densities that are either consistent with being CT, or are heavily obscured. From our analysis we find that NGC 4941 has a line-of-sight column density of and the 90% confidence interval is . NGC 3081 is also found to be heavily obscured [], with a 90% confidence interval of . The fact that these two AGN are heavily obscured is supported also by the very large EW of their Fe K features: and for NGC 4941 and NGC 3081, respectively. In Ricci et al. (2015) we did not report SWIFT J0025.86818 (2MASX J00253292+6821442) as CT, since the analysis of the combined Swift/BAT and the XRT spectra resulted in a column density consistent with CT within the 90% confidence interval, but with the best-fit value below the threshold ( and for the phenomenological and torus model, respectively). However, the analysis of the combined Chandra and Swift/BAT spectra, carried out with the torus model, confirms that this source is CT, with a column density of . The large EW of the Fe K ( eV) also strongly supports the idea that this source is CT.

In the top panel of Fig. 26 we compare the column density obtained using the pexrav model versus that inferred from the torus model. There is a good agreement between the two values of up to . Around the column densities obtained with the torus model become typically larger (5 out of 7 objects). Performing a linear fit of the form we found a slope of . The fact that is due to the difficulty of constraining column densities with pexrav for , since for these levels of obscuration most of the primary X-ray emission is depleted by absorption and the source is reflection dominated. Using torus models, on the other hand, it is possible to employ the shape of the reprocessed emission, as well as that of the absorbed primary X-ray emission, to infer the column density. In the central panel of Fig. 26 we show the values of obtained by the two models. The plot shows that the slopes inferred by the torus model tend to be steeper than those obtained with the phenomenological model (i.e., using pexrav). In particular of the sources have . This shows the importance of self-consistently taking into account absorbed and reprocessed X-ray emission in the most obscured AGN. The absorption-corrected fluxes obtained with pexrav and the torus model in the 2–10 keV and 14–150 keV energy ranges are illustrated in the bottom panel of Fig. 26. The plot shows that the dispersion between the fluxes obtained with the two models is lower in the 14–150 keV than in the 2–10 keV band. This is a straightforward consequence of the fact that the corrections are smaller in the 14–150 keV band.
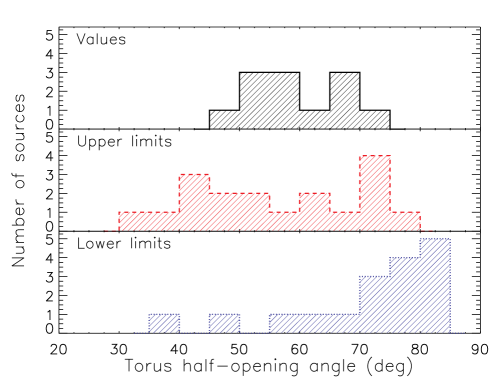
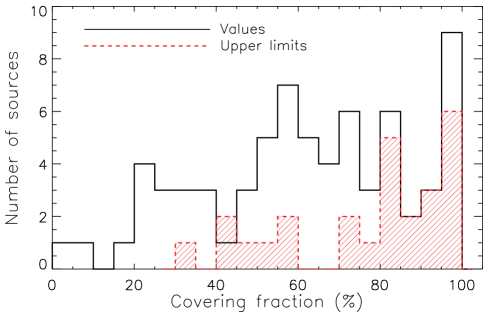
The distribution of the half-opening angle of the torus obtained by our analysis is illustrated in Fig. 27. For most of the objects (28) we could not constrain , while for 18 (17) we are only able to infer an upper (lower) limit. For the 12 objects for which we could constrain we find a median value of degrees. The detailed study of the obscuration properties of Swift/BAT AGN is reported in (Ricci et al. 2017c), where we discuss how absorption is related to the physical characteristics of the accreting SMBH.
V.3.2 Ionized absorption
Ionized absorption has been found to be a common characteristic of unobscured AGN. Early studies carried out with ASCA found evidence of O VII and O VIII absorption edges in of the sources (e.g., Reynolds 1997; George et al. 1998). More recent studies, carried out using Suzaku, XMM-Newton, and Chandra, have confirmed the presence of these warm absorbers, showing that they are related to outflows (e.g., Kaspi et al. 2000; Kaastra et al. 2000) with velocities of the order of 100–1,000 (e.g., Tombesi et al. 2013 and references therein). The analysis of high-quality Suzaku and XMM-Newton spectra has additionally pointed out that some objects also show highly ionized outflows with velocities exceeding 10,000 , the so-called ultra-fast outflows (e.g., Tombesi et al. 2010a, b; Gofford et al. 2013).
Evidence of ionized absorption was found in 86 AGN in our sample. Of these, five are blazars, one is an obscured AGN (NGC 1365), and the remaining 80 are unobscured AGN. This implies that, on average, the covering factor of the warm absorbers in non-blazar unobscured AGN is . This can be used only as a lower limit, since we might be missing ionized absorbers in objects too faint for high-quality X-ray spectra. Eleven non-blazar AGN and two blazars require two ionized absorbers to well reproduce the 0.3–10 keV spectra.
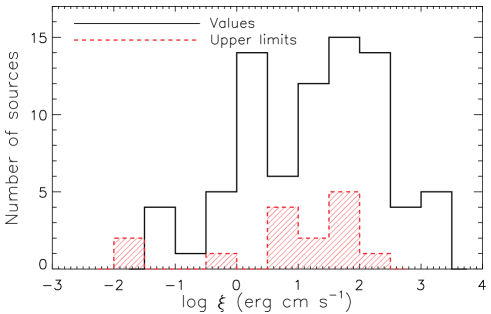
In Fig. 28 we show the distribution of the column density (top panel), the ionization parameter (middle panel) and the covering factor (lower panel) of the warm absorbers. We find that the median column density is . The median value of the ionization parameter (covering factor), for the objects for which we could constrain the values, is (). These values are in good agreement with what was found by previous studies of warm absorbers (e.g., Tombesi et al. 2013 and references therein). A more detailed study of the properties of ionized absorption, and on the relation between the warm absorbers and the physical properties of the accreting SMBH will be discussed in a forthcoming paper.
V.4. Soft excess
V.4.1 Unobscured AGN
A total of 209 unobscured AGN (i.e., ) in our sample show evidence for soft excesses. This is in agreement with what has been found by Winter et al. (2008; 2009a; ) studying X-ray observations of smaller samples of Swift/BAT AGN, and with previous works carried out with ASCA (, Reeves & Turner 2000). The presence of a soft excess had been found to be ubiquitous in optically-selected quasars (e.g., Piconcelli et al. 2005). Scott et al. (2012) estimated that, by correcting the results obtained for a large sample of type-I AGN (Scott et al. 2011) to take into account detectability, the true percentage of sources with a soft excess is . Similarly, studying a sample of 48 Seyfert 1-1.5 galaxies observed by Suzaku and XMM-Newton, Winter et al. (2012) found that 94% of the objects show a soft excess.
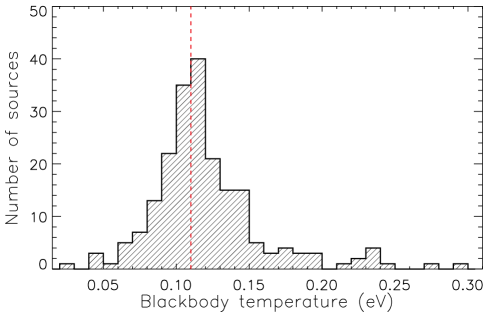
The soft excess was reproduced here using a simple phenomenological model, i.e. a blackbody with a variable temperature and normalization. We found that the median temperature of our sample is eV. As shown in Fig. 29, the distribution of is very narrow (), which is also in agreement with previous works (e.g., Gierliński & Done 2004, Winter et al. 2012).
V.4.2 Obscured AGN
The soft excess in obscured AGN could have several origins. It could be related to Thomson scattering of the primary X-ray radiation in ionized gas, possibly located in the photo-ionized region (e.g., Noguchi et al. 2010). In support of this idea, Ueda et al. (2015) recently demonstrated that AGN with low scattering fractions also show smaller ratios of the extinction-corrected [Oiii 5007] emission line to the intrinsic 2–10 keV luminosity. In addition to this, star formation could contribute significantly to the flux below keV. X-ray emission in star-forming regions is due to a population of X-ray binaries and to collisionally ionized plasma (e.g., Ranalli et al. 2008). A significant contribution might also come from radiative-recombination, which would create emission lines and a continuum below keV (e.g., Marinucci et al. 2011).
Here we do not attempt to model photoionized emission, and we reproduced the soft excess in obscured AGN as a combination of a scattered continuum and one or more collissionally ionized plasmas. A scattered component was added to the X-ray spectral model of 388 sources. The value of could be constrained for 251 objects, while for 137 only an upper limit was obtained (Fig. 30). The median value of the scattered fraction for the objects for which this value could be constrained is , with 101 objects having . Following the same approach described in V.2.3, we took into account also the lower limits in the calculation of the median value of , and found a median of for the total sample (see Table 3). Optically-selected AGN have been shown to have significantly higher values of the fraction of scattered radiation (%; e.g., Bianchi & Guainazzi 2007). Smaller values of imply either a small opening angle of the torus or a smaller amount of gas responsible for the scattering. Studying Suzaku observations of Swift/BAT type-II AGN, Ueda et al. (2007) found the first evidence for AGN with , and concluded that these objects are “buried AGN”, i.e. objects that have a torus with a very large covering factor (see also Eguchi et al. 2009, 2011). It has been argued by Hönig et al. (2014) that object with reside in highly inclined galaxies or merger systems, which would increase the probability that the scattered emission is obscured by the host galaxy. Ueda et al. (2015) showed that, while in some cases it is possible that the host galaxy is responsible for the lower scattered fraction, more than half of the objects with in their sample are free from absorption by interstellar matter along the disk of the host galaxies. In our sample, 93 AGN ( of the objects) have . The scattered emission, and the relation between and the physical properties of the accreting system, will be the subject of a forthcoming work (Ricci et al., in prep.).
A thermal plasma has been used for 112 objects in total (Fig. 31). For 88 object we applied a single thermal component, while for 23 two components were necessary, and in one case (MCG 0334064) we used three thermal plasma components with different temperatures. The median value of the temperature of this component is keV.
VI. Summary and conclusion
We described here our detailed broad-band X-ray spectral analysis of the AGN reported in the Swift/BAT 70-month catalog. Soft X-ray (0.3–10 keV) spectra are available for 836 of the 838 sources detected by Swift/BAT in its first 70 months of observations, implying a completeness of . Our sample consists of the 836 Swift/BAT objects with soft X-ray observations, of which 731 are non-beamed AGN and 105 are blazars (26 BL Lacs, 53 Flat Spectrum Radio Quasars and 26 of uncertain type). A variety of X-ray spectral models was applied to the 0.3–150 keV spectra. The median values of the spectral parameters of non-blazar AGN and blazars obtained by our spectral analysis are listed in Table 3 and Table 4, respectively. The sample and the X-ray observation log are listed in Tables 5 and 6, respectively. In Table 7 we report the main spectral parameters obtained by our analysis for all sources. In the following we summarize our main findings.
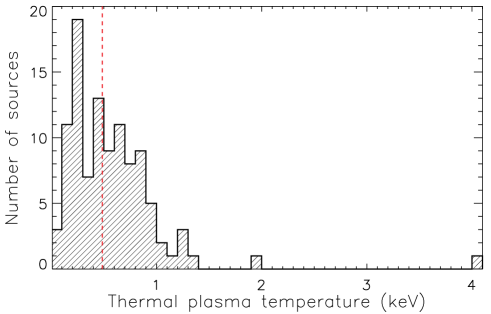
-
•
We report the values of the intrinsic (i.e., absorption-corrected and -corrected) luminosities for all objects of our sample in the 2–10 keV, 20–50 keV, 14–150 keV and 14–195 keV bands. We find that unobscured AGN have typically higher intrinsic luminosities than obscured AGN, in agreement with the decrease of the fraction of obscured sources with increasing luminosity. Among the blazars, Flat Spectrum Radio Quasars are significantly more luminous, in all the bands discussed here, than BL Lacs, while blazars of uncertain type typically have the lowest luminosities (see V.1 and Fig. 14).
-
•
The median value of the photon index obtained by the broad-band X-ray spectral analysis of the non-blazar AGN is . Obscured and unobscured objects have consistent spectral slopes, with medians of and , respectively (see V.2.1 and Fig. 17). The values of and of the photon index obtained by fitting the 0.3–10 keV spectrum alone () are typically lower than the Swift/BAT photon index (, see Fig. 18). The steepening of the X-ray continuum in the hard X-ray band suggests that the presence of a high-energy cutoff is almost ubiquitous in non-blazar AGN.
- •
-
•
A cross-calibration constant was added to all models. We found that both non-blazar AGN and blazars have a median value of (see V.2.2 and Fig. 20). From the dispersion in of non-blazar AGN we conclude that the typical variability of these objects, on the timescales probed by our study (days to several years), is dex.
-
•
The cutoff energy of non-blazar AGN, considering also the upper and lower limits (assuming a maximum value of keV), has a median of keV, and obscured and unobscured AGN have consistent median (see V.2.3 and the left panel of Fig. 21). Ignoring the upper and lower limit the median values is significantly lower ( keV). This is due to the fact that, at the typical signal-to-noise ratio of our data, we can mostly constrain values of . Using the Kaplan-Meier estimator and including the lower limits we found that, for the whole sample, the median (mean) is keV ( keV).
-
•
We find that the reflection parameter of non-blazar AGN, taking into account also upper and lower limits, has a median of (see V.2.4 and the right panel of Fig. 21). Unobscured objects have a larger median value () than Compton-thin obscured AGN () and CT sources (). The decrease of the reflection component with increasing obscuration is in agreement with the idea that most of the reprocessed X-ray radiation originates in the accretion disk. For the objects for which we could constrain we find a median value of . This is larger in unobscured AGN () than in Compton-thin obscured AGN () and in CT sources ().
- •
- •
- •
-
•
The typical fraction of scattered radiation is , lower than what is usually inferred for optically-selected AGN (see V.4.2 and Fig. 30). A total of 93 objects () have values of , which might imply that they are either surrounded by a torus with a very large covering factor, or that the amount of material responsible for the Thomson scattering in these objects is small. A total of 22 (40) objects have values of (), which implies that either the obscuring material partially covers the X-ray source or that jet emission contributes significantly to the X-ray flux at keV.
In the tables in the Appendix we report the parameters of the broken power-laws (Table C), of the warm absorbers (Table LABEL:tbl-wa), of the Gaussian lines (Table LABEL:tbl:kalphalines), as well as the observed and intrinsic fluxes (Table LABEL:tbl:fluxes) and luminosities (Tables LABEL:tbl:luminosities and LABEL:tbl:lumfluxCT). In Table LABEL:tbl:otherGamma we list the values of and , while in Table LABEL:tbl-torpar we report the parameters obtained by fitting with a torus model the broad-band X-ray spectra of the 75 AGN with values of consistent with within their 90% confidence interval.
This work is part of a large effort aimed at shedding light on the multi-wavelength properties of the least biased sample of local AGN available. A series of forthcoming publications will investigate, in detail, the relations between several of the properties measured here and those of the accreting SMBHs and host galaxies. These include, among others, the absorption properties (Ricci et al. 2017c, Ricci et al. in prep.); Fe K line; the fraction of scattered radiation; and the relation between mergers and SMBH accretion.
| (1) | (2) | (3) | (4) | (5) | (6) |
|---|---|---|---|---|---|
| Non-blazar AGN | |||||
| All | |||||
| a | 43.41 | 43.56 | 43.26 | 43.24 | 43.46 |
| b | 43.38 | 43.58 | 43.22 | 43.23 | 43.12 |
| c | 43.74 | 43.92 | 43.62 | 43.63 | 43.53 |
| d | |||||
| e | |||||
| f | |||||
| g | |||||
| h | |||||
| i | |||||
| j | |||||
| k | |||||
| l | |||||
| m | |||||
| n | |||||
| o | |||||
| p | |||||
| q | |||||
| r | |||||
| s | |||||
Note. — The table lists the median values of the parameters (1) obtained by the broad-band X-ray spectral analysis for: (2) the whole sample of non-blazar AGN, (3) objects with , (4) sources with , (5) AGN with , and (6) objects with .
| (1) | (2) | (3) | (4) | (5) |
|---|---|---|---|---|
| Blazars | ||||
| All | BZQ | BZB | BZU | |
| a | 45.37 | 46.23 | 45.09 | 44.25 |
| b | 45.15 | 46.48 | 44.63 | 44.20 |
| c | 45.53 | 47.01 | 44.92 | 44.70 |
| d | ||||
| e | ||||
| f | ||||
| g | ||||
Note. — The table lists the median values of the parameters obtained by the broad-band X-ray spectral analysis (1) for the whole sample of blazars (2), for the Flat Spectrum Radio Quasars (3), the BL Lacs (4), and the blazars of uncertain type (5).
References
- Ahn et al. (2014) Ahn, C. P., Alexandroff, R., Allende Prieto, C., et al. 2014, ApJS, 211, 17
- Aird et al. (2015) Aird, J., Coil, A. L., Georgakakis, A., et al. 2015, MNRAS, 451, 1892
- Ajello et al. (2012) Ajello, M., Alexander, D. M., Greiner, J., et al. 2012, ApJ, 749, 21
- Ajello et al. (2008) Ajello, M., Rau, A., Greiner, J., et al. 2008, ApJ, 673, 96
- Ajello et al. (2009) Ajello, M., Costamante, L., Sambruna, R. M., et al. 2009, ApJ, 699, 603
- Akylas et al. (2012) Akylas, A., Georgakakis, A., Georgantopoulos, I., Brightman, M., & Nandra, K. 2012, A&A, 546, A98
- Akylas et al. (2016) Akylas, A., Georgantopoulos, I., Ranalli, P., et al. 2016, A&A, 594, A73
- Alexander et al. (2013) Alexander, D. M., Stern, D., Del Moro, A., et al. 2013, ApJ, 773, 125
- Annuar et al. (2015) Annuar, A., Gandhi, P., Alexander, D. M., et al. 2015, ApJ, 815, 36
- Annuar et al. (2017) Annuar, A., Alexander, D. M., Gandhi, P., et al. 2017, ApJ, 836, 165
- Arévalo et al. (2014) Arévalo, P., Bauer, F. E., Puccetti, S., et al. 2014, ApJ, 791, 81
- Arnaud (1996) Arnaud, K. A. 1996, in Astronomical Society of the Pacific Conference Series, Vol. 101, Astronomical Data Analysis Software and Systems V, ed. G. H. Jacoby & J. Barnes, 17
- Arnouts et al. (1999) Arnouts, S., Cristiani, S., Moscardini, L., et al. 1999, MNRAS, 310, 540
- Asmus et al. (2015) Asmus, D., Gandhi, P., Hönig, S. F., Smette, A., & Duschl, W. J. 2015, MNRAS, 454, 766
- Astropy Collaboration et al. (2013) Astropy Collaboration, Robitaille, T. P., Tollerud, E. J., et al. 2013, A&A, 558, A33
- Ballantyne (2014) Ballantyne, D. R. 2014, MNRAS, 437, 2845
- Ballantyne et al. (2014) Ballantyne, D. R., Bollenbacher, J. M., Brenneman, L. W., et al. 2014, ApJ, 794, 62
- Baloković et al. (2014) Baloković, M., Comastri, A., Harrison, F. A., et al. 2014, ApJ, 794, 111
- Baloković et al. (2015) Baloković, M., Matt, G., Harrison, F. A., et al. 2015, ApJ, 800, 62
- Barthelmy et al. (2005) Barthelmy, S. D., Barbier, L. M., Cummings, J. R., et al. 2005, Space Sci. Rev., 120, 143
- Bauer et al. (2004) Bauer, F. E., Alexander, D. M., Brandt, W. N., et al. 2004, AJ, 128, 2048
- Bauer et al. (2015) Bauer, F. E., Arévalo, P., Walton, D. J., et al. 2015, ApJ, 812, 116
- Baumgartner et al. (2013) Baumgartner, W. H., Tueller, J., Markwardt, C. B., et al. 2013, ApJS, 207, 19
- Bautista & Kallman (2001) Bautista, M. A., & Kallman, T. R. 2001, ApJS, 134, 139
- Beckmann et al. (2006) Beckmann, V., Gehrels, N., Shrader, C. R., & Soldi, S. 2006, ApJ, 638, 642
- Beckmann & Shrader (2012) Beckmann, V., & Shrader, C. R. 2012, Active Galactic Nuclei
- Beckmann et al. (2009) Beckmann, V., Soldi, S., Ricci, C., et al. 2009, A&A, 505, 417
- Berney et al. (2015) Berney, S., Koss, M., Trakhtenbrot, B., et al. 2015, MNRAS, 454, 3622
- Bianchi et al. (2008a) Bianchi, S., Chiaberge, M., Piconcelli, E., Guainazzi, M., & Matt, G. 2008a, MNRAS, 386, 105
- Bianchi & Guainazzi (2007) Bianchi, S., & Guainazzi, M. 2007, in American Institute of Physics Conference Series, Vol. 924, The Multicolored Landscape of Compact Objects and Their Explosive Origins, ed. T. di Salvo, G. L. Israel, L. Piersant, L. Burderi, G. Matt, A. Tornambe, & M. T. Menna, 822–829
- Bianchi et al. (2006) Bianchi, S., Guainazzi, M., & Chiaberge, M. 2006, A&A, 448, 499
- Bianchi et al. (2008b) Bianchi, S., La Franca, F., Matt, G., et al. 2008b, MNRAS, 389, L52
- Boch & Fernique (2014) Boch, T., & Fernique, P. 2014, in Astronomical Society of the Pacific Conference Series, Vol. 485, Astronomical Data Analysis Software and Systems XXIII, ed. N. Manset & P. Forshay, 277
- Boissay et al. (2016) Boissay, R., Ricci, C., & Paltani, S. 2016, A&A, 588, A70
- Boissay et al. (2014) Boissay, R., Paltani, S., Ponti, G., et al. 2014, A&A, 567, A44
- Bonnarel et al. (2000) Bonnarel, F., Fernique, P., Bienaymé, O., et al. 2000, A&AS, 143, 33
- Boorman et al. (2016) Boorman, P. G., Gandhi, P., Alexander, D. M., et al. 2016, ApJ, 833, 245
- Bottacini et al. (2012) Bottacini, E., Ajello, M., & Greiner, J. 2012, ApJS, 201, 34
- Brandt & Alexander (2015) Brandt, W. N., & Alexander, D. M. 2015, A&A Rev., 23, 1
- Brenneman & Reynolds (2009) Brenneman, L. W., & Reynolds, C. S. 2009, ApJ, 702, 1367
- Brenneman et al. (2009) Brenneman, L. W., Weaver, K. A., Kadler, M., et al. 2009, ApJ, 698, 528
- Brenneman et al. (2014) Brenneman, L. W., Madejski, G., Fuerst, F., et al. 2014, ApJ, 788, 61
- Brightman & Nandra (2011) Brightman, M., & Nandra, K. 2011, MNRAS, 413, 1206
- Brightman et al. (2015) Brightman, M., Baloković, M., Stern, D., et al. 2015, ApJ, 805, 41
- Burlon et al. (2011) Burlon, D., Ajello, M., Greiner, J., et al. 2011, ApJ, 728, 58
- Burlon et al. (2013) Burlon, D., Ghirlanda, G., Murphy, T., et al. 2013, MNRAS, 431, 2471
- Burrows et al. (2005) Burrows, D. N., Hill, J. E., Nousek, J. A., et al. 2005, Space Sci. Rev., 120, 165
- Calzetti et al. (2000) Calzetti, D., Armus, L., Bohlin, R. C., et al. 2000, ApJ, 533, 682
- Cash (1979) Cash, W. 1979, ApJ, 228, 939
- Chen et al. (2017) Chen, C.-T. J., Brandt, W. N., Reines, A. E., et al. 2017, ApJ, 837, 48
- Corral et al. (2011) Corral, A., Della Ceca, R., Caccianiga, A., et al. 2011, A&A, 530, A42
- Crummy et al. (2006) Crummy, J., Fabian, A. C., Gallo, L., & Ross, R. R. 2006, MNRAS, 365, 1067
- Cusumano et al. (2010a) Cusumano, G., La Parola, V., Segreto, A., et al. 2010a, A&A, 510, A48
- Cusumano et al. (2010b) —. 2010b, A&A, 524, A64
- De Luca & Molendi (2004) De Luca, A., & Molendi, S. 2004, A&A, 419, 837
- de Rosa et al. (2008) de Rosa, A., Bassani, L., Ubertini, P., et al. 2008, A&A, 483, 749
- de Rosa et al. (2012) de Rosa, A., Panessa, F., Bassani, L., et al. 2012, MNRAS, 420, 2087
- Della Ceca et al. (2008) Della Ceca, R., Caccianiga, A., Severgnini, P., et al. 2008, A&A, 487, 119
- Done et al. (2012) Done, C., Davis, S. W., Jin, C., Blaes, O., & Ward, M. 2012, MNRAS, 420, 1848
- Draper & Ballantyne (2010) Draper, A. R., & Ballantyne, D. R. 2010, ApJ, 715, L99
- Eguchi et al. (2011) Eguchi, S., Ueda, Y., Awaki, H., et al. 2011, ApJ, 729, 31
- Eguchi et al. (2009) Eguchi, S., Ueda, Y., Terashima, Y., Mushotzky, R., & Tueller, J. 2009, ApJ, 696, 1657
- Esposito & Walter (2016) Esposito, V., & Walter, R. 2016, A&A, 590, A49
- Evans et al. (2004) Evans, D. A., Kraft, R. P., Worrall, D. M., et al. 2004, ApJ, 612, 786
- Evans et al. (2009) Evans, P. A., Beardmore, A. P., Page, K. L., et al. 2009, MNRAS, 397, 1177
- Fabian et al. (2000) Fabian, A. C., Iwasawa, K., Reynolds, C. S., & Young, A. J. 2000, PASP, 112, 1145
- Fabian et al. (2015) Fabian, A. C., Lohfink, A., Kara, E., et al. 2015, MNRAS, 451, 4375
- Fabian et al. (2009) Fabian, A. C., Zoghbi, A., Ross, R. R., et al. 2009, Nature, 459, 540
- Ferrarese & Merritt (2000) Ferrarese, L., & Merritt, D. 2000, ApJ, 539, L9
- Fossati et al. (1998) Fossati, G., Maraschi, L., Celotti, A., Comastri, A., & Ghisellini, G. 1998, MNRAS, 299, 433
- Fruscione et al. (2006) Fruscione, A., McDowell, J. C., Allen, G. E., et al. 2006, in Proc. SPIE, Vol. 6270, Society of Photo-Optical Instrumentation Engineers (SPIE) Conference Series, 62701V
- Gabriel et al. (2004) Gabriel, C., Denby, M., Fyfe, D. J., et al. 2004, in Astronomical Society of the Pacific Conference Series, Vol. 314, Astronomical Data Analysis Software and Systems (ADASS) XIII, ed. F. Ochsenbein, M. G. Allen, & D. Egret, 759
- Gandhi et al. (2007) Gandhi, P., Fabian, A. C., Suebsuwong, T., et al. 2007, MNRAS, 382, 1005
- Gandhi et al. (2015) Gandhi, P., Hönig, S. F., & Kishimoto, M. 2015, ApJ, 812, 113
- Gandhi et al. (2009) Gandhi, P., Horst, H., Smette, A., et al. 2009, A&A, 502, 457
- Gandhi et al. (2011) Gandhi, P., Isobe, N., Birkinshaw, M., et al. 2011, PASJ, 63, 505
- Gandhi et al. (2014) Gandhi, P., Lansbury, G. B., Alexander, D. M., et al. 2014, ApJ, 792, 117
- Garmire et al. (2003) Garmire, G. P., Bautz, M. W., Ford, P. G., Nousek, J. A., & Ricker, Jr., G. R. 2003, in Society of Photo-Optical Instrumentation Engineers (SPIE) Conference Series, Vol. 4851, X-Ray and Gamma-Ray Telescopes and Instruments for Astronomy., ed. J. E. Truemper & H. D. Tananbaum, 28–44
- Gebhardt et al. (2000) Gebhardt, K., Bender, R., Bower, G., et al. 2000, ApJ, 539, L13
- Gehrels et al. (2004) Gehrels, N., Chincarini, G., Giommi, P., et al. 2004, ApJ, 611, 1005
- George et al. (1998) George, I. M., Turner, T. J., Netzer, H., et al. 1998, ApJS, 114, 73
- Ghisellini et al. (2010) Ghisellini, G., Tavecchio, F., Foschini, L., et al. 2010, MNRAS, 402, 497
- Giacconi et al. (1962) Giacconi, R., Gursky, H., Paolini, F. R., & Rossi, B. B. 1962, Physical Review Letters, 9, 439
- Gierliński & Done (2004) Gierliński, M., & Done, C. 2004, MNRAS, 349, L7
- Gilli et al. (2007) Gilli, R., Comastri, A., & Hasinger, G. 2007, A&A, 463, 79
- Gofford et al. (2013) Gofford, J., Reeves, J. N., Tombesi, F., et al. 2013, MNRAS, 430, 60
- Guainazzi & Bianchi (2007) Guainazzi, M., & Bianchi, S. 2007, MNRAS, 374, 1290
- Guainazzi et al. (2005) Guainazzi, M., Piconcelli, E., Jiménez-Bailón, E., & Matt, G. 2005, A&A, 429, L9
- Haardt & Maraschi (1991) Haardt, F., & Maraschi, L. 1991, ApJ, 380, L51
- Haardt et al. (1998) Haardt, F., Fossati, G., Grandi, P., et al. 1998, A&A, 340, 35
- Hardcastle et al. (2006) Hardcastle, M. J., Evans, D. A., & Croston, J. H. 2006, MNRAS, 370, 1893
- Hardcastle et al. (2009) —. 2009, MNRAS, 396, 1929
- Harrison et al. (2013) Harrison, F. A., Craig, W. W., Christensen, F. E., et al. 2013, ApJ, 770, 103
- Harrison et al. (2016) Harrison, F. A., Aird, J., Civano, F., et al. 2016, ApJ, 831, 185
- Hogg et al. (2012) Hogg, J. D., Winter, L. M., Mushotzky, R. F., Reynolds, C. S., & Trippe, M. 2012, ApJ, 752, 153
- Hönig et al. (2014) Hönig, S. F., Gandhi, P., Asmus, D., et al. 2014, MNRAS, 438, 647
- Ichikawa et al. (2017) Ichikawa, K., Ricci, C., Ueda, Y., et al. 2017, ApJ, 835, 74
- Ichikawa et al. (2012) Ichikawa, K., Ueda, Y., Terashima, Y., et al. 2012, ApJ, 754, 45
- Ilbert et al. (2006) Ilbert, O., Arnouts, S., McCracken, H. J., et al. 2006, A&A, 457, 841
- Inoue & Totani (2009) Inoue, Y., & Totani, T. 2009, ApJ, 702, 523
- Ishisaki et al. (2007) Ishisaki, Y., Maeda, Y., Fujimoto, R., et al. 2007, PASJ, 59, 113
- Iwasawa et al. (2011) Iwasawa, K., Sanders, D. B., Teng, S. H., et al. 2011, A&A, 529, A106
- Iwasawa et al. (2012) Iwasawa, K., Mainieri, V., Brusa, M., et al. 2012, A&A, 537, A86
- Jansen et al. (2001) Jansen, F., Lumb, D., Altieri, B., et al. 2001, A&A, 365, L1
- Kaastra et al. (2000) Kaastra, J. S., Mewe, R., Liedahl, D. A., Komossa, S., & Brinkman, A. C. 2000, A&A, 354, L83
- Kalberla et al. (2005) Kalberla, P. M. W., Burton, W. B., Hartmann, D., et al. 2005, A&A, 440, 775
- Kallman & Bautista (2001) Kallman, T., & Bautista, M. 2001, ApJS, 133, 221
- Kaspi et al. (2000) Kaspi, S., Brandt, W. N., Netzer, H., et al. 2000, ApJ, 535, L17
- Kataoka et al. (2007) Kataoka, J., Reeves, J. N., Iwasawa, K., et al. 2007, PASJ, 59, 279
- Kawamuro et al. (2016a) Kawamuro, T., Ueda, Y., Tazaki, F., Ricci, C., & Terashima, Y. 2016a, ApJS, 225, 14
- Kawamuro et al. (2016b) Kawamuro, T., Ueda, Y., Tazaki, F., Terashima, Y., & Mushotzky, R. 2016b, ApJ, 831, 37
- Komossa et al. (2003) Komossa, S., Burwitz, V., Hasinger, G., et al. 2003, ApJ, 582, L15
- Kormendy & Ho (2013) Kormendy, J., & Ho, L. C. 2013, ARA&A, 51, 511
- Kormendy & Richstone (1995) Kormendy, J., & Richstone, D. 1995, ARA&A, 33, 581
- Koss et al. (2013) Koss, M., Mushotzky, R., Baumgartner, W., et al. 2013, ApJ, 765, L26
- Koss et al. (2012) Koss, M., Mushotzky, R., Treister, E., et al. 2012, ApJ, 746, L22
- Koss et al. (2010) Koss, M., Mushotzky, R., Veilleux, S., & Winter, L. 2010, ApJ, 716, L125
- Koss et al. (2011a) Koss, M., Mushotzky, R., Veilleux, S., et al. 2011a, ApJ, 739, 57
- Koss et al. (2011b) Koss, M., Mushotzky, R., Treister, E., et al. 2011b, ApJ, 735, L42
- Koss et al. (2017) Koss, M., Trakhtenbrot, B., Ricci, C., et al. 2017, ArXiv e-prints
- Koss et al. (2015) Koss, M. J., Romero-Cañizales, C., Baronchelli, L., et al. 2015, ApJ, 807, 149
- Koss et al. (2016a) Koss, M. J., Assef, R., Baloković, M., et al. 2016a, ApJ, 825, 85
- Koss et al. (2016b) Koss, M. J., Glidden, A., Baloković, M., et al. 2016b, ApJ, 824, L4
- Koyama et al. (2007) Koyama, K., Tsunemi, H., Dotani, T., et al. 2007, PASJ, 59, 23
- Krimm et al. (2013) Krimm, H. A., Holland, S. T., Corbet, R. H. D., et al. 2013, ApJS, 209, 14
- Lamperti et al. (2017) Lamperti, I., Koss, M., Trakhtenbrot, B., et al. 2017, MNRAS, 467, 540
- Lansbury et al. (2015) Lansbury, G. B., Gandhi, P., Alexander, D. M., et al. 2015, ApJ, 809, 115
- Lansbury et al. (2017a) Lansbury, G. B., Alexander, D. M., Aird, J., et al. 2017a, ApJ, 846, 20
- Lansbury et al. (2017b) Lansbury, G. B., Stern, D., Aird, J., et al. 2017b, ApJ, 836, 99
- Lubiński et al. (2016) Lubiński, P., Beckmann, V., Gibaud, L., et al. 2016, MNRAS, 458, 2454
- Lutovinov et al. (2012) Lutovinov, A. A., Burenin, R. A., Revnivtsev, M. G., & Bikmaev, I. F. 2012, Astronomy Letters, 38, 1
- Lutz et al. (2004) Lutz, D., Maiolino, R., Spoon, H. W. W., & Moorwood, A. F. M. 2004, A&A, 418, 465
- Magdziarz & Zdziarski (1995) Magdziarz, P., & Zdziarski, A. A. 1995, MNRAS, 273, 837
- Malizia et al. (2012) Malizia, A., Bassani, L., Bazzano, A., et al. 2012, MNRAS, 426, 1750
- Malizia et al. (2000) Malizia, A., Bassani, L., & Negueruela, I. 2000, A&A, 359, 509
- Malizia et al. (2010) Malizia, A., Bassani, L., Sguera, V., et al. 2010, MNRAS, 408, 975
- Malizia et al. (2016) Malizia, A., Landi, R., Molina, M., et al. 2016, MNRAS, 460, 19
- Malizia et al. (2014) Malizia, A., Molina, M., Bassani, L., et al. 2014, ApJ, 782, L25
- Marchese et al. (2014) Marchese, E., Braito, V., Reeves, J. N., et al. 2014, MNRAS, 437, 2806
- Marchesi et al. (2017) Marchesi, S., Ajello, M., Comastri, A., et al. 2017, ApJ, 836, 116
- Marinucci et al. (2011) Marinucci, A., Bianchi, S., Matt, G., et al. 2011, A&A, 526, A36
- Marinucci et al. (2016) Marinucci, A., Tortosa, A., & NuSTAR AGN Physics Working Group. 2016, Astronomische Nachrichten, 337, 490
- Marinucci et al. (2014a) Marinucci, A., Matt, G., Kara, E., et al. 2014a, MNRAS, 440, 2347
- Marinucci et al. (2014b) Marinucci, A., Matt, G., Miniutti, G., et al. 2014b, ApJ, 787, 83
- Marinucci et al. (2015) Marinucci, A., Matt, G., Bianchi, S., et al. 2015, MNRAS, 447, 160
- Markwardt et al. (2005) Markwardt, C. B., Tueller, J., Skinner, G. K., et al. 2005, ApJ, 633, L77
- Martin et al. (2005) Martin, D. C., Fanson, J., Schiminovich, D., et al. 2005, ApJ, 619, L1
- Maselli et al. (2013) Maselli, A., Massaro, F., Cusumano, G., et al. 2013, ApJS, 206, 17
- Masetti et al. (2009) Masetti, N., Parisi, P., Palazzi, E., et al. 2009, A&A, 495, 121
- Masetti et al. (2010a) —. 2010a, A&A, 519, A96
- Masetti et al. (2010b) —. 2010b, A&A, 519, A96
- Masetti et al. (2012) Masetti, N., Parisi, P., Jiménez-Bailón, E., et al. 2012, A&A, 538, A123
- Massaro et al. (2009) Massaro, E., Giommi, P., Leto, C., et al. 2009, A&A, 495, 691
- Massaro et al. (2015) Massaro, E., Maselli, A., Leto, C., et al. 2015, Ap&SS, 357, 75
- Matt et al. (1991) Matt, G., Perola, G. C., & Piro, L. 1991, A&A, 247, 25
- Matt et al. (2014) Matt, G., Marinucci, A., Guainazzi, M., et al. 2014, MNRAS, 439, 3016
- Matt et al. (2015) Matt, G., Baloković, M., Marinucci, A., et al. 2015, MNRAS, 447, 3029
- Mehdipour et al. (2011) Mehdipour, M., Branduardi-Raymont, G., Kaastra, J. S., et al. 2011, A&A, 534, A39
- Meléndez et al. (2014) Meléndez, M., Mushotzky, R. F., Shimizu, T. T., Barger, A. J., & Cowie, L. L. 2014, ApJ, 794, 152
- Meléndez et al. (2008) Meléndez, M., Kraemer, S. B., Armentrout, B. K., et al. 2008, ApJ, 682, 94
- Miniutti & Fabian (2004) Miniutti, G., & Fabian, A. C. 2004, MNRAS, 349, 1435
- Mitsuda et al. (2007) Mitsuda, K., Bautz, M., Inoue, H., et al. 2007, PASJ, 59, 1
- Murphy & Yaqoob (2009) Murphy, K. D., & Yaqoob, T. 2009, MNRAS, 397, 1549
- Mushotzky et al. (1993) Mushotzky, R. F., Done, C., & Pounds, K. A. 1993, ARA&A, 31, 717
- Mushotzky et al. (1995) Mushotzky, R. F., Fabian, A. C., Iwasawa, K., et al. 1995, MNRAS, 272, L9
- Mushotzky et al. (2014) Mushotzky, R. F., Shimizu, T. T., Meléndez, M., & Koss, M. 2014, ApJ, 781, L34
- Mushotzky et al. (2008) Mushotzky, R. F., Winter, L. M., McIntosh, D. H., & Tueller, J. 2008, ApJ, 684, L65
- Nandra (2006) Nandra, K. 2006, MNRAS, 368, L62
- Nandra et al. (1997) Nandra, K., George, I. M., Mushotzky, R. F., Turner, T. J., & Yaqoob, T. 1997, ApJ, 477, 602
- Nandra & Pounds (1994) Nandra, K., & Pounds, K. A. 1994, MNRAS, 268, 405
- Netzer (2013) Netzer, H. 2013, The Physics and Evolution of Active Galactic Nuclei
- Netzer (2015) —. 2015, ARA&A, 53, 365
- Neugebauer et al. (1984) Neugebauer, G., Habing, H. J., van Duinen, R., et al. 1984, ApJ, 278, L1
- Noguchi et al. (2010) Noguchi, K., Terashima, Y., Ishino, Y., et al. 2010, ApJ, 711, 144
- Oda et al. (2017) Oda, S., Tanimoto, A., Ueda, Y., et al. 2017, ApJ, 835, 179
- Oh et al. (2017a) Oh, K., et al. 2017a, submitted to ApJS
- Oh et al. (2017b) Oh, K., Schawinski, K., Koss, M., et al. 2017b, MNRAS, 464, 1466
- Onori et al. (2017a) Onori, F., La Franca, F., Ricci, F., et al. 2017a, MNRAS, 464, 1783
- Onori et al. (2017b) Onori, F., Ricci, F., La Franca, F., et al. 2017b, MNRAS, 468, L97
- Page et al. (2003) Page, M. J., Breeveld, A. A., Soria, R., et al. 2003, A&A, 400, 145
- Paltani et al. (2008) Paltani, S., Walter, R., McHardy, I. M., et al. 2008, A&A, 485, 707
- Panessa et al. (2008) Panessa, F., Bassani, L., de Rosa, A., et al. 2008, A&A, 483, 151
- Parisi et al. (2009) Parisi, P., Masetti, N., Jiménez-Bailón, E., et al. 2009, A&A, 507, 1345
- Parisi et al. (2012) —. 2012, A&A, 545, A101
- Parisi et al. (2014) Parisi, P., Masetti, N., Rojas, A. F., et al. 2014, A&A, 561, A67
- Parker et al. (2014) Parker, M. L., Wilkins, D. R., Fabian, A. C., et al. 2014, MNRAS, 443, 1723
- Patrick et al. (2012) Patrick, A. R., Reeves, J. N., Porquet, D., et al. 2012, MNRAS, 426, 2522
- Piconcelli et al. (2011) Piconcelli, E., Bianchi, S., Vignali, C., Jiménez-Bailón, E., & Fiore, F. 2011, A&A, 534, A126
- Piconcelli et al. (2005) Piconcelli, E., Jimenez-Bailón, E., Guainazzi, M., et al. 2005, A&A, 432, 15
- Polletta et al. (2007) Polletta, M., Tajer, M., Maraschi, L., et al. 2007, ApJ, 663, 81
- Puccetti et al. (2016) Puccetti, S., Comastri, A., Bauer, F. E., et al. 2016, A&A, 585, A157
- Ramos Almeida & Ricci (2017) Ramos Almeida, C., & Ricci, C. 2017, ArXiv e-prints
- Ranalli et al. (2008) Ranalli, P., Comastri, A., Origlia, L., & Maiolino, R. 2008, MNRAS, 386, 1464
- Reeves et al. (2008) Reeves, J., Done, C., Pounds, K., et al. 2008, MNRAS, 385, L108
- Reeves & Turner (2000) Reeves, J. N., & Turner, M. J. L. 2000, MNRAS, 316, 234
- Reynolds (1997) Reynolds, C. S. 1997, MNRAS, 286, 513
- Reynolds (2014) —. 2014, Space Sci. Rev., 183, 277
- Ricci et al. (2010) Ricci, C., Beckmann, V., Audard, M., & Courvoisier, T. J.-L. 2010, A&A, 518, A47
- Ricci et al. (2013a) Ricci, C., Paltani, S., Awaki, H., et al. 2013a, A&A, 553, A29
- Ricci et al. (2013b) Ricci, C., Paltani, S., Ueda, Y., & Awaki, H. 2013b, MNRAS, 435, 1840
- Ricci et al. (2014a) Ricci, C., Ueda, Y., Ichikawa, K., et al. 2014a, A&A, 567, A142
- Ricci et al. (2015) Ricci, C., Ueda, Y., Koss, M. J., et al. 2015, ApJ, 815, L13
- Ricci et al. (2014b) Ricci, C., Ueda, Y., Paltani, S., et al. 2014b, MNRAS, 441, 3622
- Ricci et al. (2011) Ricci, C., Walter, R., Courvoisier, T. J.-L., & Paltani, S. 2011, A&A, 532, A102
- Ricci et al. (2016a) Ricci, C., Bauer, F. E., Arevalo, P., et al. 2016a, ApJ, 820, 5
- Ricci et al. (2016b) Ricci, C., Bauer, F. E., Treister, E., et al. 2016b, ApJ, 819, 4
- Ricci et al. (2017a) —. 2017a, MNRAS, 468, 1273
- Ricci et al. (2017b) Ricci, C., Assef, R. J., Stern, D., et al. 2017b, ApJ, 835, 105
- Ricci et al. (2017c) Ricci, C., Trakhtenbrot, B., Koss, M. J., et al. 2017c, Nature, 549, 488
- Ricci et al. (2017d) Ricci, F., La Franca, F., Onori, F., & Bianchi, S. 2017d, A&A, 598, A51
- Rodriguez et al. (2008) Rodriguez, J., Tomsick, J. A., & Chaty, S. 2008, A&A, 482, 731
- Salvato et al. (2009) Salvato, M., Hasinger, G., Ilbert, O., et al. 2009, ApJ, 690, 1250
- Salvato et al. (2011) Salvato, M., Ilbert, O., Hasinger, G., et al. 2011, ApJ, 742, 61
- Sambruna et al. (2010) Sambruna, R. M., Donato, D., Ajello, M., et al. 2010, ApJ, 710, 24
- Schawinski et al. (2015) Schawinski, K., Koss, M., Berney, S., & Sartori, L. F. 2015, MNRAS, 451, 2517
- Schawinski et al. (2006) Schawinski, K., Khochfar, S., Kaviraj, S., et al. 2006, Nature, 442, 888
- Scott et al. (2012) Scott, A. E., Stewart, G. C., & Mateos, S. 2012, MNRAS, 423, 2633
- Scott et al. (2011) Scott, A. E., Stewart, G. C., Mateos, S., et al. 2011, MNRAS, 417, 992
- Segreto et al. (2010) Segreto, A., Cusumano, G., Ferrigno, C., et al. 2010, A&A, 510, A47
- She et al. (2017a) She, R., Ho, L. C., & Feng, H. 2017a, ApJ, 842, 131
- She et al. (2017b) —. 2017b, ApJ, 835, 223
- Shimizu et al. (2016) Shimizu, T. T., Meléndez, M., Mushotzky, R. F., et al. 2016, MNRAS, 456, 3335
- Shimizu & Mushotzky (2013) Shimizu, T. T., & Mushotzky, R. F. 2013, ApJ, 770, 60
- Shimizu et al. (2015) Shimizu, T. T., Mushotzky, R. F., Meléndez, M., Koss, M., & Rosario, D. J. 2015, MNRAS, 452, 1841
- Shu et al. (2010) Shu, X. W., Yaqoob, T., & Wang, J. X. 2010, ApJS, 187, 581
- Shu et al. (2011) —. 2011, ApJ, 738, 147
- Singh et al. (2014) Singh, K. P., Tandon, S. N., Agrawal, P. C., et al. 2014, in Proc. SPIE, Vol. 9144, Space Telescopes and Instrumentation 2014: Ultraviolet to Gamma Ray, 91441S
- Skrutskie et al. (2006) Skrutskie, M. F., Cutri, R. M., Stiening, R., et al. 2006, AJ, 131, 1163
- Smith et al. (2014) Smith, K. L., Koss, M., & Mushotzky, R. F. 2014, ApJ, 794, 112
- Soldi et al. (2008) Soldi, S., Türler, M., Paltani, S., et al. 2008, A&A, 486, 411
- Soldi et al. (2014) Soldi, S., Beckmann, V., Baumgartner, W. H., et al. 2014, A&A, 563, A57
- Stern (2015) Stern, D. 2015, ApJ, 807, 129
- Stern et al. (2014) Stern, D., Lansbury, G. B., Assef, R. J., et al. 2014, ApJ, 794, 102
- Stroh & Falcone (2013) Stroh, M. C., & Falcone, A. D. 2013, ApJS, 207, 28
- Strüder et al. (2001) Strüder, L., Briel, U., Dennerl, K., et al. 2001, A&A, 365, L18
- Tanimoto et al. (2016) Tanimoto, A., Ueda, Y., Kawamuro, T., & Ricci, C. 2016, PASJ, 68, S26
- Taylor (2005) Taylor, M. B. 2005, in Astronomical Society of the Pacific Conference Series, Vol. 347, Astronomical Data Analysis Software and Systems XIV, ed. P. Shopbell, M. Britton, & R. Ebert, 29
- Tazaki et al. (2011) Tazaki, F., Ueda, Y., Terashima, Y., & Mushotzky, R. F. 2011, ApJ, 738, 70
- Tazaki et al. (2013) Tazaki, F., Ueda, Y., Terashima, Y., Mushotzky, R. F., & Tombesi, F. 2013, ApJ, 772, 38
- Teng et al. (2011) Teng, S. H., Mushotzky, R. F., Sambruna, R. M., Davis, D. S., & Reynolds, C. S. 2011, ApJ, 742, 66
- Tombesi et al. (2013) Tombesi, F., Cappi, M., Reeves, J. N., et al. 2013, MNRAS, 430, 1102
- Tombesi et al. (2010a) —. 2010a, A&A, 521, A57
- Tombesi et al. (2010b) Tombesi, F., Sambruna, R. M., Reeves, J. N., et al. 2010b, ApJ, 719, 700
- Tortosa et al. (2017) Tortosa, A., Marinucci, A., Matt, G., et al. 2017, MNRAS, 466, 4193
- Trakhtenbrot et al. (2017) Trakhtenbrot, B., Ricci, C., Koss, M. J., et al. 2017, MNRAS, 470, 800
- Treister & Urry (2005) Treister, E., & Urry, C. M. 2005, ApJ, 630, 115
- Treister & Urry (2006) —. 2006, ApJ, 652, L79
- Treister et al. (2009) Treister, E., Urry, C. M., & Virani, S. 2009, ApJ, 696, 110
- Tremaine et al. (2002) Tremaine, S., Gebhardt, K., Bender, R., et al. 2002, ApJ, 574, 740
- Tueller et al. (2008) Tueller, J., Mushotzky, R. F., Barthelmy, S., et al. 2008, ApJ, 681, 113
- Tueller et al. (2010) Tueller, J., Baumgartner, W. H., Markwardt, C. B., et al. 2010, ApJS, 186, 378
- Turner & Miller (2009) Turner, T. J., & Miller, L. 2009, A&A Rev., 17, 47
- Turner et al. (2001) Turner, T. J., Nandra, K., Turcan, D., & George, I. M. 2001, X-ray Astronomy: Stellar Endpoints, AGN, and the Diffuse X-ray Background, 599, 991
- Ueda et al. (2014) Ueda, Y., Akiyama, M., Hasinger, G., Miyaji, T., & Watson, M. G. 2014, ApJ, 786, 104
- Ueda et al. (2003) Ueda, Y., Akiyama, M., Ohta, K., & Miyaji, T. 2003, ApJ, 598, 886
- Ueda et al. (2007) Ueda, Y., Eguchi, S., Terashima, Y., et al. 2007, ApJ, 664, L79
- Ueda et al. (2015) Ueda, Y., Hashimoto, Y., Ichikawa, K., et al. 2015, ApJ, 815, 1
- Ulrich et al. (1997) Ulrich, M.-H., Maraschi, L., & Urry, C. M. 1997, ARA&A, 35, 445
- Ursini et al. (2015) Ursini, F., Marinucci, A., Matt, G., et al. 2015, MNRAS, 452, 3266
- Vasudevan et al. (2013a) Vasudevan, R. V., Brandt, W. N., Mushotzky, R. F., et al. 2013a, ApJ, 763, 111
- Vasudevan et al. (2016) Vasudevan, R. V., Fabian, A. C., Reynolds, C. S., et al. 2016, MNRAS, 458, 2012
- Vasudevan et al. (2013b) Vasudevan, R. V., Mushotzky, R. F., & Gandhi, P. 2013b, ApJ, 770, L37
- Vasudevan et al. (2014) Vasudevan, R. V., Mushotzky, R. F., Reynolds, C. S., et al. 2014, ApJ, 785, 30
- Vasudevan et al. (2009) Vasudevan, R. V., Mushotzky, R. F., Winter, L. M., & Fabian, A. C. 2009, MNRAS, 399, 1553
- Weaver et al. (2010) Weaver, K. A., Meléndez, M., Mushotzky, R. F., et al. 2010, ApJ, 716, 1151
- Weisskopf et al. (2000) Weisskopf, M. C., Tananbaum, H. D., Van Speybroeck, L. P., & O’Dell, S. L. 2000, in Society of Photo-Optical Instrumentation Engineers (SPIE) Conference Series, Vol. 4012, X-Ray Optics, Instruments, and Missions III, ed. J. E. Truemper & B. Aschenbach, 2–16
- Wenger et al. (2000) Wenger, M., Ochsenbein, F., Egret, D., et al. 2000, A&AS, 143, 9
- Wilms et al. (2000) Wilms, J., Allen, A., & McCray, R. 2000, ApJ, 542, 914
- Winkler et al. (2003) Winkler, C., Courvoisier, T. J.-L., Di Cocco, G., et al. 2003, A&A, 411, L1
- Winter et al. (2010) Winter, L. M., Lewis, K. T., Koss, M., et al. 2010, ApJ, 710, 503
- Winter et al. (2009a) Winter, L. M., Mushotzky, R. F., Reynolds, C. S., & Tueller, J. 2009a, ApJ, 690, 1322
- Winter et al. (2009b) Winter, L. M., Mushotzky, R. F., Terashima, Y., & Ueda, Y. 2009b, ApJ, 701, 1644
- Winter et al. (2008) Winter, L. M., Mushotzky, R. F., Tueller, J., & Markwardt, C. 2008, ApJ, 674, 686
- Winter et al. (2012) Winter, L. M., Veilleux, S., McKernan, B., & Kallman, T. R. 2012, ApJ, 745, 107
- Wong et al. (2016) Wong, O. I., Koss, M. J., Schawinski, K., et al. 2016, MNRAS, 460, 1588
- Wright et al. (2010) Wright, E. L., Eisenhardt, P. R. M., Mainzer, A. K., et al. 2010, AJ, 140, 1868
- Young et al. (2001) Young, A. J., Wilson, A. S., & Shopbell, P. L. 2001, ApJ, 556, 6
Appendix A New soft X-ray counterparts
We found a different X-ray counterpart than that reported by the Swift/BAT 70 months catalog and by the studies reported above for only eight sources. In the following we report details about these objects.
SWIFT J0216.3+5128. The X-ray counterpart reported in the BAT catalog is 2MASX J02162987+5126246. The source is instead more likely associated to the X-ray bright Seyfert 2 IGR J02164+5126/2MASS J02162672+5125251, which is clearly detected in the 10.0 ks XMM-Newton EPIC/PN observation (see also Masetti et al. 2009).
SWIFT J0223.4+4551. The Swift/BAT source was identified with the triplet of galaxies V Zw 232, but the X-ray counterpart of this object is the central galaxy, 2MASX J02233309+4549162.
SWIFT J0350.15019. The source is reported as being the counterpart of 2MASX J035023775018354. Besides 2MASX J035023775018354, three other X-ray sources are evident around the BAT position of the sources: 2MASX J035011985017165, 2MASX J035023775018354 and ESO 2014. The first two objects are too weak to be the counterpart of the Swift/BAT source, while the CT AGN ESO 2014 is at a flux level consistent with that of SWIFT J0350.15019.
SWIFT J0528.13933. The source is identified with the interacting galaxy pair ESO 306IG001. From the analysis of the XMM-Newton image we found that the X-ray counterpart of this source is ESO 306IG001 NED01.
SWIFTJ0654.6+0700. This object was previously identified with 2MASS J06543368+0703024 (also in Cusumano et al. 2010b), while we find that the right counterpart is 2MASS J06543417+0703210 (see also Parisi et al. 2014). The new identification is coincident with a bright WISE source.
SWIFT J0744.0+2914. The 10.8 ks Chandra/ACIS observation did not detect the counterpart reported in the 70-month BAT catalog, UGC 03995A. The most likely counterpart of SWIFT J0744.0+2914 is the nearby galaxy UGC 03995B, which is detected in the 0.3–10 keV band and is interacting with UGC 03995A (Koss et al. 2012).
SWIFT J0919.2+5528. The counterpart is not SBS 0915+556, as reported in the 70-month catalog, but it is the CT AGN Mrk 106, which is significantly brighter and closer to the position of the hard X-ray source than SBS 0915+556.
SWIFT J1238.6+0928. The source was identified as being the hard X-ray counterpart of the galaxy VCC 1759. VCC 1759 was not detected in the 20.1 ks XMM-Newton EPIC/PN image, and the most likely counterpart for SWIFT J1238.6+0928 is the Seyfert 2 2MASX J12384342+0927362 (see also Malizia et al. 2016).
SWIFTJ1354.5+1326. The source was originally identified with 2MASX J13542913+1328068, which is part of an interacting galaxy pair with 2MASS J13542908+1327571 (at a distance of 10′′). However, the former object is not detected in WISE, while the latter has an infrared brightness consistent with what is expected from its intrinsic X-ray flux. Therefore, it is more likely that the Swift/BAT source is associated with 2MASS J13542908+1327571.
SWIFT J1535.85749. The 0.3–10 keV counterpart of the source is IGR J153605750 (Malizia et al. 2010), which is brighter and closer to the BAT position than the object reported in the BAT catalog, 1RXS J153552.8575055.
SWIFTJ1747.8+6837B. The source was identified with VII Zw 742, a system made of an interacting pair of galaxies (2MASX J17465994+6836392 and 2MASS J17465953+6836303) with a separation of . The two sources are blended in WISE, with the southern one being brighter. The Swift/XRT observation of this source showed that the position of the X-ray counterpart coincides with that of 2MASS J17465953+6836303.
SWIFTJ1856.1+1539. This object was originally identified with 2MASX J18560128+1538059. However, the right counterpart is more likely to be 2MASS J18560056+1537584, which has a bright, red WISE counterpart. This new identification is supported by what is reported by Rodriguez et al. (2008).
SWIFT J2007.03433. The Chandra/ACIS 0.3–10 keV image shows that the X-ray counterpart is not ESO 39920, but the nearby galaxy MCG 0644018, with which ESO 39920 is interacting.
Appendix B Dual AGN
Several objects in our sample are known to be dual AGN (e.g., Koss et al. 2012), in the following we discuss the influence of the two sources on the Swift/BAT emission and list the cases in which the X-ray spectral properties of both sources are reported in our catalog. Those objects are listed as D1 and D2.
SWIFT J0209.51010. This object is the combination of two AGN at : NGC 833 and NGC 835 with the former having a 2–10 keV flux of the latter (Koss et al. 2011b). Due to the fact that both sources contribute to the 14–195 keV flux we report the spectral characteristics of both NGC 833 (SWIFT J0209.5-1010D1) and NGC 835 (SWIFT J0209.5-1010D2).
SWIFT J0324.9+4044. This object is composed of two AGN at from each other: IRAS 03219+4031 and 2MASX J03251221+4042021. In the 2–10 keV band IRAS 03219+4031 is times brighter than 2MASX J03251221+4042021 (Koss et al. 2011b), and was therefore considered to be the counterpart of the Swift/BAT source.
SWIFT J0602.2+2829. This source is composed of IRAS 05589+2828 and 2MASX J06021107+2828382 (at a distance of ), with the former having a 2–10 keV X-ray flux 1100 higher than the latter (Koss et al. 2011b).
SWIFT J0945.61420. This object is composed by two sources at from each other: NGC 2992 and NGC 2993. Since the former AGN is times brighter in the 2–10 keV band than the latter (Koss et al. 2011b) it was considered as the counterpart of SWIFT J0945.61420.
SWIFT J1023.5+1952. This dual AGN is composed of NGC 3227 and NGC 3226, located at from each other. In the 2–10 keV band NGC 3227 is times brighter than NGC 3226 (Koss et al. 2011b), and was therefore assumed to be the counterpart of SWIFT J1023.5+1952.
SWIFT J1136.0+2132. The counterpart of this source is a late-stage galaxy merger composed of two nuclei with a projected separation of 3.4 kpc (): Mrk 739E and Mrk 739W (Koss et al. 2011b). The 2–10 observed flux of Mrk 739W is of that of Mrk 739E (Koss et al. 2011b), and the latter source was reported as the counterpart of the BAT AGN.
SWIFT J1315.8+4420. This source is composed of UGC 8327 NED01 and UGC 8327 NED02, located at from each other. The 2–10 keV flux of UGC 8327 NED01 is times higher than that of UGC 8327 NED02 (Koss et al. 2011b), and this source was therefore considered to be the counterpart of the Swift/BAT object.
SWIFT J1334.82328. The XMM-Newton EPIC/PN image reveals that, within the error box of the Swift/BAT position, both members of the interacting pair ESO 509IG066 (Guainazzi et al. 2005) are detected. These two sources are ESO 509IG066E/NED02 (SWIFT J1334.82328D1) and ESO 509IG066W/NED01 (SWIFT J1334.82328D2), with the eastern component having a 2–10 keV flux of the western component.
SWIFT J1341.2+3023. The source is composed of two objects at : Mrk 268 and Mrk 268SE. The counterpart of the Swift/BAT source is Mrk 268, since it has a 2–10 keV flux times higher than that of its companion (Koss et al. 2011b).
SWIFT J1355.9+1822. This source is another known dual AGN, with the two nuclei (Mrk 463E and Mrk 463W, at ) having a projected separation of 3.4 kpc (Bianchi et al. 2008a). The Chandra study of (Bianchi et al. 2008a) showed that both nuclei are obscured, and (Koss et al. 2011b) reported that the 2–10 keV observed flux of Mrk 463W is that of Mrk 463E.
SWIFT J1652.9+0223. The luminous infrared galaxy NGC 6240 is known to host two Compton-thick AGN separated by 0.7 kpc (): NGC 6240N and NGC 6240S (Komossa et al. 2003). The two sources have comparable observed 2–10 keV fluxes (Koss et al. 2011b), and Puccetti et al. (2016) have recently shown that both sources contribute significantly to the flux above 10 keV. The intrinsic 10–40 keV luminosities are and for the southern and northern nucleus, respectively (Puccetti et al. 2016). Since the XMM-Newton observation used here lacks the spatial resolution to resolve the two nuclei the system was considered to be one source.
SWIFT J1816.0+4236. The source is composed of UGC 11185 NED01 and UGC 11185 NED02 (at ). Since UGC 11185 NED02 has a 2–10 keV flux times larger than UGC 11185 NED01 (Koss et al. 2011b), it was considered to be the counterpart of the BAT source.
SWIFT J2028.5+2543. This source is a combination of two objects at from each other: NGC 6921 and MCG +0448002, with the former AGN contributing to of the 14–195 keV flux. Since the two AGN contribute significantly to the Swift/BAT flux we reported the characteristics of both NGC 6921 (SWIFT J2028.5+2543D1) and MCG +0448002 (SWIFT J2028.5+2543D2) in the catalog.
SWIFT J2328.9+0328. This object is the combination of the unobscured AGN NGC 7679 and the CT AGN NGC 7682 (at ). Since NGC 7679 contributes to only of the 14–195 keV flux, we adopted NGC 7682 as the counterpart of the Swift/BAT source.
Appendix C The starburst galaxy SWIFT J0956.1+6942 (M 82)
The starburst galaxy M 82 does not host an AGN, and its broad-band X-ray spectrum was fitted with the D1 model (§IV.2.4; ). We obtained a photon index of , a cutoff energy of keV, and temperatures of the thermal plasma of keV and keV. The column density of the neutral material obscuring the cutoff power law component is , while that of the material obscuring the thermal plasma is . The cross calibration constant between the XMM-Newton and the Swift/BAT spectrum is consistent with unity ().
The observed fluxes in the 2–10 and 14–195 keV bands are and , respectively. The intrinsic fluxes in the 2–10, 20–50 and 14–150 keV bands are , and , respectively. The intrinsic luminosities, in the same energy ranges, are: , and .
| (1) | (2) | (3) | (4) | (5) | (6) | (7) |
|---|---|---|---|---|---|---|
| Source | Counterpart | RA | DEC | Redshift | Distance [Mpc] | BZCAT |
| SWIFT J0001.00708 | 2MASX J00004876-0709117 | 0.2032 | 7.1532 | 0.0375 | 165.2 | |
| SWIFT J0001.67701 | 2MASX J000145967657144 | 0.4419 | 76.9540 | 0.0584 | 261.2 | |
| SWIFT J0002.5+0323 | NGC 7811 | 0.6103 | 3.3519 | 0.0255 | 111.3 | |
| SWIFT J0003.3+2737 | 2MASX J00032742+2739173 | 0.8643 | 27.6548 | 0.0397 | 175.2 | |
| SWIFT J0005.0+7021 | 2MASX J00040192+7019185 | 1.0082 | 70.3217 | 0.0960 | 440.7 | |
| SWIFT J0006.2+2012 | Mrk 335 | 1.5813 | 20.2029 | 0.0258 | 112.7 | |
| SWIFT J0009.40037 | SDSS J000911.57003654.7 | 2.2982 | 0.6152 | 0.0733 | 331.3 | |
| SWIFT J0010.5+1057 | Mrk 1501 | 2.6292 | 10.9749 | 0.0893 | 408.1 | BZQ |
| SWIFT J0017.1+8134 | [HB89] 0014+813 | 4.2853 | 81.5856 | 3.3660 | 29188.0 | BZQ |
| SWIFT J0021.21909 | LEDA 1348 | 5.2814 | 19.1682 | 0.0956 | 438.7 |
Note. — Table 5 is published in its entirety in the electronic edition of the Astrophysical Journal. A portion is shown here for guidance. The table reports: (1) the Swift/BAT ID, (2) the name of the counterpart, (3, 4) the coordinates (in degrees, J2000), (5) the redshift, (6) the distance in Mpc, and (7) the BZCAT class.
| (1) | (2) | (3) | (4) | (5) |
|---|---|---|---|---|
| Source | Soft X-ray Facility/Instrument | Obs. ID | Exposure [ks] | Counts |
| SWIFT J0001.00708 | Swift/XRT | 40885001 | 8.5 | 815 |
| SWIFT J0001.67701 | Swift/XRT | 41138001 | 9.6 | 346 |
| SWIFT J0002.5+0323 | Swift/XRT | 47107002 | 10.8 | 3035 |
| SWIFT J0003.3+2737 | Swift/XRT | 41139002 | 9.7 | 100 |
| SWIFT J0005.0+7021 | XMMNewton EPIC/PN | 0550450101 | 14.8 | 5343 |
| SWIFT J0006.2+2012 | Swift/XRT | 35755001 | 204.3 | 56302 |
| SWIFT J0009.40037 | Swift/XRT | 41140001 | 21.0 | 91 |
| SWIFT J0010.5+1057 | Swift/XRT | 36363001 | 21.8 | 5148 |
| SWIFT J0017.1+8134 | XMMNewton EPIC/PN | 0112620201 | 19.1 | 15950 |
| SWIFT J0021.21909 | Swift/XRT | 40886001 | 8.0 | 1515 |
Note. — Table 6 is published in its entirety in the electronic edition of the Astrophysical Journal. A portion is shown here for guidance regarding its form and content. The table reports: (1) the Swift/BAT ID of the source, (2) the X-ray facility used, (3) the ID of the observations, (4) the exposure and (5) the number of counts.
| (1) | (2) | (3) | (4) | (5) | (6) | (7) | (8) | (9) | (10) |
|---|---|---|---|---|---|---|---|---|---|
| Source | Model | Statistic/DOF | |||||||
| [] | [keV] | [%] | [keV] | ||||||
| SWIFT J0001.00708 | B1 | 34.7/40 [] | |||||||
| SWIFT J0001.67701 | A3 | 14.8/17 [] | |||||||
| SWIFT J0002.50323 | NC | A1 | 131.5/120 [] | ||||||
| SWIFT J0003.32737 | NC | B1 | 83.7/111 [C] | ||||||
| SWIFT J0005.07021 | B1(G) | 243.3/241 [] | |||||||
| SWIFT J0006.22012 | A6(G) | 571.1/515 [] | |||||||
| SWIFT J0009.40037 | NC | B1(G) | 99.0/83 [C] | ||||||
| SWIFT J0010.51057 | A2(G) | 232.1/196 [] | |||||||
| SWIFT J0017.18134 | C6 | 585.1/565 [] | |||||||
| SWIFT J0021.21909 | B1 | 72.0/71 [] |
Note. — Table 7 is published in its entirety in the electronic edition of the Astrophysical Journal. A portion is shown here for guidance regarding its form and content. The table reports: (1) the Swift/BAT ID of the source, (2) the value of the logarithm of the column density and the 90% confidence interval, (3) the photon index, (4) the energy of the cutoff, (5) the reflection parameter, (6) the cross-calibration between Swift/BAT and the soft-ray spectra, (7) the fraction of scattered emission observed in the soft X-ray band, (8) the temperature of the blackbody component (for unobscured objects) or of the thermal plasma component (for obscured objects), (9) the model used (G is reported when a Gaussian line around 6–7 keV was added, see IV for details) and (10) the value of the statistic and the number of degrees of freedom. Objects for which no column density was reported have .
| (1) | (2) | (3) |
|---|---|---|
| Source | [keV] | |
| SWIFT J0017.18134 | ||
| SWIFT J0036.05951 | ||
| SWIFT J0122.02818 | ||
| SWIFT J0122.93420 | ||
| SWIFT J0142.03922 | ||
| SWIFT J0225.01847 | ||
| SWIFT J0404.03604 | ||
| SWIFT J0550.73212A | ||
| SWIFT J0710.35908 | ||
| SWIFT J0841.47052 |