11email: c.mueller@astro.ru.nl 22institutetext: Institut für Theoretische Physik und Astrophysik, Universität Würzburg, Am Hubland, 97074 Würzburg, Germany 33institutetext: Dr. Remeis-Sternwarte & ECAP, Universität Erlangen-Nürnberg, Sternwartstraße 7, 96049 Bamberg, Germany 44institutetext: Max-Planck-Institut für Radioastronomie, Auf dem Hügel 69, 53121 Bonn, Germany 55institutetext: NASA, Goddard Space Flight Center, Astrophysics Science Division, Code 661, Greenbelt, MD 20771, USA 66institutetext: CRESST/University of Maryland Baltimore County, Baltimore, MD 21250, USA 77institutetext: Catholic University of America, Washington, DC 20064, USA 88institutetext: ASTRON, the Netherlands Institute for Radio Astronomy, Postbus 2, 7990 AA, Dwingeloo, The Netherlands 99institutetext: Joint Institute for VLBI ERIC (JIVE), Postbus 2, 7990 AA Dwingeloo, The Netherlands 1010institutetext: Wyle Science, Technology and Engineering Group, Greenbelt, MD 20771, USA 1111institutetext: ECAP, Universität Erlangen-Nürnberg, Erwin-Rommel-Str. 1, 91058 Erlangen, Germany 1212institutetext: CSIRO Astronomy and Space Science, ATNF, PO Box 76 Epping, NSW 1710, Australia 1313institutetext: Observatori Astronòmic, Universitat de València, 46980 Paterna, València, Spain 1414institutetext: Dept. d’Astronomia i Astrofísica, Universitat de València, 46100 Burjassot, València, Spain 1515institutetext: Institute for Radio Astronomy & Space Research, AUT University, Auckland, New Zealand 1616institutetext: Bundesamt für Kartographie und Geodäsie, 93444 Bad Kötzting, Germany 1717institutetext: CSIRO Astronomy and Space Science, Canberra Deep Space Communications Complex, P.O. Box 1035, Tuggeranong, ACT 2901, Australia 1818institutetext: GRAPPA & Anton Pannekoek Institute for Astronomy, University of Amsterdam, Science Park 904, 1098 XH Amsterdam, The Netherlands 1919institutetext: School of Mathematics & Physics, University of Tasmania, Private Bag 37, Hobart, Tasmania 7001, Australia 2020institutetext: INAF/IAPS, via Fosso del Cavaliere 100, 00133 Roma, Italy 2121institutetext: Nordic Optical Telescope Apartado 474, 38700 Santa Cruz de La Palma Santa Cruz de Tenerife, Spain 2222institutetext: Hartebeesthoek Radio Astronomy Observatory, PO Box 443, Krugersdorp 1740, South Africa 2323institutetext: International Centre for Radio Astronomy Research, Curtin University, Bentley, WA 6102, Australia 2424institutetext: INAF, Istituto di Radio Astronomia, Via Piero Gobetti, 41029 Bologna, Italy
TANAMI: Tracking Active Galactic Nuclei with Austral Milliarcsecond Interferometry111The cleaned VLBI images displayed in Figs. 1 to 5 (FITS files) are only available at the CDS via anonymous ftp to cdsarc.u-strasbg.fr (130.79.128.5) or via http://cdsweb.u-strasbg.fr/cgi-bin/qcat?J/A+A/.
Abstract
Context. TANAMI is a multiwavelength program monitoring active galactic nuclei (AGN) south of declination including high-resolution very long baseline interferometry (VLBI) imaging, radio, optical/UV, X-ray, and ray studies. We have previously published first-epoch 8.4 GHz VLBI images of the parsec-scale structure of the initial sample. In this paper, we present images of 39 additional sources. The full sample comprises most of the radio- and -ray brightest AGN in the southern quarter of the sky, overlapping with the region from which high-energy ( TeV) neutrino events have been found.
Aims. We characterize the parsec-scale radio properties of the jets and compare them with the quasi-simultaneous Fermi/LAT ray data. Furthermore, we study the jet properties of sources which are in positional coincidence with high-energy neutrino events compared to the full sample. We test the positional agreement of high-energy neutrino events with various AGN samples.
Methods. TANAMI VLBI observations at 8.4 GHz are made with southern hemisphere radio telescopes located in Australia, Antarctica, Chile, New Zealand, and South Africa.
Results. Our observations yield the first images of many jets below declination at milliarcsecond resolution. We find that -ray loud TANAMI sources tend to be more compact on parsec-scales and have higher core brightness temperatures than -ray faint jets, indicating higher Doppler factors. No significant structural difference is found between sources in positional coincidence with high-energy neutrino events and other TANAMI jets. The 22 -ray brightest AGN in the TANAMI sky show only a weak positional agreement with high-energy neutrinos demonstrating that the TeV IceCube signal is not simply dominated by a small number of the -ray brightest blazars. Instead, a larger number of sources have to contribute to the signal with each individual source having only a small Poisson probability for producing an event in multi-year integrations of current neutrino detectors.
Key Words.:
galaxies: active -– galaxies: jets -– galaxies: nuclei -– radio continuum: galaxies – techniques: high angular resolution – neutrinos1 Introduction
Multiwavelength observations of active galactic nuclei (AGN) and their jets provide an intimate link between the key science categories of high-resolution radio astronomy, -ray astronomy, and astroparticle physics. Most -ray loud AGN detected by Fermi/LAT are blazars, i.e., extragalactic jets oriented at a small angle to the line of sight from the observer (Abdo et al., 2010; Nolan et al., 2012; Acero et al., 2015). The broadband spectral energy distribution (SED) of flat-spectrum radio quasars (FSRQs) and BL Lac objects, both subtypes of blazars, is dominated by the strongly Doppler-boosted emission from the approaching relativistic jet. Aside from blazars, a small number of “misaligned” AGN jets have also been detected at rays (Abdo et al., 2010). Observations of AGN jets have revealed a strong connection between their parsec-scale radio structure and dynamics, as probed by observations using very long baseline interferometry (VLBI), and their variable -ray emission (e.g., Jorstad et al., 2001; Lister et al., 2009, 2011; Fuhrmann et al., 2014). However, a significant fraction of bright and powerful AGN jets remain undetected at rays (see also Lister et al., 2015). Only VLBI observations can resolve the parsec-scale structure of jets, allowing the investigation of potential differences between these samples.
Tracking Active Galactic Nuclei with Milliarcsecond Interferometry (TANAMI) is a multiwavelength program monitoring a sample of the radio and -ray brightest extragalactic jets of the southern hemisphere (Ojha et al., 2010; Kadler et al., 2015). The central element of TANAMI is the VLBI monitoring program at 8.4 GHz and 22 GHz (see Sect. 2 and Ojha et al., 2010, hereafter Paper I). The initial TANAMI sample consisted of 43 sources, whose first-epoch 8.4 GHz VLBI images are discussed in Paper I. Here, we present first-epoch VLBI images at 8.4 GHz of 39 additional sources and discuss their parsec-scale properties. This study covers many sources that are relevant in the context of recent TANAMI high-energy astronomy and astroparticle physics studies, for which no previous VLBI images have been available, namely 8 sources from the dynamic-SED catalog of southern blazars (Krauß et al., 2016), 28 sources whose -ray properties were studied by Böck et al. (2016), and 3 sources discussed by Dutka et al. (2013) and by Nesci et al. (2011a, b).
A new link between VLBI observations and high-energy astronomy and astroparticle astrophysics is emerging in the context of the search for high-energy neutrino point sources. Based on TANAMI VLBI and multiwavelength data, we were able to show (Krauß et al., 2014) that the population of FSRQs as a whole can explain the neutrino signal at energies above 100 TeV as found in the IceCube High-Energy Starting-Event (HESE) analysis (Aartsen et al., 2014). Moreover, it was possible to associate the single neutrino event at 2 PeV energy (HESE-35) with the exceptional outburst observed in the FSRQ PKS 1424418 (Kadler et al., 2016), provided that the observed high-energy emission is due to hadronic emission. A second case of a blazar outburst coinciding with a high-energy muon-neutrino event was recently published by Kun et al. (2017). In this case, the blazar PKS 0723008 is found to be located inside the small () field of a muon-neutrino event (HESE-5). Similar to PKS 1424418, the blazar is found to show a massive radio outburst over several months around the time of the neutrino detection and a possible associated jet-component ejection. However, it is difficult to correctly assess the a posteriori likelihoods of these coincidences given the low number statistics and the long variability timescales of the blazar outbursts considered. This situation will somewhat improve as longer data sets of large neutrino telescopes become available.
High-fluence FSRQs are the favored neutrino producers in the scenario advocated by Kadler et al. (2016) because of the availability of dense UV photon fields as seeds for photomeson production, while BL Lac objects are disfavored. However, in stratified-jet scenarios, the neutrino output can be much higher than expected in simple one-zone models (Tavecchio et al., 2014). This implies that BL Lac objects are also possible neutrino point sources. In fact, Padovani et al. (2016) found evidence for a spatial correlation between the reconstructed arrival direction of neutrinos and TeV-emitting BL Lacs, while they did not find a comparably strong correlation with FSRQs or other low-peaked blazars. Aartsen et al. (2017) find that a large number of sources is needed in order to explain the observed sky distribution of TeV-PeV neutrino events with blazars if there is a universal neutrino to -ray emission ratio and if steep neutrino spectral indices are considered. We note that this result is not in contradiction to the findings of Kadler et al. (2016) that blazars may dominate the IceCube signal above 100 TeV because of their PeV-peaked neutrino spectra. In fact, the results of Aartsen et al. (2017) and Kadler et al. (2016) both imply that a substantial probability for the detection of a ¿100 TeV neutrino from an individual source can only be expected in unusually bright outbursts, while the majority of events are expected to be contributed by fainter sources, which are much more numerous than the brightest ones. It is, however, possible that only a subset of blazar jets are bright neutrino sources. These neutrino-bright jets might reveal themselves via characteristic parsec-scale radio properties like limb-brightened jet morphologies (e.g., Giroletti et al., 2004), distinguished core brightness temperatures, or multiwavelength properties.
We investigate and characterize the parsec-scale jet properties revealed by high-resolution VLBI observations of the radio and -ray brightest TANAMI AGN in the southern sky where 100 TeV neutrinos have been observed by IceCube. The remainder of this paper is structured as follows. In Sect. 2 we discuss the data reduction of the VLBI observations using the TANAMI array. The resulting new images are presented in Sect. 3. Section 4 presents notable parsec-scale and multiwavelength properties of individual sources. We discuss the VLBI properties of a subsample of sources with respect to their -ray properties in Sect. 5.1, which is complementary to Böck et al. (2016). In Sect. 5.2 we investigate the characteristics of sources in positional agreement with high-energy neutrino events, and we present our summary and conclusions in Sect. 6.
2 Sample, observations, and data reduction
The original TANAMI sample was set up as follows (defined in detail in Paper I): it consisted of a radio-selected subsample, which is a complete flux-density-limited sample of the radio-brightest compact AGN jets south of and a sample of ray associated sources based on EGRET observations. Since the start of Fermi/LAT monitoring in 2008, we added further radio-loud targets due to their association with significantly detected ray sources222There are only a few definite identifications of Fermi/LAT detected sources with radio counterparts, e.g., based on contemporaneous multiwavelength variability. Most other sources are associations based on statistical tests (Abdo et al., 2010; Nolan et al., 2012; Acero et al., 2015). However, in the following we refer to them as “detected by Fermi/LAT”. and a correlated VLBI flux density exceeding mJy. The full TANAMI sample now includes333The only source from this sample not covered in this paper is PKS 2326502, which has only recently been added to the VLBI monitoring program. the 22 -ray brightest AGN from the third catalog of AGN detected by the Fermi/LAT (Ackermann et al., 2015) at declinations south of . In the following, we will refer to this as the ray sample. Sources from both the radio and the ray sample have been observed for several years as part of the TANAMI VLBI program. Böck et al. (2016) discuss a subsample of TANAMI sources for which quasi-simultaneous radio/VLBI and ray data were available from the first year of Fermi data.
The full TANAMI source sample includes 88 AGN jets (see Table 1): 46 quasars, 16 BL Lacs, 17 radio galaxies, and 9 unclassified AGN (i.e., those without an optical identification). Thirty-three TANAMI sources are located within the median-positional-uncertainty regions of high-energy ( TeV) neutrino events from the IceCube HESE analysis.
Table 1 summarizes the status of the TANAMI source sample and its relevant subsamples. The optical classifications (B: BL Lac, Q: Quasar, G: Galaxy, U: unclassified) are based on the catalog by Véron-Cetty & Véron (2006) and the new optical observations of -ray blazars by Shaw et al. (2012, 2013).
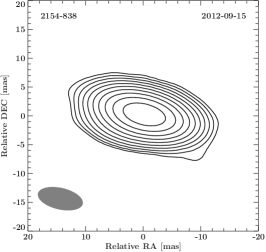
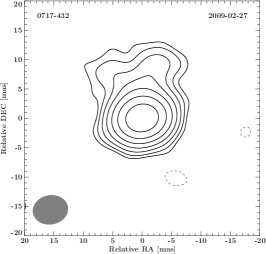
TANAMI VLBI observations are made at 8.4 GHz and 22 GHz using antennas that constitute the Australian Long Baseline Array (Edwards & Phillips, 2015), augmented by those at Hartebeesthoek (South Africa), TIGO (Chile444The antenna was moved to La Plata, Argentina, and renamed the Argentinean-German Geodetic Observatory (AGCO) in 2015.), O’Higgins (Antarctica), NASA Deep Space Network antennas at Tidbinbilla (Australia), as well as the Auscope telescopes at Katherine and Yarragadee (both Australia; Lovell et al., 2013), and Warkworth (New Zealand; Weston et al., 2013). Telescope information is listed in Table 2. A typical array configuration provides sub-mas resolution and high image fidelity (see Fig. 1 and Paper I for more details) unprecedented for the southern hemisphere. The individual configuration for each observing epoch presented in this paper is summarized in Table 3.
The data presented here were correlated with the DiFX software correlator (Deller et al., 2007, 2011) and later calibrated and imaged using AIPS and DIFMAP as described in Paper I. TANAMI monitoring provides regular observations of all sources with a cadence determined by the radio-variability timescale of each object, up to two or three times per year.
3 Results
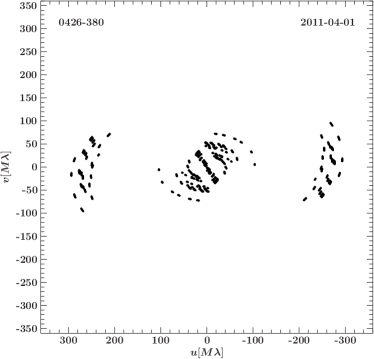
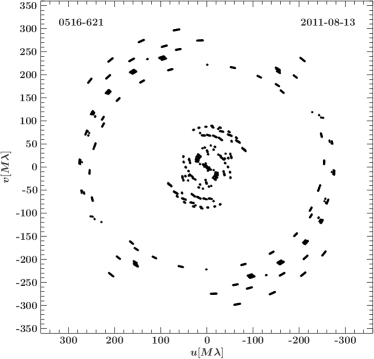
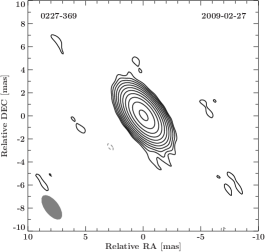
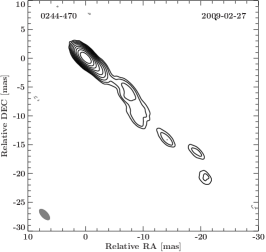
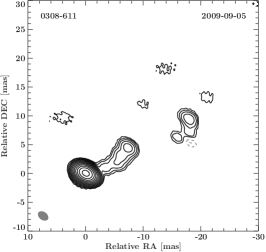
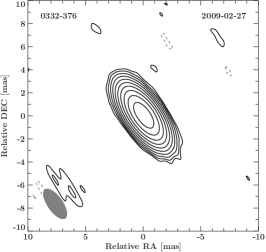
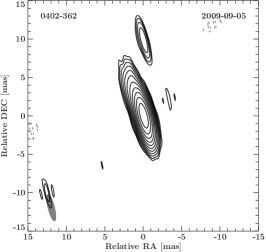
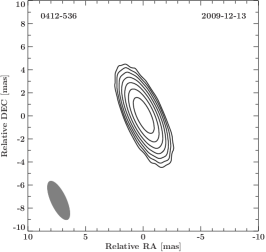
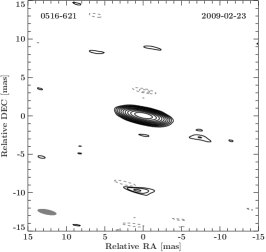
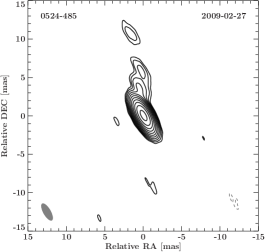
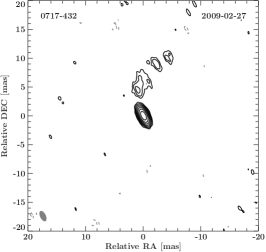
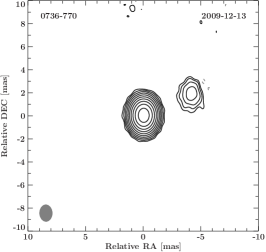
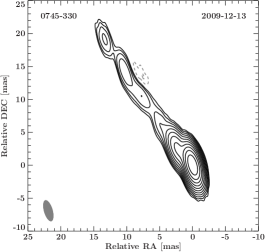
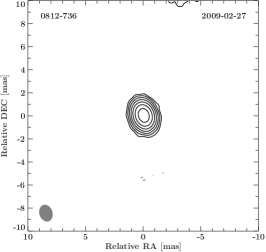
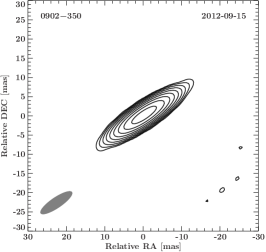
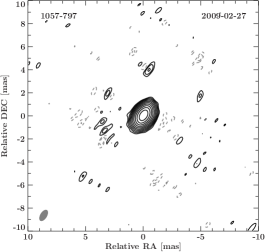
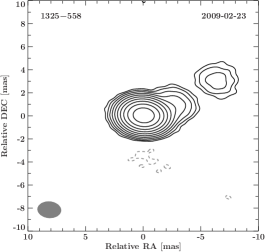
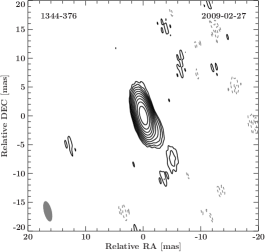
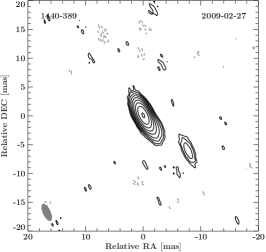
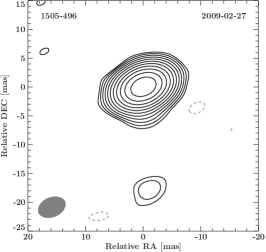
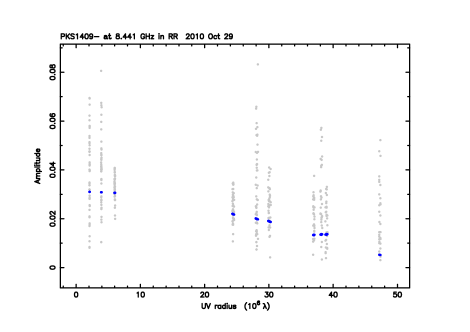
Figures 2 to 5 present the TANAMI first-epoch 8.4 GHz images of the 39 sources that were added after the start of Fermi/LAT ray observations in 2008 August, extending the sources discussed in Paper I. Image properties are listed in Table 4. The first-epoch images of PKS 1101536, PMN J16034904, Swift J1656.33302, and PKS 2004447 have been already published in dedicated papers (see Sect. 4). Furthermore, we provide information on the VLBI detections of PKS 094376 and PKS 1409651 (Circinus Galaxy). Both of these sources have only been observed with a single short scan. Hence, we show a visibility amplitude versus -distance plot of the data in Fig. 6.
Table 1 (column 6) includes the sources whose VLBI core flux densities and brightness temperatures were studied along with their -ray properties in Böck et al. (2016). To complement that work, we include here the images from which those VLBI properties were extracted (and discuss the properties in Sect. 5.1). We further note that images for other epoch observations of PKS 0235618, PKS 0302623, and PKS 0308611 have already been published in Krauß et al. (2014).
The total flux densities are derived directly from the models of the brightness distributions, which are determined in the hybrid-imaging process (see Paper I). The core flux density is obtained by fitting an elliptical Gaussian model to the core (defined as the brightest, most compact feature) following the approach described in Paper I.
The brightness temperature for the radio core at 8.4 GHz of each source was determined using
| (1) |
where , , and are respectively the flux density, the major axis, and minor axis of a two-dimensional Gaussian model component for the core in the radio image (see Table 4); is the Boltzmann constant; the redshift of the source; and the observing wavelength. If the size of the fitted model component for the core emission falls below the resolution limit, very high brightness temperatures are indicated, which cannot be constrained with ground-based VLBI arrays (see Kovalev et al., 2016, for recent space-based VLBI measurements of compact AGN cores with the RadioAstron antenna). In these cases, we calculated lower limits for following Kovalev et al. (2005).
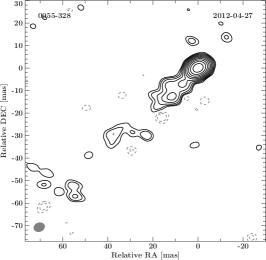
Most of the sources whose images are shown in this work, exhibit clearly resolved mas-scale structures. Only for seven sources is the size of the core component not constrained. For most sources, we typically find single-sided, blazar-like morphologies. Figure 7 shows tapered images of three sources to better display their extended emission. The corresponding image parameters can be found in Table 5.

4 Notes on individual sources
Here we comment on the radio properties of individual sources, complementing the discussion in Böck et al. (2016) and Paper I.
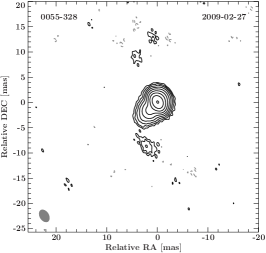
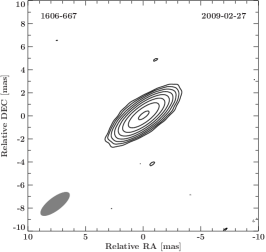
PKS 0055$-$328:
In epoch 2009 Feb 27, this high-redshift BL Lac object appears very compact. In Fig. 7 we show the tapered image from a later TANAMI VLBI epoch (2012 Apr 27), which was more sensitive to diffuse extended emission, revealing a larger scale jet extending over more than 60 mas.
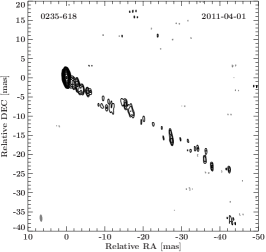
PKS 0235$-$618:
This quasar is one of three TANAMI blazars that are positionally consistent with the IceCube PeV neutrino event HESE-20 (see Krauß et al., 2014, where the inner structure of the second 8.4 GHz TANAMI VLBI observation – quasi-simultaneous to the IceCube event – is presented). Here, we show the full source extension at mas-scales from the first TANAMI VLBI observation.
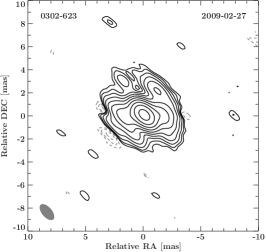
PKS 0302$-$623:
This source is positionally consistent with the PeV neutrino event HESE-20 (Krauß et al., 2014). The mas-scale morphology is classified as irregular due to the halo-like emission around the core.
PKS 0402$-$362:
This object is a -ray loud quasar (Nesci et al., 2011b) with slightly extended morphology on mas-scales.
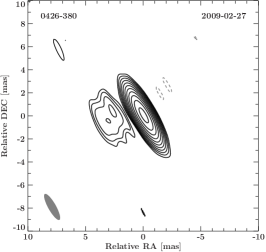
PKS 0426$-$380:
This source is one of the brightest -ray loud blazars in the southern sky and has not been imaged before at comparable angular resolution and image fidelity. It shows a compact jet structure with a faint extension to the east.
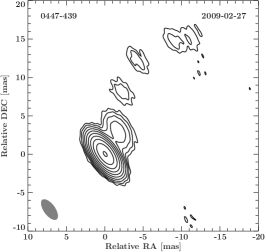
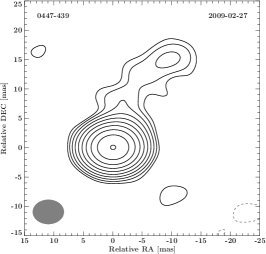
PKS 0447$-$439:
This -ray blazar (see also Nesci et al., 2011a) is detected up to TeV energies (H.E.S.S. Collaboration et al., 2013). The redshift measurements are contradictory as discussed in Pita et al. (2014). The TANAMI mas-scale image shows a faint jet to the northwest. In Fig. 7 we show the tapered image to better display the faint extended emission.
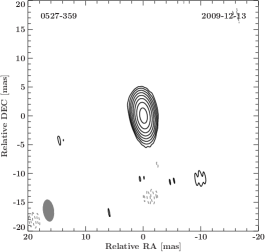
PMN 0529$-$355 (PKS 0527359):
This source was included in the initial TANAMI sample as a candidate EGRET -ray blazar, but was not observed with VLBI due to scheduling problems (Paper I). Here, we present the first-epoch image. It is classified as a non-BL Lac object by Landoni et al. (2013) and it is not detected by Fermi/LAT.
PKS 0717$-$432:
This is a faint source with a total flux of Jy. We show a tapered image in Fig. 7 displaying the faint extended emission.
PKS 1101$-$536:
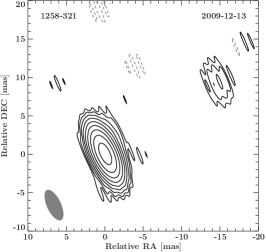
PKS 1258$-$321 (ESO 443-G024):
The ATCA 8.4 GHz image of this radio galaxy shown by Marshall et al. (2005) shows a very symmetric, double-sided FR I morphology. The TANAMI VLBI image reveals a one-sided jet to the northwest with a position angle consistent with the kpc-scale jet structure. No Fermi/LAT detection has been reported so far (Acero et al., 2015).
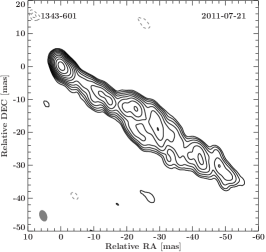
PKS 1343$-$601 (Centaurus B):
Our VLBI image shows an extended jet of mas extension to the southwest with the same position angle as the large-scale jet-structure at 8 GHz shown by Marshall et al. (2005). A counterjet is not significantly detected at VLBI scales in contrast to the large-scale structure at 843 MHz (Jones et al., 2001). Katsuta et al. (2013) report on the Fermi/LAT detection of Cen B discussing both the innermost jet region and the extended radio lobes as possible -ray emission zones. In the former scenario, broadband SED modeling of the unresolved core data results in a required inclination angle of the jet of –. From our VLBI image, we can use the ratio of the surface brightness of the jet and image noise () to constrain the inclination angle to .
PKS 1409$-$651 (Circinus Galaxy):
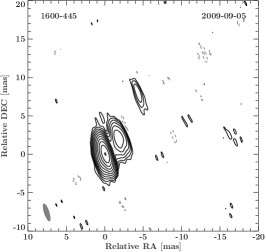
PKS 1600489 (PMN J1603-4904):
This object was classified as a BL Lac object by Shaw et al. (2013). Extensive TANAMI related multiwavelength observations revealed broadband properties which are difficult to reconcile with the blazar classification, but favor a -ray loud young radio galaxy (Müller et al., 2014, 2015, 2016). This conclusion is also supported by the first epoch image published by Müller et al. (2014). This image shows a double-sided morphology. The redshift of was determined by the detection of optical emission lines by Goldoni et al. (2016). Here, we treat this object as a galaxy (“G”).
Swift J1656.3$-$3302 (1653329):
This high-redshift () blazar has the highest predicted PeV-neutrino flux inside the median-positional-uncertainty field of the IceCube PeV neutrino event HESE-14 (see Krauß et al., 2014, where the first-epoch TANAMI mas-scale image is shown). This source also has a neutrino-signal flux fitted by the ANTARES likelihood analysis and based on six years of data corresponding to one event, although an atmospheric origin cannot be excluded (ANTARES Collaboration et al., 2015).
PKS 2004$-$447:
This source is the only known -ray detected radio-loud narrow-line Seyfert 1 (RL-NLS1) galaxy in the southern hemisphere (Acero et al., 2015). A comprehensive TANAMI multiwavelength study has been presented by Kreikenbohm et al. (2016) and by Schulz et al. (2016), who published the first epoch image. It shows the inner 10 mas of a collimated jet ending in a region of enhanced flux density at about 45 mas from the core. The source shows a persistent steep radio spectrum and a low limit on its large scale size, which are both consistent with a compact steep spectrum object. This is unusual for -RL-NLS1 and -ray detected AGN in general.
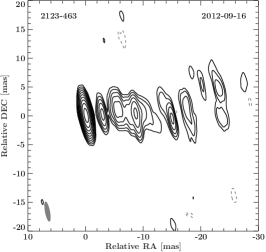
PKS 2123$-$463:
Based on multiwavelength variability D’Ammando et al. (2012) firmly identify this radio source with the Fermi/LAT detection. They provide a new photometric redshift of .
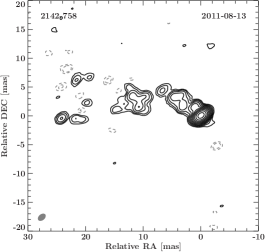
PKS 2142$-$758:
In Dutka et al. (2013), the multiwavelength properties of this FSRQ during flaring and quiescent -ray states are extensively discussed. The first-epoch VLBI image shows a core-dominated structure with a faint jet extension to the east.
5 Discussion
5.1 VLBI source properties
In Böck et al. (2016), we discussed the 0.1-100 GeV ray properties of 75 AGN jets over a one-year period of Fermi/LAT integration (2008 August through 2009 September, corresponding to the 1FGL period; Abdo et al., 2010), including a Fermi/LAT upper limit analysis for all non-detected sources. To investigate the radio- connection, we used the VLBI core-flux densities and core brightness temperatures (extracted from Gaussian model components) from the first VLBI observation during that one-year period. Here, we discuss in detail the corresponding mas-scale radio properties for the same set of observations. We consider only the 67 TANAMI sources for which a VLBI observation during the considered one-year period is available to ensure (quasi-)simultaneity and thus reduce possible variability effects555The check source PKS 1934638 is not included in this VLBI analysis..
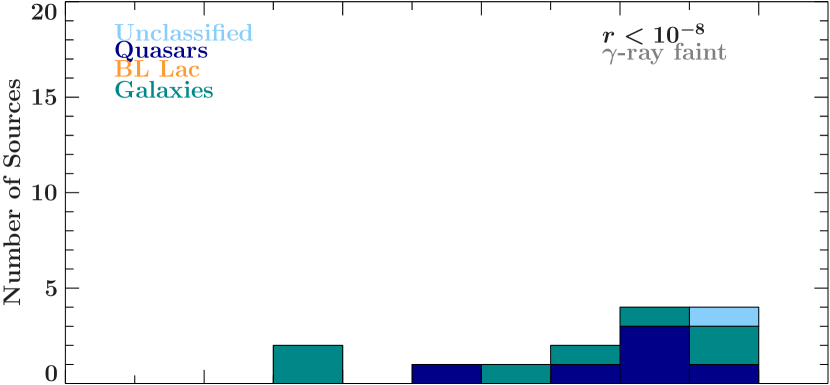
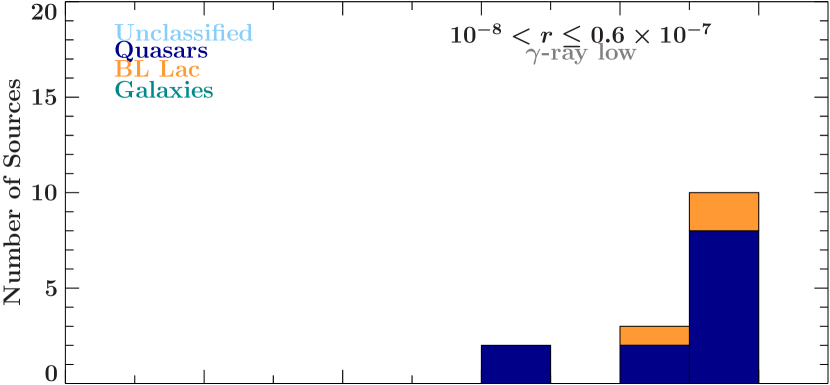
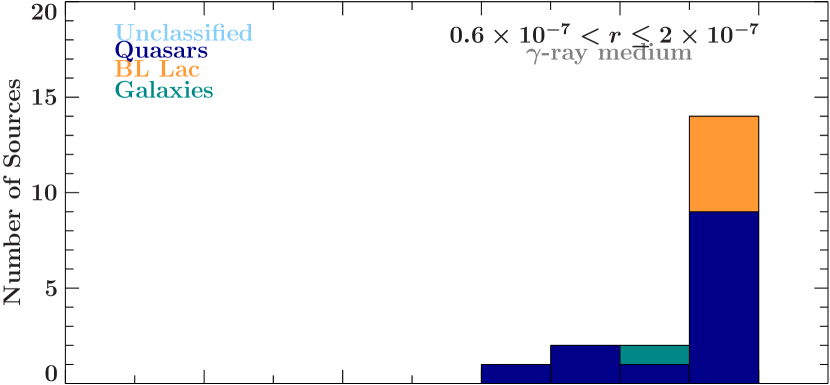
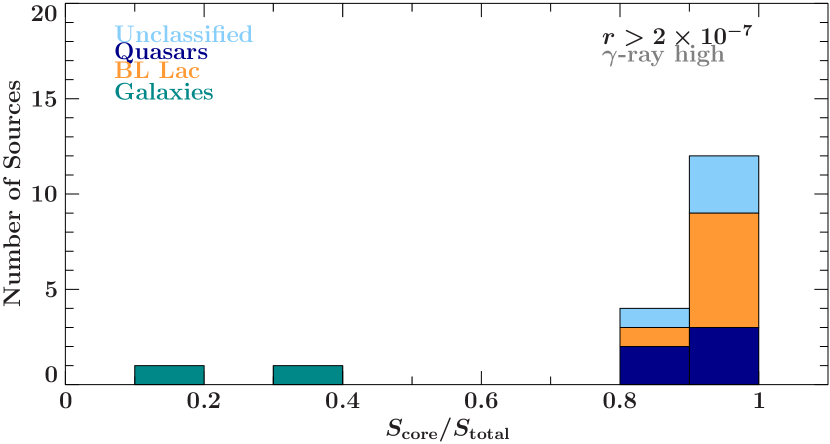
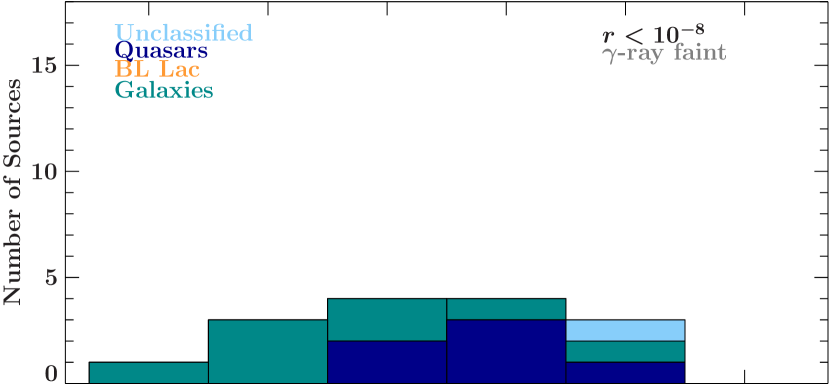
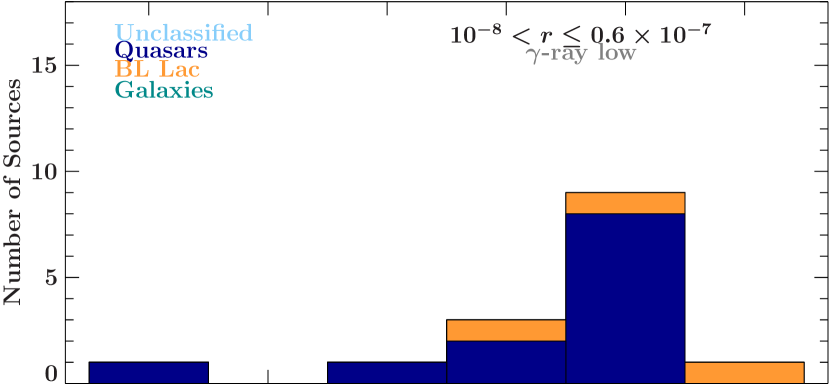
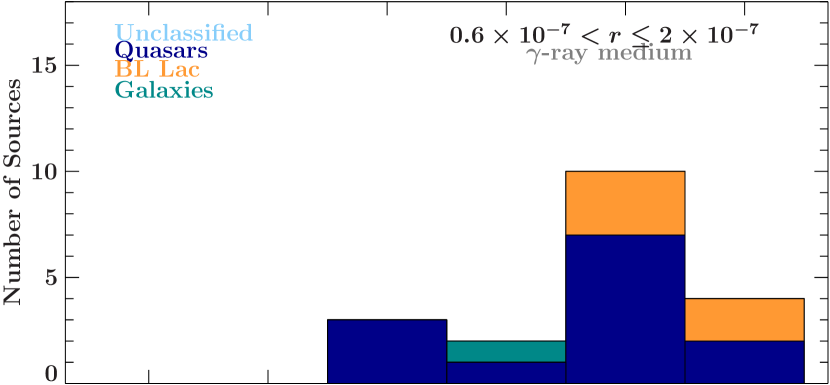
The ratios of the -ray flux to radio core flux density at 8.4 GHz () are calculated to define four subsamples: corresponds to all non-detected sources (i.e., -ray faint), to low, to medium, and to high -ray brightness. The division was chosen such that each bin includes approximately the same number of sources. In the following discussion we investigate the source properties of these four distinct subsamples.
We note that the -ray bright sample is strongly biased towards low radio fluxes, as newly detected ray sources without extensive previous radio coverage were added to the TANAMI program with high priority in the years after the launch of the Fermi telescope. For this reason it is not surprising that a Kolmogorov-Smirnov (KS) test finds rather large differences between the -ray faintest and brightest sources (p-value of 0.87 and 0.10 for the core and total flux distributions, respectively). Therefore, for further discussions, we concentrate on the distributions of the ratio of core to total radio flux density and the brightness temperatures.
The ratio (see Fig. 8), shows that in most sources the bulk radio emission (%) originates from the unresolved sub-mas scales, although most of the sources clearly have a resolved (not compact) mas-scale structure. The -ray faint class shows several sources with a rather low ratio, which implies that the -ray detected sources tend to be more core dominated. This is in agreement with the -distribution (see Fig. 10 of Böck et al., 2016), implying that the -ray detected sources tend to have higher core brightness temperatures (compare also to, e.g., Kovalev et al., 2009).
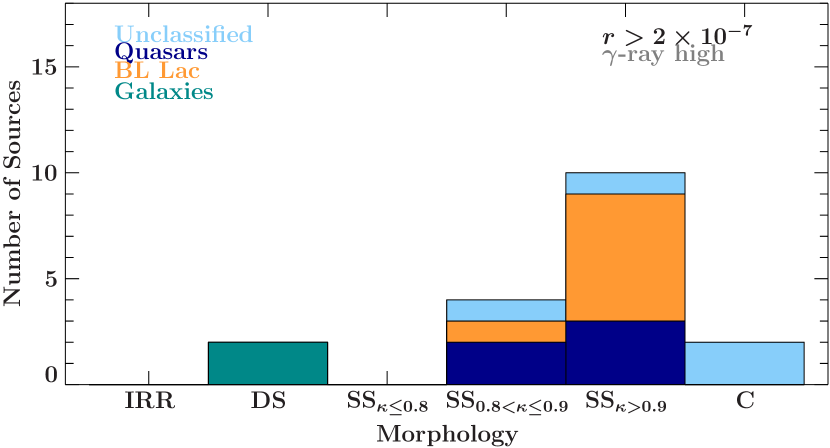
Our morphology classification scheme is adopted from Kellermann et al. (1998) as used in Paper I: barely resolved sources are classified as compact (C); those with a core-jet like structure, i.e., with the most compact feature at either end of the source structure as single-sided (SS); those with the most compact component in the middle as double-sided (DS); and those with an irregular two-dimensional structure as irregular (IRR). This morphology scheme takes no spectral information into account.
Of the 67 objects considered in this analysis, 60 are found to be resolved, while 7 are classified as compact. Only two of the -ray bright sources are classified as double-sided. The comparison between total flux densities of jet sources measured by single-dish observations with VLBI measurements shows that their compactness on arcsecond scales is typically %; i.e., most of the flux density is contained within (sub-)mas scales (Kovalev et al., 2005). This compactness-measure can be taken as an indicator for Doppler boosting and hence as a rough estimator of the jet-inclination angle. Kovalev et al. (2005) further showed that the VLBI core dominance (i.e., the ratio of the core to the total flux density on VLBI scales, here ) of galaxies is often small, while the quasars and BL Lacs are far more compact on (sub-)mas scales, consistent with the AGN unification model. Using the -value of every source, we can expand the morphology scheme for the single-sided sources as follows. We define three subcategories: for the single-sided sources with the most significant jet contribution, for the intermediate, and for the most compact sources.
Figure 9 shows that the -ray loud objects are generally more core dominated than the faint objects, while the distributions for low, medium, and high -ray brightness show no significant differences. This result is consistent with the picture that -ray loud blazars are pointing closer to the line of sight and are more strongly Doppler boosted (see Paper I and, e.g., Lister et al., 2015). The unclassified objects in our sample all show a high core dominance typical for blazars.
The -distribution of quasars is quite broad, ranging down to -values typical for radio galaxies. There is tentative evidence for a dichotomy between -ray faint and loud quasars, in the sense that the VLBI morphologies of -bright quasars show a strong peak at the most compact bins, while the (one-sided) jets of -faint quasars show values of typically in the range to , similar to the one-sided jets of radio galaxies. In this context, it is interesting to note that the -values of all BL Lac objects are high. This supports recent findings by Lister et al. (2015), which suggest that the -ray non-detection of some of the radio-brightest blazars is in part due to their lower peaked spectral energy distributions and in part due to their lower Doppler factors. The morphological manifestation of the latter effect, tentatively seen in our data, should be studied further using an even larger jet sample.
5.2 Properties of sources in positional agreement with 100 TeV neutrino events
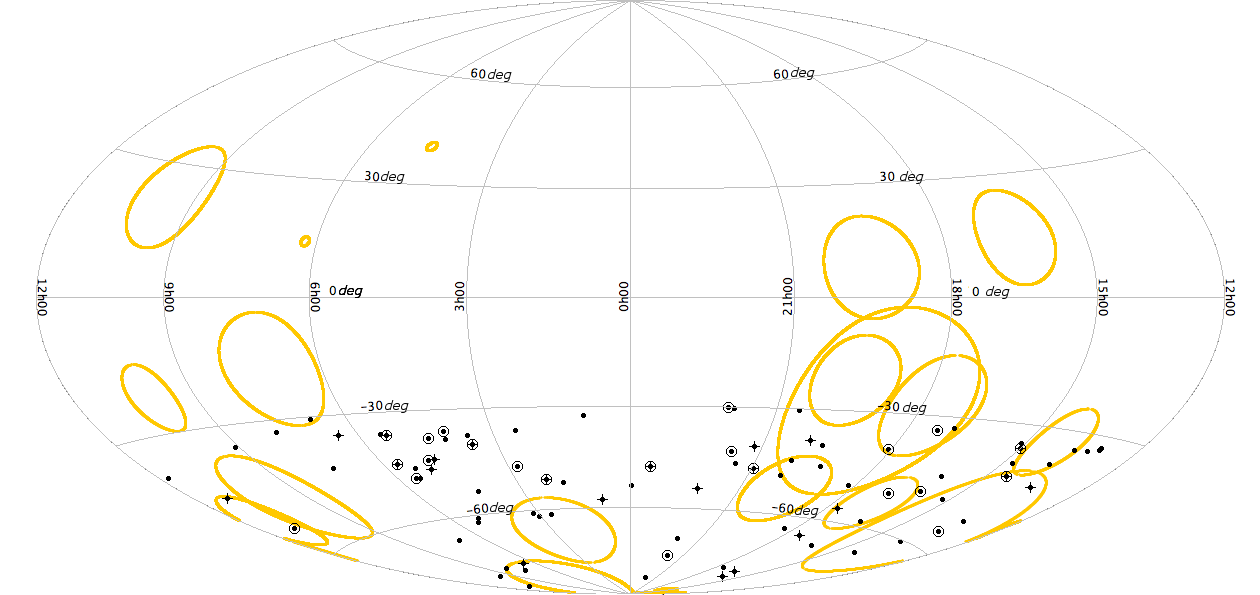
We have also attempted to compare the VLBI properties of AGN jets in positional coincidence with neutrinos from the IceCube HESE analysis666We use the merged HESE data sets by Aartsen et al. (2014) and The IceCube Collaboration et al. (2015). at energies above 100 TeV. The HESE regions are large (200 to 2000 square degrees) due to the poor angular resolution of cascade events in the IceCube detector. Most sources in these fields are therefore expected to be serendipitous coincidences. However, any putative rare source properties could stand out clearly against the sample properties of the non-coincident sources. The 13 known events at energies above 100 TeV777At these high energies, fewer than 0.1 neutrino events are expected from a non-astrophysical origin (The IceCube Collaboration et al., 2015). , which at least partially cover the TANAMI part of the sky south of declination, are in agreement with the quasar-photopion scenario (Kadler et al., 2016; Mannheim, 1995; Mannheim et al., 1992), which predicts a peaked neutrino spectrum at energies between TeV and 10 PeV. These events cover about 50 % of the TANAMI sky region (thus, about 1/8 of the full sky). However, the TANAMI sources are not uniformly distributed over the sky because only a few sources are located near the Galactic plane and because the overall number of sources is not large enough to smooth out apparent inhomogeneities. As a result, only 31 out of 88 TANAMI sources are located inside the median-positional-uncertainty regions of neutrino events of TeV (see Fig. 10 and column 9 of Table 1).
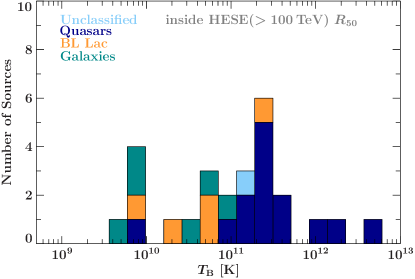
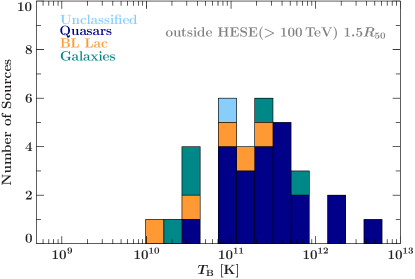
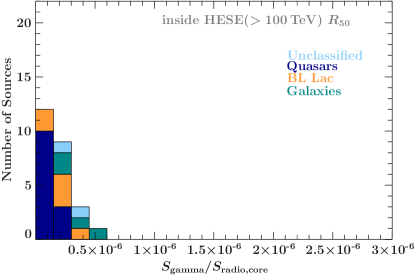
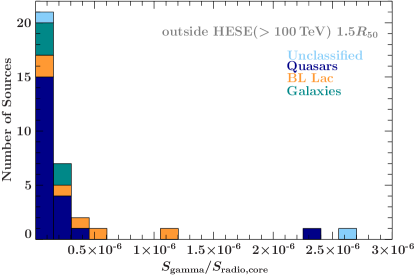
We divide our sample into sources located within the median positional-uncertainty radius of the IceCube HESE neutrino events with energies in excess of 100 TeV and outside of to compare the properties of sources whose positions in the sky are consistent with possible neutrino associations and sources which are clearly inconsistent with these high-energy neutrinos because of their large positional offsets.
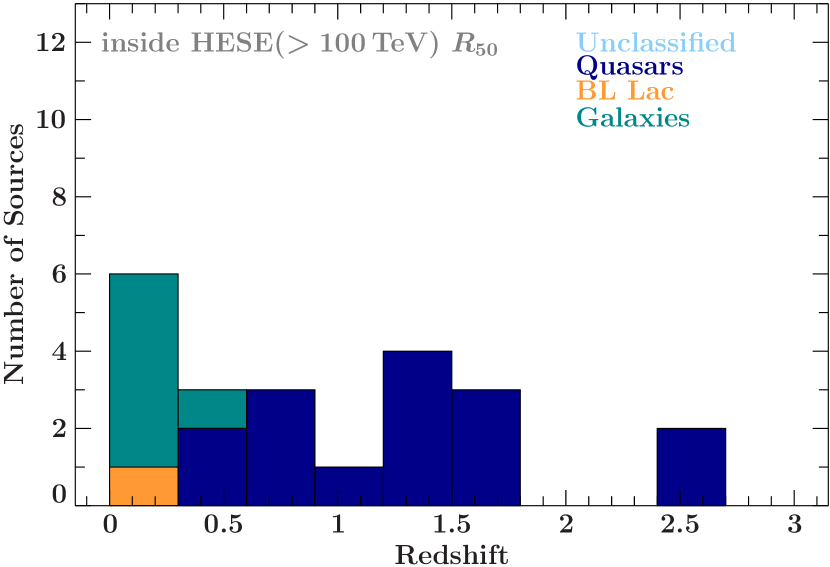
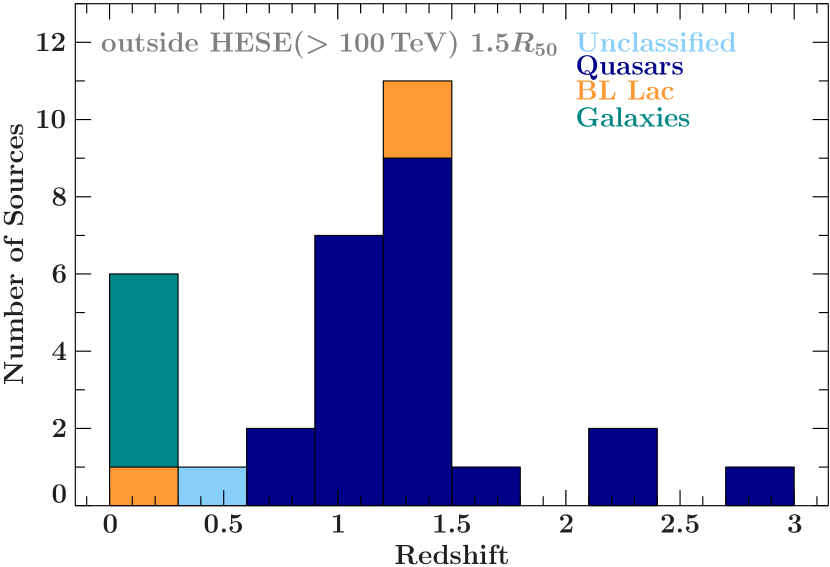
The VLBI images of the AGN in both subsamples do not show any obvious morphological differences. We find no clear difference in compactness, 8.4 GHz core and total flux density, and brightness temperature (Fig. 11). Sources within tend to show lower brightness temperatures, although this trend is not statistically significant (KS test: 46%). A comparison of the ray dominance (Fig. 12) shows no major difference, although the few strongly -dominated sources are from the subsample outside . The redshift distribution (Fig. 13) of these two subsamples shows a peak between and for the subsample outside , which is well known for the full TANAMI sample. This peak is not apparent for the subsample in coincidence with the radii of TeV IceCube HESE neutrino events but a two-sample KS test yields a p-value of that both samples were drawn from the same underlying distribution. In conclusion, the TANAMI VLBI data show no significant difference in parsec-scale properties for the sources inside and outside the HESE TeV radii.
Several authors (e.g., Becker Tjus et al., 2014; Krauß et al., 2014; Hooper, 2016; Kadler et al., 2016; Padovani et al., 2016) have proposed specific subclasses of AGN as the dominant sources of the IceCube neutrino signal. It is thus interesting to look at the spatial distribution of these AGN subclasses in the TANAMI sample. Table 6 shows the fraction of quasars, BL Lac objects, radio galaxies, and unclassified AGN of the full TANAMI sample, which are positionally consistent with TeV IceCube neutrinos and the comparison sky regions clearly inconsistent with these events. We also include the statistically complete subsamples of the radio- and -ray loudest TANAMI AGN in this consideration. Consistent with the sky region covered by the median-positional-uncertainty regions of TeV neutrinos, we find about 36 % of the TANAMI sources inside these fields. The numbers fluctuate within the range expected for Poisson statistics among the different AGN classes (see Table 6). It is noteworthy, however, that the sample of the 22 -ray brightest AGN south of declination from the 3LAC catalog shows no particularly strong agreement with high-energy neutrino events; only 6 out of the 22 sources fall in the regions of TeV neutrino events. Vice versa, only 5 out of the 13 highest energy IceCube HESE events in the TANAMI part of the sky (namely HESE-2, HESE-4, HESE-14, HESE-35, and HESE-52) can possibly be associated with one of these 22 -ray brightest AGN (see Table 1). We conclude that the IceCube signal (above 100 TeV) cannot simply be attributed to such a small GeV flux-limited sample of the -ray brightest AGN, but that substantial contributions of a larger population of sources are needed. This finding is consistent with our previous results (Krauß et al., 2014; Kadler et al., 2016) and other groups (e.g., Aartsen et al., 2017; Feyereisen et al., 2017).
6 Summary and conclusions
In this work, we presented first-epoch VLBI images of 39 additional TANAMI sources, which were included in the program after the first year of VLBI observations. Most new AGN were added to the sample, due to their association with a newly detected ray source by Fermi/LAT. For this reason, and the paucity of VLBI observations of southern hemisphere sources, this work presents the first VLBI images for many -bright blazars south of declination.
Complementary to the -ray analysis of a one-year period of Fermi/LAT data presented in Böck et al. (2016), we discussed the quasi-simultaneous mas-scale properties of 67 sources with respect to their -ray loudness.
Confirming the results by other authors for similar source samples (e.g., Kovalev et al., 2009), the -ray bright TANAMI sources have higher brightness temperatures and are more compact than the -ray faint ones, indicating higher Doppler beaming factors (Böck et al., 2016). This is also consistent with the findings of Lister et al. (2015).
The group of unclassified sources in the TANAMI sample shows mas-scale properties typical for the most compact quasars and BL Lac type objects, suggesting that they also belong to this class.
There is tentative evidence for a difference in the VLBI morphologies between -ray faint and -ray bright quasar jets in the sense that the jets of the -ray brightest quasars are very compact while -ray fainter quasar jets share morphological similarities with the one-sided jets of radio galaxies. In contrast to the BL Lac objects, whose broadband spectra can generally be modeled with single-zone SSC models (e.g., Tavecchio et al., 1998; Cerruti et al., 2013), FSRQs require models involving external radiation fields to explain their broadband SEDs (e.g., Dermer et al., 2009). Hence, the complexity and diversity of their SEDs and morphologies can be taken as indications of the existence of different subtypes, including intrinsically -ray faint, but radio-loud quasars.
We performed a statistical comparison of bright and compact radio-loud AGN in positional coincidence with high-energy ( TeV) IceCube HESE neutrinos and bright and compact radio-loud AGN far outside the median-positional-accuracy regions of such neutrinos. We find no morphological differences between these two samples and no clear difference of any characteristic VLBI properties. If anything, the -dominance values and brightness temperatures of TANAMI AGN inside the IceCube TeV HESE fields are slightly lower than for sources outside of these regions.
We also did a simple statistic of the distribution of different subclasses of TANAMI AGN inside and outside of TeV HESE fields. The -ray brightest TANAMI sources show no good positional agreement with high-energy neutrinos, indicating that the TeV IceCube signal is not simply dominated by a small number of the -ray brightest blazars. However, it is possible that only a subset of variable, radio-loud and -bright AGN produce high-energy neutrinos (Padovani et al., 2016; Kadler et al., 2016) and that a considerable fraction of the detected neutrino events are associated with faint remote sources below the sensitivity threshold of currently considered AGN samples. We note that this is also in full agreement with the result found by the IceCube collaboration (Aartsen et al., 2017).
High-angular resolution radio observations with VLBI techniques remain a unique tool to study the relativistic jet flows in high-energy emitting AGN. Continued broadband monitoring and correlation studies are necessary in the endeavor to identify the high-energy emission processes at work in AGN and, in the process, to test AGN as possible sources of high-energy neutrinos and cosmic rays.
Acknowledgements.
We thank the anonymous referee and B. Boccardi for helpful comments that improved the manuscript. The Long Baseline Array is part of the Australia Telescope National Facility which is funded by the Commonwealth of Australia for operation as a National Facility managed by CSIRO. This study made use of data collected through the AuScope initiative. AuScope Ltd is funded under the National Collaborative Research Infrastructure Strategy (NCRIS), an Australian Commonwealth Government Programme. This work made use of the Swinburne University of Technology software correlator, developed as part of the Australian Major National Research Facilities Programme. This work was supported by resources provided by the Pawsey Supercomputing Centre with funding from the Australian Government and the Government of Western Australia. Hartebeesthoek Radio Astronomy Observatory (HartRAO) is a facility of the National Research Foundation (NRF) of South Africa. C.M. acknowledges support from the Studienstiftung des Deutschen Volkes and the ERC Synergy Grant “BlackHoleCam: Imaging the Event Horizon of Black Holes” (Grant 610058). F.K. acknowledges funding from the European Union’s Horizon 2020 research and innovation program under grant agreement No. 653477. E.R. acknowledges support from the Spanish MINECO through grants AYA2012-38491-C02-01 and AYA2015-63939-C2-2-P and from the Generalitat Valenciana grant PROMETEOII/2014/057. This research was funded in part by NASA through Fermi Guest Investigator grants NNH10ZDA001N, NNH12ZDA001N, and NNH13ZDA001N-FERMI (proposal numbers 41213, 61089, and 71326, respectively). This research was supported by an appointment to the NASA Postdoctoral Program at the Goddard Space Flight Center, administered by Oak Ridge Associated Universities through a contract with NASA. This research has made use of the United States Naval Observatory (USNO) Radio Reference Frame Image Database (RRFID). This research has made use of NASA’s Astrophysics Data System. This research has made use of the NASA/IPAC Extragalactic Database (NED) which is operated by the Jet Propulsion Laboratory, California Institute of Technology, under contract with the National Aeronautics and Space Administration. This research has made use of the SIMBAD database (operated at CDS, Strasbourg, France). This research has made use of a collection of ISIS scripts provided by the Dr. Karl Remeis-Observatory, Bamberg, Germany at http://www.sternwarte.uni-erlangen.de/isis/ and of Astropy, a community-developed core Python package for Astronomy (Astropy Collaboration, 2013).References
- Aartsen et al. (2017) Aartsen, M. G., Abraham, K., Ackermann, M., et al. 2017, ApJ, 835, 45
- Aartsen et al. (2014) Aartsen, M. G., Ackermann, M., Adams, J., et al. 2014, Phys. Rev. Lett., 113, 101101
- Abdo et al. (2010) Abdo, A. A., Ackermann, M., Ajello, M., et al. 2010, ApJS, 188, 405
- Abdo et al. (2010) Abdo, A. A., Ackermann, M., Ajello, M., et al. 2010, ApJ, 720, 912
- Acero et al. (2015) Acero, F., Ackermann, M., Ajello, M., et al. 2015, ApJS, 218, 23
- Ackermann et al. (2011) Ackermann, M., Ajello, M., Allafort, A., et al. 2011, ApJ, 743, 171
- Ackermann et al. (2015) Ackermann, M., Ajello, M., Atwood, W. B., et al. 2015, ApJ, 810, 14
- ANTARES Collaboration et al. (2015) ANTARES Collaboration, Adrián-Martínez, S., Albert, A., et al. 2015, A&A, 576, L8
- Becker Tjus et al. (2014) Becker Tjus, J., Eichmann, B., Halzen, F., Kheirandish, A., & Saba, S. M. 2014, Phys. Rev. D, 89, 123005
- Böck et al. (2016) Böck, M., Kadler, M., Müller, C., et al. 2016, A&A, 590, A40
- Cerruti et al. (2013) Cerruti, M., Boisson, C., & Zech, A. 2013, A&A, 558, A47
- D’Ammando et al. (2012) D’Ammando, F., Rau, A., Schady, P., et al. 2012, MNRAS, 427, 893
- Deller et al. (2011) Deller, A. T., Brisken, W. F., Phillips, C. J., et al. 2011, PASP, 123, 275
- Deller et al. (2007) Deller, A. T., Tingay, S. J., Bailes, M., & West, C. 2007, PASP, 119, 318
- Dermer et al. (2009) Dermer, C. D., Finke, J. D., Krug, H., & Böttcher, M. 2009, ApJ, 692, 32
- Dutka et al. (2013) Dutka, M. S., Ojha, R., Pottschmidt, K., et al. 2013, ApJ, 779, 174
- Edwards & Phillips (2015) Edwards, P. G. & Phillips, C. 2015, Publ. of Korean Astron. Soc., 30, 659
- Feyereisen et al. (2017) Feyereisen, M. R., Tamborra, I., & Ando, S. 2017, JCAP, 3, 057
- Fuhrmann et al. (2014) Fuhrmann, L., Larsson, S., Chiang, J., et al. 2014, MNRAS, 441, 1899
- Giroletti et al. (2004) Giroletti, M., Giovannini, G., Feretti, L., et al. 2004, ApJ, 600, 127
- Goldoni et al. (2016) Goldoni, P., Pita, S., Boisson, C., et al. 2016, A&A, 586, L2
- Hayashida et al. (2013) Hayashida, M., Stawarz, Ł., Cheung, C. C., et al. 2013, ApJ, 779, 131
- H.E.S.S. Collaboration et al. (2013) H.E.S.S. Collaboration, Abramowski, A., Acero, F., et al. 2013, A&A, 552, A118
- Hooper (2016) Hooper, D. 2016, JCAP, 9, 002
- Jones et al. (2001) Jones, P. A., Lloyd, B. D., & McAdam, W. B. 2001, MNRAS, 325, 817
- Jorstad et al. (2001) Jorstad, S. G., Marscher, A. P., Mattox, J. R., et al. 2001, ApJS, 134, 181
- Kadler et al. (2016) Kadler, M., Krauß, F., Mannheim, K., et al. 2016, Nature Physics, 12, 807
- Kadler et al. (2015) Kadler, M., Ojha, R., & TANAMI Collaboration. 2015, AN, 336, 499
- Katsuta et al. (2013) Katsuta, J., Tanaka, Y. T., Stawarz, Ł., et al. 2013, A&A, 550, A66
- Kellermann et al. (1998) Kellermann, K. I., Vermeulen, R. C., Zensus, J. A., & Cohen, M. H. 1998, AJ, 115, 1295
- Kovalev et al. (2009) Kovalev, Y. Y., Aller, H. D., Aller, M. F., et al. 2009, ApJ Lett., 696, L17
- Kovalev et al. (2016) Kovalev, Y. Y., Kardashev, N. S., Kellermann, K. I., et al. 2016, ApJ Lett., 820, L9
- Kovalev et al. (2005) Kovalev, Y. Y., Kellermann, K. I., Lister, M. L., et al. 2005, AJ, 130, 2473
- Krauß et al. (2014) Krauß, F., Kadler, M., Mannheim, K., et al. 2014, A&A, 566, L7
- Krauß et al. (2015) Krauß, F., Wang, B., Baxter, C., et al. 2015, 2014 Fermi Symposium proceedings - eConf C141020.1 (ArXiv:1502.02147)
- Krauß et al. (2016) Krauß, F., Wilms, J., Kadler, M., et al. 2016, A&A, 591, A130
- Kreikenbohm et al. (2016) Kreikenbohm, A., Schulz, R., Kadler, M., et al. 2016, A&A, 585, A91
- Kun et al. (2017) Kun, E., Biermann, P. L., & Gergely, L. Á. 2017, MNRAS, 466, L34
- Landoni et al. (2013) Landoni, M., Falomo, R., Treves, A., et al. 2013, AJ, 145, 114
- Lister et al. (2011) Lister, M. L., Aller, M., Aller, H., et al. 2011, ApJ, 742, 27
- Lister et al. (2015) Lister, M. L., Aller, M. F., Aller, H. D., et al. 2015, ApJ, 810, L9
- Lister et al. (2009) Lister, M. L., Homan, D. C., Kadler, M., et al. 2009, ApJ Lett., 696, L22
- Lovell et al. (2013) Lovell, J. E. J., McCallum, J. N., Reid, P. B., et al. 2013, J. Geodesy, 87, 527
- Mannheim (1995) Mannheim, K. 1995, Astroparticle Physics, 3, 295
- Mannheim et al. (1992) Mannheim, K., Stanev, T., & Biermann, P. L. 1992, A&A, 260, L1
- Marshall et al. (2005) Marshall, H. L., Schwartz, D. A., Lovell, J. E. J., et al. 2005, ApJS, 156, 13
- Müller et al. (2016) Müller, C., Burd, P. R., Schulz, R., et al. 2016, A&A, 593, L19
- Müller et al. (2014) Müller, C., Kadler, M., Ojha, R., et al. 2014, A&A, 562, A4
- Müller et al. (2015) Müller, C., Krauß, F., Dauser, T., et al. 2015, A&A, 574, A117
- Nesci et al. (2011a) Nesci, R., Edwards, P., Stevens, J., et al. 2011a, ATEL, 3819
- Nesci et al. (2011b) Nesci, R., Ojha, R., Kadler, M., et al. 2011b, ATEL, 3660
- Nolan et al. (2012) Nolan, P. L., Abdo, A. A., Ackermann, M., et al. 2012, ApJS, 199, 31
- Ojha et al. (2010) Ojha, R., Kadler, M., Böck, M., et al. 2010, A&A, 519, A45
- Padovani et al. (2016) Padovani, P., Resconi, E., Giommi, P., Arsioli, B., & Chang, Y. L. 2016, MNRAS, 457, 3582
- Pita et al. (2014) Pita, S., Goldoni, P., Boisson, C., et al. 2014, A&A, 565, A12
- Schulz et al. (2016) Schulz, R., Kreikenbohm, A., Kadler, M., et al. 2016, A&A, 588, A146
- Shaw et al. (2012) Shaw, M. S., Romani, R. W., Cotter, G., et al. 2012, ApJ, 748, 49
- Shaw et al. (2013) Shaw, M. S., Romani, R. W., Cotter, G., et al. 2013, ApJ, 764, 135
- Stickel et al. (1994) Stickel, M., Meisenheimer, K., & Kuehr, H. 1994, A&AS, 105, 211
- Tavecchio et al. (2014) Tavecchio, F., Ghisellini, G., & Guetta, D. 2014, ApJ Lett., 793, L18
- Tavecchio et al. (1998) Tavecchio, F., Maraschi, L., & Ghisellini, G. 1998, ApJ, 509, 608
- The IceCube Collaboration et al. (2015) The IceCube Collaboration, Aartsen, M. G., Abraham, K., et al. 2015, 34th International Cosmic Ray Conference (ArXiv:1510.05223)
- Véron-Cetty & Véron (2006) Véron-Cetty, M.-P. & Véron, P. 2006, A&A, 455, 773
- Weston et al. (2013) Weston, S., Takiguchi, H., Natusch, T., & Gulyaev, S. 2013, International VLBI Service for Geodesy and Astrometry 2012 Annual Report, edited by K. D. Baver and D. Behrend (ArXiv:1303.4787)
| Namea𝑎aa𝑎aIAU B1950 and common name. | Common Namea𝑎aa𝑎aIAU B1950 and common name. | Classb𝑏bb𝑏bOptical classification after Véron-Cetty & Véron (2006) and Shaw et al. (2012, 2013) with Q: quasar, B: BL Lac, G: galaxy, U: unidentified object. | zc𝑐cc𝑐cRedshift | First epoch | B16d𝑑dd𝑑dSource included in the radio- correlation study of the first year of Fermi/LAT data by Böck et al. (2016) (B16). | Radio | -ray | Inside HESE( TeV) |
|---|---|---|---|---|---|---|---|---|
| image | Samplee𝑒ee𝑒eThe radio-selected subsample includes all sources south of declination from the catalog of Stickel et al. (1994) above a limiting radio flux density of S2 Jy with a flat radio spectrum (, S) between 2.7 GHz and 5 GHz (22 sources). | Samplef𝑓ff𝑓fThe ray sample includes the -ray brightest AGN south of declination in the 3LAC catalog (22 sources). | ||||||
| 0047579 | [HB89] 0047579 | Q | 1.797 | Paper I | Y | Y | ||
| 0055328 | PKS 0055328 | B | 1.370 | This Work | Y | |||
| 0144522 | PKS 0144522 | G | 0.098 | This Work | ||||
| 0208512 | [HB89] 0208512 | Q | 0.999 | Paper I | Y | Y | Y | |
| 0227369 | PKS 0227369 | Q | 2.115 | This Work | Y | |||
| 0235618 | PKS 0235618 | Q | 0.465 | This WorkhℎhhℎhResults of TANAMI VLBI observations quasi-simultaneous to the IceCube events were presented in Krauß et al. (2014). | HESE-20 | |||
| 0244470 | PKS 0244470 | Q | 1.385 | This Work | Y | Y | ||
| 0302623 | PKS 0302623 | Q | 1.351 | This WorkhℎhhℎhResults of TANAMI VLBI observations quasi-simultaneous to the IceCube events were presented in Krauß et al. (2014). | Y | HESE-20 | ||
| 0308611 | PKS 0308611 | Q | 1.480 | This WorkhℎhhℎhResults of TANAMI VLBI observations quasi-simultaneous to the IceCube events were presented in Krauß et al. (2014). | Y | HESE-20 | ||
| 0332376 | PMN J03343725 | B | ¿0.39 | This Work | Y | |||
| 0332403 | [HB89] 0332403 | B | 1.351 | Paper I | Y | Y | Y | |
| 0402362 | PKS 0402362 | Q | 1.417 | This Work | Y | Y | ||
| 0405385 | [HB89] 0405385 | Q | 1.285 | Paper I | Y | |||
| 0412536 | PMNJ04135332 | Q | 1.024 | This Work | Y | |||
| 0426380 | PKS 0426380 | Q | 1.110 | This Work | Y | Y | ||
| 0438436 | [HB89] 0438436 | Q | 2.863 | Paper I | Y | Y | ||
| 0447439 | PKS 0447439 | B | – | This Work | Y | Y | ||
| 0454463 | [HB89] 0454463 | Q | 0.853 | Paper I | Y | Y | ||
| 0506612 | [HB89] 0506612 | Q | 1.093 | Paper I | Y | |||
| 0516621 | PKS 0516621 | Q | 1.300 | This Work | Y | |||
| 0518458 | Pic A | G | 0.035 | Paper I | Y | |||
| 0521365 | ESO 362 G 021 | G | 0.055 | Paper I | Y | Y | Y | |
| 0524485 | PKS 0524485 | Q | 1.300 | This Work | Y | |||
| 0527359 | PMNJ05293555 | U | 0.323 | This Work | Y | |||
| 0530485 | PMNJ05314827 | Q | – | This Work | Y | |||
| 0537441 | [HB89] 0537441 | Q | 0.894 | Paper I | Y | Y | Y | |
| 0625354 | PKS 062535 | B | 0.055 | Paper I | Y | Y | ||
| 0637752 | [HB89] 0637752 | Q | 0.653 | Paper I | Y | Y | HESE-30 | |
| 0646306 | PKS 0646306 | Q | 0.455 | This Work | HESE-39 | |||
| 0700661 | PKS 0700661 | B | ¿0.39 | This Work | Y | |||
| 0717432 | PMN J07184319 | U | – | This Work | Y | |||
| 0736770 | PKS0736770 | Q | – | This Work | Y | HESE-30 | ||
| 0745330 | PKS0745330 | U | – | This Work | Y | |||
| 0812736 | PMN J08107530 | U | – | This Work | Y | HESE-30 | ||
| 0902350 | 1FGLJ0904.73514 | U | – | This Work | ||||
| 0943761 | PKS 094376 | G | 0.270 | – j𝑗jj𝑗jsee Fig. 6 | ||||
| 1057797 | PKS 105779 | B | 0.581 | This Work | Y | |||
| 1101536 | PKS 1101536 | B | ¿0.15 | Krauß et al. (2015) | Y | HESE-4 | ||
| 1104445 | [HB89] 1104445 | Q | 1.598 | Paper I | Y | Y | HESE-4 | |
| 1144379 | [HB89] 1144379 | Q | 1.048 | Paper I | Y | |||
| 1257326 | PKS 1257326 | Q | 1.256 | Paper I | Y | |||
| 1258321 | ESO443G024 | G | 0.017 | This Work | Y | |||
| 1313333 | [HB89] 1313333 | Q | 1.210 | Paper I | Y | |||
| 1322428 | Cen A | G | 0.002 | Paper I | Y | Y | HESE-35 | |
| 1323526 | PMN J13265256 | B | ¿0.24 | Paper I | Y | HESE-35 | ||
| 1325558 | PMN J13295608 | B | ¿0.13 | This Work | Y | Y | HESE-35 | |
| 1333337 | IC 4296 | G | 0.012 | Paper I | Y | HESE-48 | ||
| 1343601 | Cen B | G | 0.013 | This Work | HESE-35 | |||
| 1344376 | PMN J13473750 | Q | 1.300 | This Work | Y | HESE-48 | ||
| 1409651 | Circinus Galaxy | G | 0.001 | – j𝑗jj𝑗jsee Fig. 6 | HESE-35 | |||
| 1424418 | [HB89] 1424418 | Q | 1.522 | Paper I | Y | Y | Y | HESE-35 |
| 1440389 | PKS 1440389 | B | ¿0.14 | This Work | Y | |||
| 1454354 | PKS 1454354 | Q | 1.424 | Paper I | Y | Y | Y | |
| 1501343 | PMN J15053432 | B | 1.554 | Paper I | Y | |||
| 1505496 | PMN J15084953 | Q | 0.776 | This Work | Y | HESE-35 | ||
| 1549790 | PKS 154979 | G | 0.150 | Paper I | Y | Y | ||
| 1600445 | PMN J16044441 | U | ¿0.01 | This Work | Y | |||
| 1600489 | PMN J16034904 | G | 0.230g𝑔gg𝑔gRedshift measurement by Goldoni et al. (2016). | Müller et al. (2014) | Y | Y | ||
| 1606667 | PMN J16106649 | U | – | This Work | Y | |||
| 1610771 | [HB89] 1610771 | Q | 1.710 | Paper I | Y | Y | ||
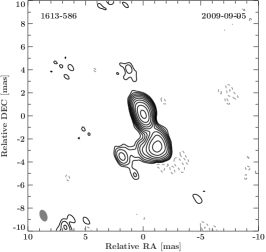
| 1613586 | PMN J16175848 | Q | – | This Work | Y | HESE-52 | ||
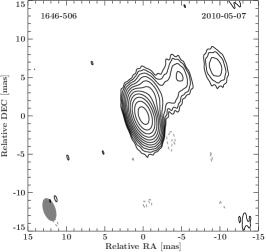
| 1646506 | PMNJ16505044 | U | 0.090 | This Work | Y | Y | HESE-52 | |
| 1653329 | SwiftJ1656.33302 | Q | 2.400 | Krauß et al. (2014) | HESE-2, HESE-14 | |||
| 1714336 | PMN J17173342 | B | – | Paper I | Y | Y | HESE-2, HESE-14 | |
| 1716771 | PKS 1716771 | U | – | Paper I | Y | |||
| 1718649 | NGC 6328 | G | 0.010 | Paper I | Y | Y | ||
| 1733565 | PKS 173356 | G | 0.098 | Paper I | Y | Y | HESE-52 | |
| 1759396 | PMN J18023940 | Q | 1.320 | Paper I | Y | Y | HESE-2, HESE-14 | |
| 1804502 | PMN J18085011 | Q | 1.606 | Paper I | Y | HESE-2 | ||
| 1814637 | PKS 181463 | G | 0.063 | Paper I | Y | |||
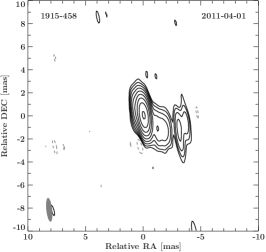
| 1915458 | PKS 1915458 | Q | 2.470 | This Work | HESE-2, HESE-12 | |||
| 1933400 | PKS 1933400 | Q | 0.965 | Paper I | Y | HESE-2 | ||
| 1954388 | [HB89] 1954388 | Q | 0.630 | Paper I | Y | Y | HESE-2 | |
| 2004447 | PKS 2004447 | G | 0.240 | Schulz et al. (2016) | HESE-2,HESE-12 | |||
| 2005489 | [HB89] 2005489 | B | 0.071 | Paper I | Y | HESE-12 | ||
| 2027308 | ESO 462 G 027 | G | 0.539 | Paper I | Y | HESE-2 | ||
| 2052474 | [HB89] 2052474 | Q | 1.489 | Paper I | Y | Y | Y | |
| 2106413 | [HB89] 2106413 | Q | 1.058 | Paper I | Y | Y | ||
| 2123463 | PKS 2123463 | Q | 1.46i𝑖ii𝑖iRedshift measurement by D’Ammando et al. (2012). | This Work | ||||
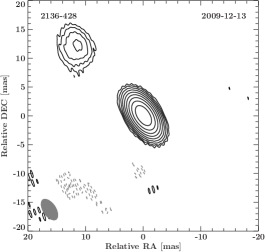
| 2136428 | PMNJ21394235 | B | – | This Work | Y | Y | ||
| 2142758 | PKS 214275 | Q | 1.139 | This Work | Y | |||
| 2149306 | PKS 2149306 | Q | 2.345 | Paper I | Y | |||
| 2152699 | ESO 075 G 041 | G | 0.028 | Paper I | Y | |||
| 2154838 | PKS 215583 | Q | – | This Work | ||||
| 2155304 | [HB89] 2155304 | B | 0.116 | Paper I | Y | Y | ||
| 2204540 | [HB89] 2204540 | Q | 1.206 | Paper I | Y | Y | ||
| 2326477 | [HB89] 2326477 | Q | 1.299 | Paper I | Y | Y | ||
| 2355534 | [HB89] 2355534 | Q | 1.006 | Paper I | Y |
| Telescope | Diameter | Location |
|---|---|---|
| Name (Abbreviation) | [meters] | |
| Parkes (PA) | 64 | Parkes, New South Wales, Australia |
| ATCA (AT) | 522 | Narrabri, New South Wales, Australia |
| Mopra (MP) | 22 | Coonabarabran, New South Wales, Australia |
| Hobart (HO) | 26 | Mt. Pleasant, Tasmania, Australia |
| Ceduna (CD) | 30 | Ceduna, South Australia |
| DSS43a | 70 | Tidbinbilla, Australia |
| DSS45a | 34 | Tidbinbilla, Australia |
| DSS34a | 34 | Tidbinbilla, Australia |
| Hartebeesthoekc (HH) | 26 | Hartebeesthoek, South Africa |
| O’Higginsb (OH) | 9 | O’Higgins, Antarctica |
| TIGOb (TC) | 6 | Concépcion, Chile |
| Warkworth (WW) | 12 | Auckland, New Zealand |
| Katherine (KE) | 12 | Northern Territory, Australia |
| Yarragadee (YG) | 12 | Western Australia |
| Epoch | Participating Telescopes |
|---|---|
| 2009 Feb. 23 | AT, CD, DSS34, DSS45, HO, MP, OH, PA, TC |
| 2009 Feb. 27 | AT, CD, DSS45, HO, MP, OH, PA, TC |
| 2009 Sept. 05 | AT, CD, DSS43, HO, MP, OH, PA, TC |
| 2009 Dec. 13 | AT, CD, HO, MP, PA, TC |
| 2010 May 07 | AT, CD, DSS43, HO, MP, PA, TC |
| 2010 Oct. 28 | AT, CD, DSS34, DSS45, HH, HO, MP, OH, PA, TC |
| 2011 Apr. 01 | AT, CD, DSS34, HH, HO, MP, PA, TC, WW |
| 2011 July 21 | AT, CD, DSS34, DSS43, HH, HO, MP, PA, TC, WW |
| 2011 Aug. 13 | AT, CD, DSS43, HH, HO, KE, MP, PA, TC, YG |
| 2012 Apr. 27 | AT, CD, HH, HO, MP, PA, TC, WW |
| 2012 Sept. 15 | AT, CD, DSS43, HH, HO, KE, PA, TC |
| 2012 Sept. 16 | AT, CD, DSS 34, DSS45, HH, HO, KE, PA, TC |
| Namea𝑎aa𝑎aIAU B1950 and common name. | Common Namea𝑎aa𝑎aIAU B1950 and common name. | Classb𝑏bb𝑏bOptical classification after Véron-Cetty & Véron (2006) and Shaw et al. (2012, 2013) with Q: quasar, B: BL Lac, G: galaxy, U: unidentified object. | zc𝑐cc𝑐cRedshift | Morph.d𝑑dd𝑑dMorphology scheme according to Kellermann et al. (1998) and Paper I. | Epoche𝑒ee𝑒eDate of first TANAMI 8.4 GHz observation shown in Figs. 2 to 5. | f𝑓ff𝑓fMajor, minor axis, and position angle of synthesized beam. | f𝑓ff𝑓fMajor, minor axis, and position angle of synthesized beam. | P.A.f𝑓ff𝑓fMajor, minor axis, and position angle of synthesized beam. | g𝑔gg𝑔gTotal flux density and RMS in the 8.4 GHz image. | RMSg𝑔gg𝑔gTotal flux density and RMS in the 8.4 GHz image. | hℎhhℎhCore component parameters: total flux, FWHM of the major and minor axis, and brightness temperature. | hℎhhℎhCore component parameters: total flux, FWHM of the major and minor axis, and brightness temperature. | hℎhhℎhCore component parameters: total flux, FWHM of the major and minor axis, and brightness temperature. | hℎhhℎhCore component parameters: total flux, FWHM of the major and minor axis, and brightness temperature. | i𝑖ii𝑖i0.1-100 GeV fluxes from Böck et al. (2016). All other sources have not been analyzed using (quasi-)simultaneous data in Böck et al. (2016). |
| [yyyy-mm-dd] | [mas] | [mas] | [∘] | [Jy] | [mJy/beam] | [Jy] | [mas] | [mas] | [K] | [] | |||||
| 0055328 | PKS 0055328 | B | 1.370 | SS | 2009-02-27 | 2.61 | 1.75 | 31.7 | 0.096 | 0.1 | 0.08 | 0.18 | 1.30 | ||
| 0144522 | PKS 0144$-$522 | G | 0.098 | C | 2008-03-28 | 3.49 | 0.64 | 8.1 | 0.117 | 0.1 | 0.12 | 0.24 | 0.24 | ||
| 0227369 | PKS 0227$-$369 | Q | 2.115 | C | 2009-02-27 | 2.46 | 1.17 | 37.4 | 0.573 | 0.2 | 0.57 | 0.17 | 0.34 | ||
| 0235618 | PKS 0235$-$618 | Q | 0.465 | SS | 2011-04-01 | 1.78 | 0.56 | 4.2 | 0.337 | 0.2 | 0.31 | 0.20 | 0.29 | ||
| 0244470 | PKS 0244$-$470 | Q | 1.385 | SS | 2009-02-27 | 2.41 | 1.13 | 43.7 | 0.299 | 0.2 | 0.26 | 0.14 | 0.39 | ||
| 0302623 | PKS 0302$-$623 | Q | 1.351 | IRR | 2009-02-27 | 1.63 | 0.82 | 40.5 | 1.620 | 0.2 | 1.10 | 0.25 | 0.64 | ||
| 0308611 | PKS 0308$-$611 | Q | 1.480 | SS | 2009-09-05 | 1.93 | 1.31 | 53.8 | 0.828 | 0.3 | 0.81 | 0.30 | 0.52 | ||
| 0332376 | PMN J0334$-$3725 | B | C | 2009-02-27 | 3.05 | 1.29 | 35.1 | 0.322 | 0.2 | 0.32 | 0.10 | 0.29 | |||
| 0402362 | PKS 0402$-$362 | Q | 1.417 | SS | 2009-09-05 | 3.57 | 0.87 | 14.2 | 0.576 | 0.2 | 0.54 | 0.37 | 0.37 | ||
| 0412536 | PMN J0413$-$5332 | Q | 1.024 | C | 2009-12-13 | 3.66 | 1.31 | 25.0 | 0.033 | 0.4 | 0.03 | ||||
| 0426380 | PKS 0426$-$380 | Q | 1.110 | SS | 2009-02-27 | 2.53 | 0.63 | 29.4 | 1.810 | 0.4 | 1.80 | 0.13 | 0.32 | ||
| 0447439 | PKS 0447$-$439 | B | – | SS | 2009-02-27 | 3.10 | 1.43 | 36.0 | 0.097 | 0.1 | 0.09 | 0.12 | 0.28 | ||
| 0516621 | PKS 0516$-$621 | Q | 1.300 | C | 2009-02-23 | 2.46 | 0.62 | 78.6 | 0.946 | 0.4 | 0.94 | 0.32 | 0.32 | ||
| 0524485 | PKS 0524$-$485 | Q | 1.300 | SS | 2009-02-27 | 2.47 | 0.92 | 30.0 | 0.579 | 0.2 | 0.57 | 0.23 | 0.44 | ||
| 0527359j𝑗jj𝑗jNot detected at rays. | PMN J0529$-$3555 | U | 0.323 | C | 2009-12-13 | 3.79 | 1.85 | 7.9 | 0.043 | 0.27 | 0.04 | ¡0.10 | ¡0.10 | ||
| 0530485 | PMN J053$-$-4827 | Q | – | SS | 2010-10-28 | 3.54 | 0.71 | 7.3 | 0.161 | 0.1 | 0.15 | 0.22 | 0.37 | ||
| 0646306 | PKS 0646$-$306 | Q | 0.455 | SS | 2012-09-16 | 2.17 | 0.59 | 1.1 | 0.674 | 0.2 | 0.63 | 0.22 | 0.22 | ||
| 0700661 | PKS 0700$-$661 | B | ¿0.39 | SS | 2009-02-27 | 1.73 | 1.24 | 55.8 | 0.153 | 0.1 | 0.14 | 0.33 | 0.35 | ||
| 0717432 | PMN J0718$-$4319 | U | – | SS | 2009-02-27 | 1.87 | 0.91 | 26.5 | 0.034 | 0.1 | 0.03 | ¡0.04 | ¡0.04 | ||
| 0736770 | PKS 0736$-$770 | Q | – | SS | 2009-12-13 | 1.45 | 1.10 | 1.6 | 0.315 | 0.3 | 0.31 | 0.22 | 0.30 | ||
| 0745330 | PKS 0745$-$330 | U | – | SS | 2009-12-13 | 3.26 | 1.26 | 16.3 | 0.671 | 0.4 | 0.60 | 0.32 | 0.64 | ||
| 0812736 | PMN J0810$-$7530 | U | – | C | 2009-02-27 | 1.47 | 1.13 | 19.1 | 0.037 | 0.2 | 0.04 | ¡0.04 | ¡0.04 | ||
| 0902350 | PMN J0904$-$3514 | U | – | C | 2012-09-15 | 9.78 | 2.69 | 56.0 | 0.246 | 0.3 | 0.25 | 0.21 | 0.21 | ||
| 0943761k𝑘kk𝑘kOnly observed with one scan and not imaged (see Fig. 6). | PKS 0943$-$76 | G | 0.270 | — | 2009-12-13 | 52.6 | 3.37 | 52.5 | 0.021 | 1.0 | — | — | — | — | |
| 1057797 | PKS 1057$-$79 | B | 0.581 | C | 2009-02-27 | 1.05 | 0.55 | 31.5 | 2.022 | 0.5 | 1.90 | 0.31 | 0.36 | ||
| 1258321 | ESO443$-$G024 | G | 0.017 | SS | 2009-12-13 | 4.27 | 1.78 | 25.0 | 0.120 | 0.2 | 0.12 | ¡0.05 | ¡0.05 | ||
| 1325558 | PMN J1329$-$5608 | B | ¿0.13 | SS | 2009-02-23 | 2.04 | 1.41 | 85.2 | 0.480 | 0.3 | 0.47 | 0.37 | 0.44 | ||
| 1343601 | Centaurus B | G | 0.013 | SS | 2011-07-21 | 3.44 | 2.14 | 21.2 | 2.646 | 0.2 | 0.90 | 1.43 | 1.43 | ||
| 1344376 | PMN J1347$-$3750 | Q | 1.300 | SS | 2009-02-27 | 3.53 | 1.27 | 14.3 | 0.206 | 0.1 | 0.20 | 0.22 | 0.30 | ||
| 1409651k𝑘kk𝑘kOnly observed with one scan and not imaged (see Fig. 6). | Circinus Galaxy | G | 0.001 | — | 2010-10-28 | 4.30 | 2.82 | 64.6 | 0.031 | 0.8 | — | — | — | — | |
| 1440389 | PKS 1440$-$389 | B | ¿0.14 | SS | 2009-02-27 | 3.17 | 1.27 | 25.0 | 0.096 | 0.1 | 0.09 | 0.33 | 0.55 | ||
| 1505496 | PMN J1508$-$4953 | Q | 0.776 | SS | 2009-02-27 | 4.94 | 3.38 | 67.4 | 0.508 | 0.3 | 0.50 | 0.08 | 0.08 | ||
| 1600445 | PMN J1604$-$4441 | U | ¿0.01 | SS | 2009-09-05 | 2.36 | 0.63 | 17.8 | 1.041 | 0.4 | 0.95 | 0.41 | 0.56 | ||
| 1606667 | PMN J1610$-$6649 | U | – | C | 2009-02-27 | 3.04 | 1.11 | 52.8 | 0.041 | 0.2 | 0.04 | ¡0.06 | ¡0.06 | ||
| 1646506 | PMNJ1650$-$5044 | U | 0.090 | SS | 2010-05-07 | 3.07 | 1.53 | 19.8 | 0.958 | 0.2 | 0.91 | 0.22 | 0.50 | ||
| 1613586 | PMN J1617$-$5848 | Q | – | SS | 2009-09-05 | 1.02 | 0.59 | 21.6 | 2.337 | 0.6 | 1.59 | 0.44 | 0.83 | ||
| 1915458 | PKS 1915$-$458 | Q | 2.470 | SS | 2011-04-01 | 2.03 | 0.46 | 6.1 | 0.286 | 0.4 | 0.25 | 0.30 | 0.61 | ||
| 2123463 | PKS 2123$-$463 | Q | 1.46 | SS | 2012-09-16 | 3.44 | 0.78 | 10.9 | 0.471 | 0.1 | 0.37 | 0.50 | 0.50 | ||
| 2136428 | PMN J2139$-$4235 | B | – | SS | 2009-12-13 | 4.13 | 2.23 | 33.8 | 0.096 | 0.2 | 0.09 | ¡0.06 | ¡0.06 | ||
| 2142758 | PKS 2142$-$75 | Q | 1.139 | SS | 2011-08-13 | 1.46 | 0.96 | 51.4 | 1.596 | 0.3 | 1.31 | 0.27 | 0.44 | ||
| 2155-839 | PKS 2155-83 | Q | – | C | 2012-09-15 | 7.91 | 3.67 | 76.9 | 0.442 | 0.32 | 0.44 | 1.62 | 2.16 |
| Source | Epoch | P.A. | RMS | Tapera | ||||
|---|---|---|---|---|---|---|---|---|
| Name | [yyyy-mm-dd] | [mas] | [mas] | [Jy] | [Jy/beam] | [mJy/beam] | ||
| 0055328 | 2012-04-27 | 4.89 | 3.91 | 69.0 | 0.17 | 0.14 | 0.05 | 100 |
| 0447439 | 2009-02-27 | 5.26 | 4.12 | 89.6 | 0.11 | 0.10 | 0.06 | 100 |
| 0717432 | 2009-02-27 | 5.97 | 4.90 | 79.3 | 0.03 | 0.03 | 0.06 | 70 |
| Class | Number | Inside | Poisson | Fraction |
|---|---|---|---|---|
| Error | [%] | |||
| Quasars | 46 | 17 | 4 | |
| BL Lacs | 16 | 5 | 2 | |
| Galaxies | 17 | 7 | 3 | |
| Unclassifieds | 9 | 2 | 1 | |
| All | 88 | 31 | 6 | |
| Radio Sample | 22 | 6 | 2 | |
| Gamma Sample | 22 | 6 | 2 |