Quartz-based flat-crystal resonant inelastic x-ray scattering spectrometer with sub-10 meV energy resolution
Abstract
Continued improvement of the energy resolution of resonant inelastic x-ray scattering (RIXS) spectrometers is crucial for fulfilling the potential of this technique in the study of electron dynamics in materials of fundamental and technological importance. In particular, RIXS is the only alternative tool to inelastic neutron scattering capable of providing fully momentum resolved information on dynamic spin structures of magnetic materials, but is limited to systems whose magnetic excitation energy scales are comparable to the energy resolution. The state-of-the-art spherical diced crystal analyzer optics provides energy resolution as good as 25 meV but has already reached its theoretical limit. Here, we demonstrate a novel sub-10 meV RIXS spectrometer based on flat-crystal optics at the Ir-L3 absorption edge (11.215 keV) that achieves an analyzer energy resolution of 3.9 meV, very close to the theoretical value of 3.7 meV. In addition, the new spectrometer allows efficient polarization analysis without loss of energy resolution. The performance of the instrument is demonstrated using longitudinal acoustical and optical phonons in diamond, and magnon in Sr3Ir2O7. The novel sub-10 meV RIXS spectrometer thus provides a window into magnetic materials with small energy scales.
Introduction
The description of strongly correlated electron systems by means of elementary excitations has been a useful concept in modern condensed-matter physics Pines (1999). Magnetic excitations or magnons and their associated quasi-particles are traditionally studied with inelastic neutron scattering. It is a recent finding that resonant inelastic x-ray scattering (RIXS) can actually probe magnon as a result of the core-hole spin-orbit coupling of transition metal L edges Ament et al. (2011a). Nowadays, RIXS is routinely used to measure magnetic excitations in various different types of materials including cuprates Ament et al. (2011b), iridates Kim et al. (2012a, b, 2014) and osmates Calder et al. (2016), with the highest energy resolution being 25 meV at the Ir L3 absorption edge Kim et al. (2014); Sala et al. (2013).
There are great interests in improving the energy resolution of the RIXS spectrometer to sub-10 meV level to fully extract information necessary to understand the low-lying magnetic dynamics of iridates which have been irresolvable within the current best energy resolution. Of particular recent interests are such elusive systems as quantum spin liquids, topological insulator, Axion insulator and Weyl semimetal, which are emergent quantum phases in correlated spin-orbit coupled materials Witczak-Krempa et al. (2014); Pesin and Balents (2010); Chaloupka et al. (2010).
The x-ray optics of state-of-the-art, high-resolution RIXS spectrometers are based on diced, spherical crystal analyzers in a near back-scattering geometry Gog et al. (2013); Shvyd’ko et al. (2013). Due to the resonant character of the technique, the incident energy is predetermined by the absorption edge of a given magnetic ion. However, the highly symmetric crystal structure of Si provides very few choices for near-backscattering reflections, thereby limiting the highest resolution achievable. Other crystals of lower symmetry such as quartz and sapphire in principle offer many more reflection choices, some of which have much smaller intrinsic energy width than Si with very good throughput Sutter et al. (2005). However, the technology to process these materials is still in its infancy Yavas et al. (2017).
In this article, a novel RIXS spectrometer with sub-10 meV energy resolution at the Ir L3 edge is introduced, based on flat-quartz crystal optics. The unique advantage of the flat-crystal analyzer is that its resolution no longer depends on any geometrical factors, such as the focusing of the mirrors, the divergences of the X-ray beams, or the exact shape of the spherical analyzer. As a new important feature, efficient polarization analysis without loss of energy resolution is also demonstrated. The principle of the instrument design is described, the performance of its implementation is characterized and representative measurements of phonon dispersion in diamond and magnetic excitations in Sr3Ir2O7 are provided.
Experiment and Simulations
The diamond(111) high-heat-load monochromator reflects x-rays from two in-line undulators into a four-bounce high-resolution monochromator, which consists of two monolithic Si(844) channel-cut crystals, resulting in an energy bandpass of 8.9 meV. The beam is then focused by a set of Kirkpatrick-Baez mirrors, yielding a typical spot size of 1040 m2 FWHM (vh) at the sample. The sample scattering plane is horizontal, while the scattering plane of the CA crystals is vertical.
A laterally-graded parabolic collimating nested (Montel) mirror, where two one-dimensionally figured multilayer mirrors are attached orthogonally, was chosen for its superior surface figuring, compact design, and easy instrumentation and stability control, compared with traditional designs such as a Kirkpatrick-Baez (KB) system. It is designed to collimate scattered x-ray beams around the Ir-L3 absorption photon energy (11.215 keV) in both vertical and horizontal directions. Mirror parameters (parabolic shape, overall dimensions, choices of multilayer reflector and spacer elements) were determined by the input requirements of the CA RIXS spectrometer. The distance between the scattering source and the mirror center is 200 mm and the mirror length is 150 mm. The Bragg angle is 1.02∘ and the angular acceptance is as large as 14.5 mrad. The multilayer reflector and spacer are Ru and C, respectively. Detailed design parameters and its performance can be found in Ref. 25. A small vertical spot size is important to obtain the required x-ray collimation (100 rad) after the Montel mirror. Previous study showed that the x-ray collimation in the horizontal direction is rather poor (200 rad) due to the large horizontal spot size Kim et al. (2016). However, this does not significantly affect the efficiency or energy resolution of the CA analyzer because the horizontal angular acceptances of both C and A crystals are larger than 200 rad.
In designing the CA-RIXS spectrometer, care was taken to maximize the incident solid-angle acceptance, optimize the throughput, maintain the best energy resolution and provide efficient polarization analysis without sacrificing resolution. This was accomplished by carefully selecting suitable crystal reflection and asymmetry angles. For guidance in this selection process, diffraction conditions and crystal scans were simulated in extended 3dimensional DuMond diagrams, DuMond (1937) based on two-beam dynamical diffraction theory Authier (2001) and representing intensities after successive reflections and asymmetry transformation as a function of angle and energy.
Principle of the flat crystal RIXS analyzer
Flat-crystal x-ray optics are superior in performance to curved crystal systems, because they are free from figure errors and strains that degrade the performance Dickinson et al. (2008); Bortel et al. (2000); Shvyd’ko et al. (2014); Huang (2011). However, the angular acceptance of flat crystal systems is so small that they are not practical in situations where weak, radially scattered radiations from a sample needs to be collected, as is the case of a RIXS spectrometer. Recent advances in multilayer optics provide a way to overcome this impediment Cai et al. (2013); Honnicke et al. (2011); Mundboth et al. (2014); Suvorov et al. (2014) through the use of curved, laterally-graded mirrors, that can easily accept radiations in a large solid angle.
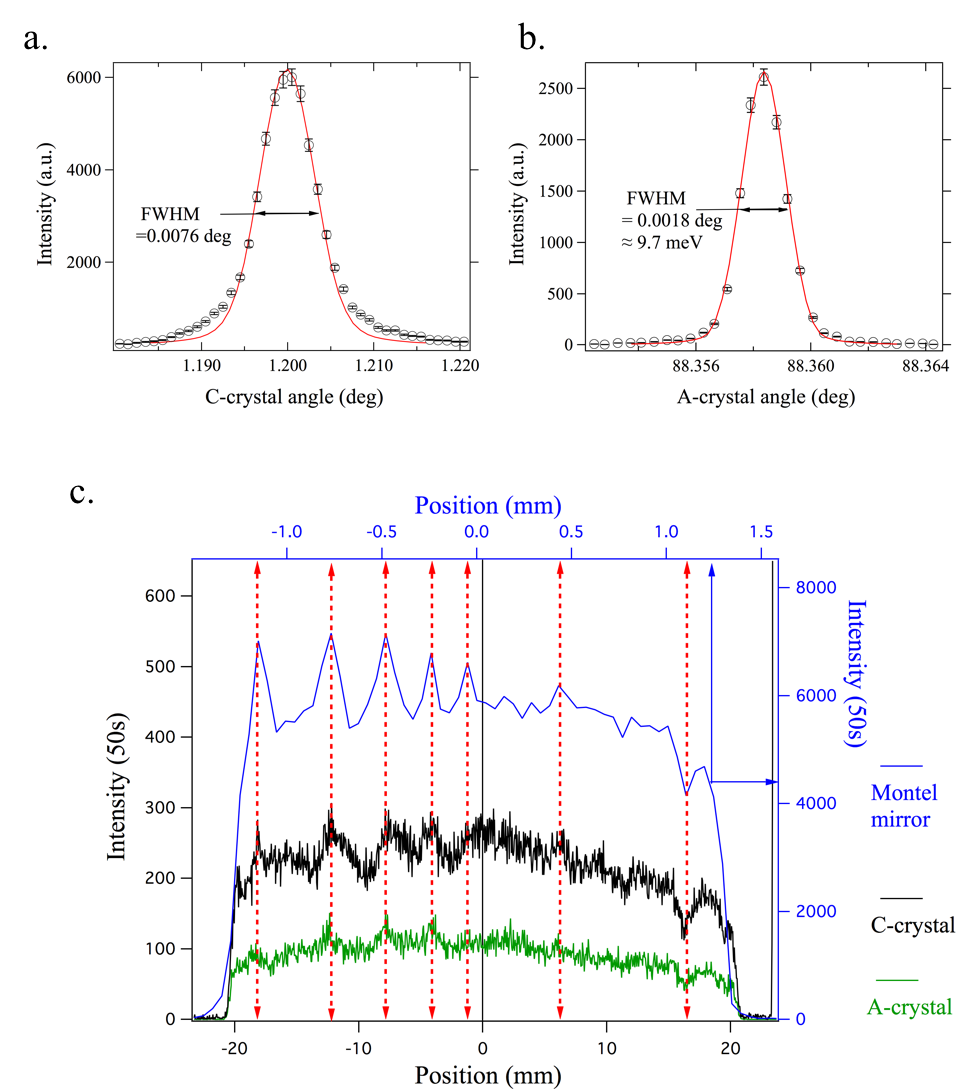
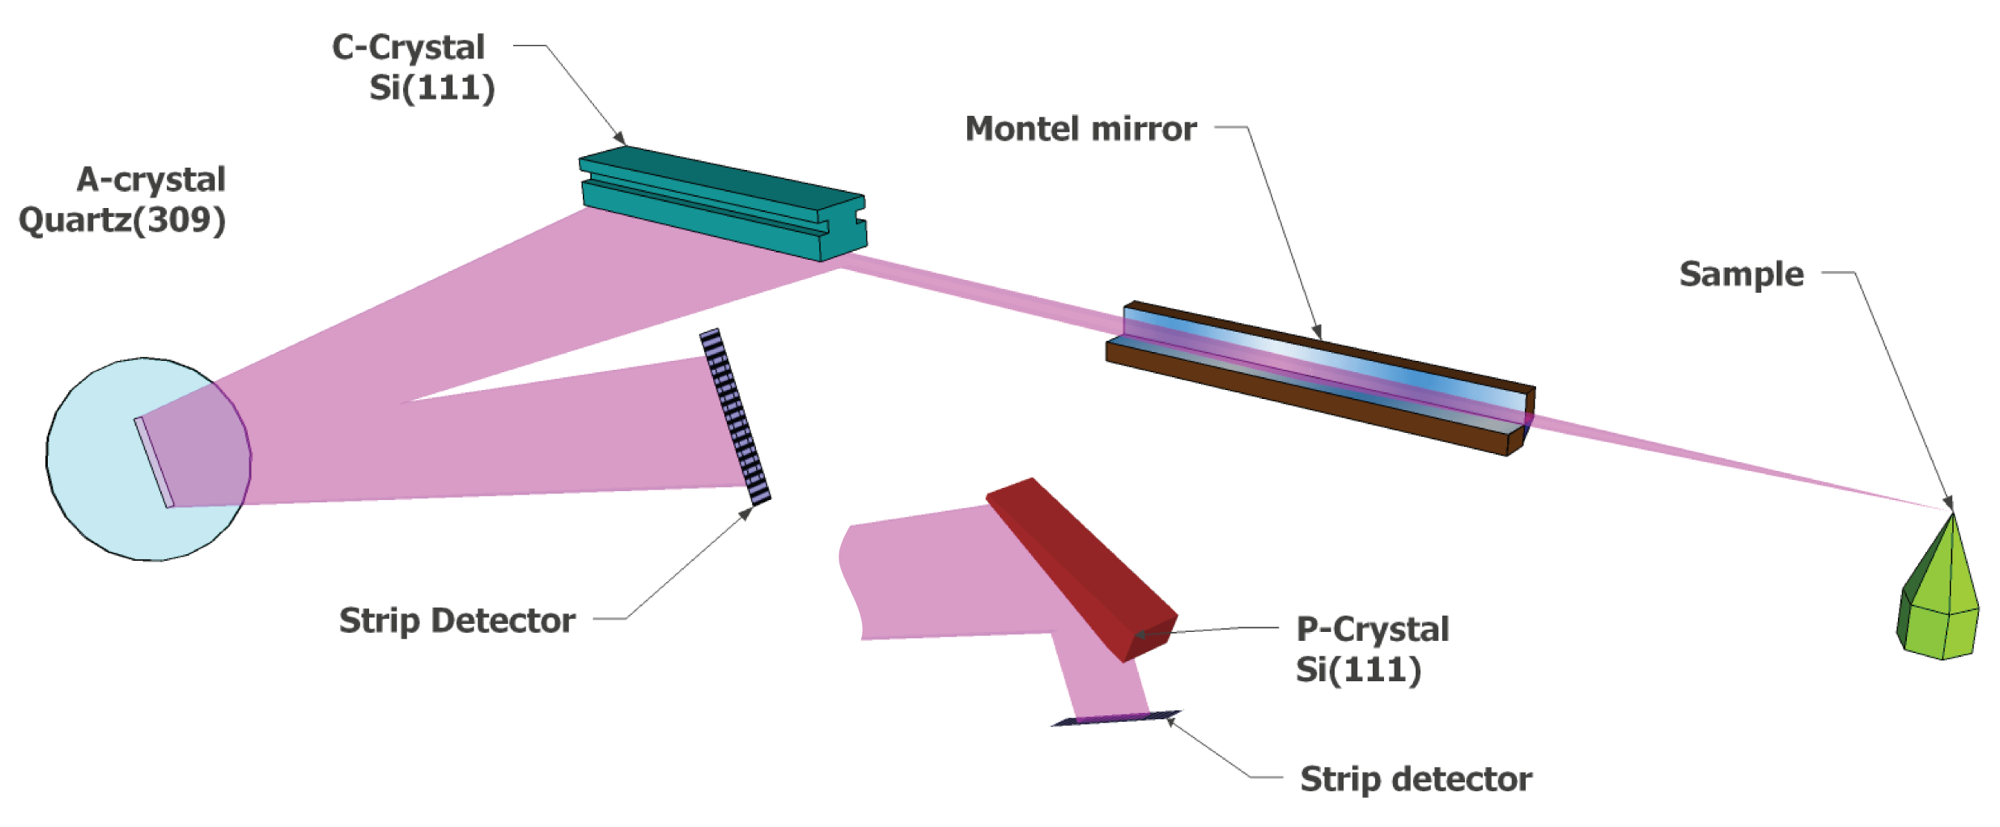
Figure 1 shows a prototype of the flat crystal RIXS analyzer implemented for the operation at the Ir L3 absorption edge (11.215 keV) at the RIXS beamline 27-ID of the Advanced Photon Source. A nested set of two parabolic, laterally-graded Ru/C multilayer mirrors, called the Montel mirror, is located at a distance of 200 mm from the sample to serve as initial collimator Kim et al. (2016). It accepts more than 1010 mrad2 of scattered radiation from the sample in the vertical and horizontal directions, and collimates it to less than 100100 rad2. A Si(111) asymmetrically cut C-crystal whose angular acceptance matches the emittance of the Montel mirror is positioned at 500 mm downstream, and it further reduces the beam divergence to 6 rad in the vertical direction. This is smaller than the acceptance of the A-crystal that is placed at a distance of 1000 mm from the C-crystal. For the A-crystal, the availability of nearly perfect -Quartz provides a near-backscattering reflection (309) with an intrinsic energy width of 3.7 meV, 4 times smaller than the highest resolving Si(844) reflection (14.6 meV) at this incident energy. It should be emphasized that the quality of collimation only affects the efficiency of the CA-analyzer, while its energy resolution remains solely determined by the intrinsic width of the A-crystal. The X-ray beam from the A-crystal is collected by a position-sensitive detector (Mythen by Dectris), with an effective length of 64 mm, divided into 1280 pixels of 50 m width each. In the following, this RIXS analyzer system will be referred to as a CA-analyzer.
In an ideal RIXS measurement, the energy, momentum and polarization of scattered radiation are measured. To date, polarization measurements using curved crystal optics have been inefficient and tend to compromise the energy resolution Ishii et al. (2011); Gao et al. (2016). A remarkable, additional advantage of the CA analyzer is to analyze polarization with high efficiency and without loss of energy resolution. For this purpose, the beam from the A crystal is further diffracted by a Si(444) polarizer P-crystal at a Bragg angle near 45∘, with the detector relocated to receive the beam from the P-crystal.

Results
Performance of the flat-crystal RIXS spectrometer
For alignment and characterization, elastically scattered radiation from a tape sample (3M Scotch Magic tape) is used. The incident beam is monochromatized to a band pass of 8.9 meV. The CA analyzer is positioned at a scattering angle 2 = 15∘. In order to assess the performance of the CA-analyzer, static diffraction characteristics as well as dynamic rocking curves and energy scans were extensively simulated. Extended DuMond diagrams DuMond (1937) based on two-beam dynamical diffraction theory Authier (2001) were used to compute 3-dimensional reflectivity profiles as function of both the angle and the energy at various points along the chain of the crystals. In order to calculate the energy- or angle-scan profiles, the corresponding profiles are convoluted along the angle- or energy-axis.
Figure 2a shows the measured rocking curve of the asymmetric Si (111) C-crystal. The measured full-width-half-maximum (FWHM) value is 0.0076∘, consistent with the simulated results (solid curve) that are based on a model with an incidence divergence of 92 rad from the mirror and an incident energy bandwidth of 8.9 meV. Figure 2b shows the rocking curve for the symmetric quartz (309) A-crystal. The FWHM is about 0.0018∘, again consistent with the simulations. These results indicate the near-ideal quality of the C- and A-crystals, as well as their strain-free mountings and an effective degree of collimation of the Montel mirror.
Regarding the measured efficiency, the C-crystal reflects 70 of x-rays coming from the Montel mirror, while the A-crystal passes 30 of x-rays from the C-crystal to the detector, amounting to an overall efficiency of about 21 . This is in very good agreement with the simulations that give an overall efficiency of 22 , which indicates that the successive collimation by the Montel mirror and the C-crystal works exactly as designed. This is also borne out by more detailed observations of the vertical beam profiles measured at various points along the beam path using the position-sensitive detector. Figure 2c shows the profiles downstream of the Montel mirror, the C-crystal and the A-crystal. Firstly, the full size of the beam emerging from the Montel mirror was measured to be about 2.6 mm as shown in the blue line (top and right axes). The angular acceptance corresponding to this measured size is about 14.5 mrad. The intensity modulations are attributed to the figure errors of the Montel mirror. The black trace in Fig. 2c shows the beam profile downstream of the C-crystal. The measured beam size is now 40.8 mm, consistent with the designed asymmetry factor of b = 15.6, indicating that the full beam from the Montel mirror is accepted and passed along. The incident intensity fluctuations are preserved. Finally, the green trace shows the beam profile downstream of the symmetric A-crystal. Again, the intensity fluctuations are preserved, and the reduction in intensity is consistent with a reduced reflectivity for quartz and its narrow energy acceptance.
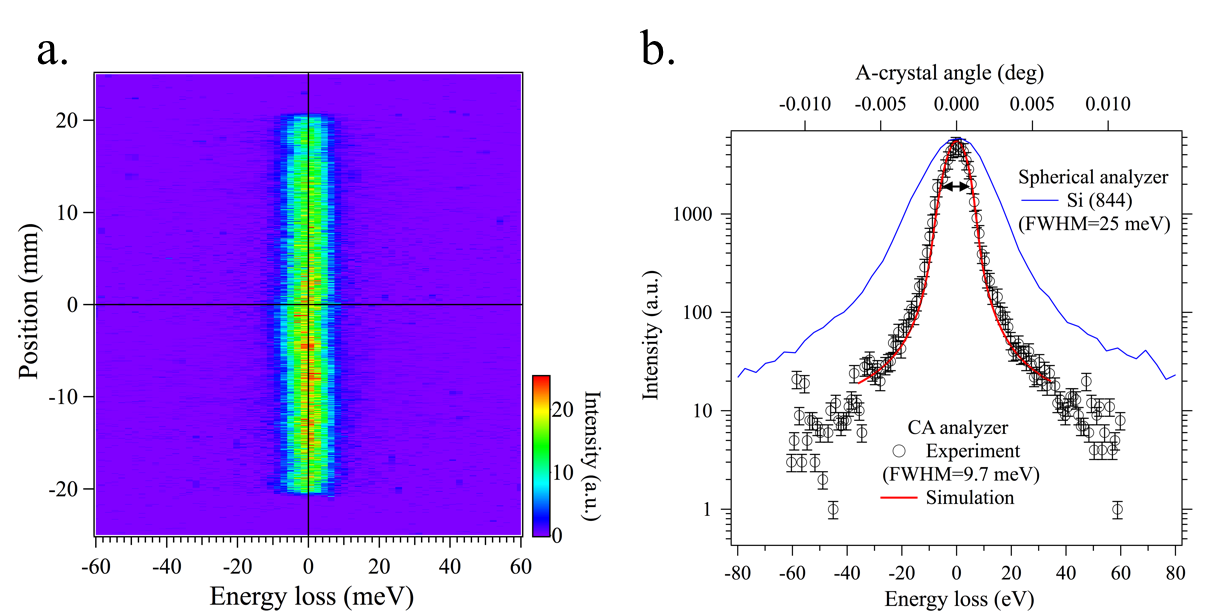
The spectral resolution function of the CA-analyzer can be obtained in two ways: by scanning the analyzer itself or by scanning the incident energy. For the first scan mode, a single angle scan of the A-crystal is sufficient, because the energy bandpass of the C crystal is very large ( 6.3 eV) compared to that of the A-crystal. Thus, the A-crystal rocking curve shown in Fig. 2b, when the angle is converted to the energy, gives the spectral resolution function with a width of just under 10 meV. For the second mode, the spectral resolution function is obtained by scanning the high-resolution monochromator. Figure 3a shows an image plot of such an incident energy scan. The x-axis represents the energy loss, defined as the difference between the incident and scattered energy. The y-axis is the position on the position-sensitive detector. It can be seen that all elastic intensities are well aligned along the zero-energy loss. The spectral resolution function is obtained by integrating spectral intensities at all the positions as a function of energy loss. Figure 3b shows the spectral resolution function obtained in this way. It has a FWHM of 9.7 meV, consistent with the corresponding simulation (red solid curve) and the result from Fig. 2b. Considering the energy bandpass of the incident beam of 8.9 meV, the intrinsic energy resolution of the CA-analyzer can be approximated by = 3.9 meV, very close to the theoretical value of 3.7 meV. For comparison, the spectral resolution function of a spherical diced Si(844) analyzer is also plotted.
Longitudinal acoustic and optical phonons in Diamond crystal
For the purpose of characterizing the performance of the flat-crystal RIXS spectrometer and calibrating its energy scale, we have reproduced the well-known phonon spectra from diamond, which were investigated previously by various high resolution spectroscopies such as inelastic neutron scattering (INS), Raman scattering, and inelastic x-ray scattering (IXS) Verbeni et al. (2008). Diamond phonons are well suited for the purpose because their energies span a sufficiently large energy window, and the specific balance factor precisely defines the intensity ratio between Stokes and anti-Stokes scattering, allowing judgment of the uniform response of the instrument.
For these measurements, a flat Diamond(111) crystal was used with the azimuthal angle chosen such that the scattering (1 0 -1) direction was contained in the scattering plane. Longitudinal acoustic (LA) and optical (LO) phonons were measured along =(H H H), with 1 H1.5. The momentum resolution corresponding to the angular acceptance of the mirror of 14.5 mrad is about 0.022 rlu, or 0.39 nm-1.
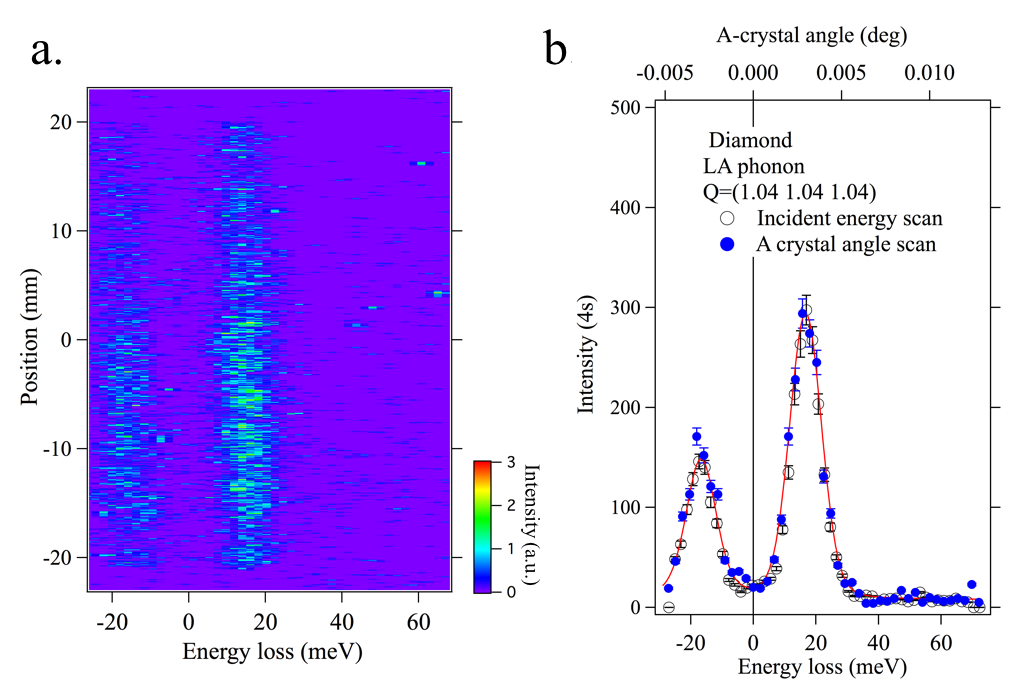
The image plot on the left of Fig. 4a shows the LA phonon spectrum at H=1.02 recorded by the CA-analyzer. The strong intensity near zero energy loss is from the (1 1 1) Bragg peak. The two intensity streaks at positive and negative energy loss correspond to Stokes and anti-Stokes scattering, respectively. The image plot in the center shows the LA phonon spectrum at H=1.04. Here, elastic scatterings are suppressed and the separation between the Stokes and anti-Stokes scattering becomes larger. For H=1.08, as shown in the image plot on the right, anti-Stokes scattering is out of the measured range and the Stokes scattering appears at a higher energy loss. The phonon spectra in Fig. 4b and 4c were obtained by integrating the intensities as a function of the energy loss. Taking advantage of the position-sensitive detector, a smaller momentum resolution (0.011 rlu) was selected by restricting the integration position range to half the length of the detector (20 mm). This is indicated by the yellow dashed lines in Fig. 4a. For the case of H=1.01, 1.02, and 1.03, the areas with strong elastic intensity around the 2 mm position are excluded. This is one of the powerful features of the flat-crystal RIXS spectrometer in combination with a position-sensitive detector; the integration ranges can be chosen a posteriori to set the momentum resolution or mask off unwanted areas.
Figure 4b shows the LA phonon spectra. The measured spectra are fitted using the Voigt functions that satisfy the detailed balance factor. Figure 4c shows the spectra for H=1.05, 1.2, 1.3, and 1.4 over a wider energy range. The LO phonon is seen at around 160 meV, along with the highly dispersing LA phonon. Fig. 4d shows the resulting dispersion of the two longitudinal phonon modes. The results from the CA-analyzer agree very well with the IXS results, indicating that the high-resolution monochromator is properly calibrated. Alternatively, the same spectra can be obtained by scanning the angle of the A-crystal. Figure 5a shows an image plot for H=1.04 taken by such an angle scan, which is directly comparable to the center plot in Fig. 4a. The phonon spectra obtained in both scan modes shown in Fig. 5b agree well with each other.
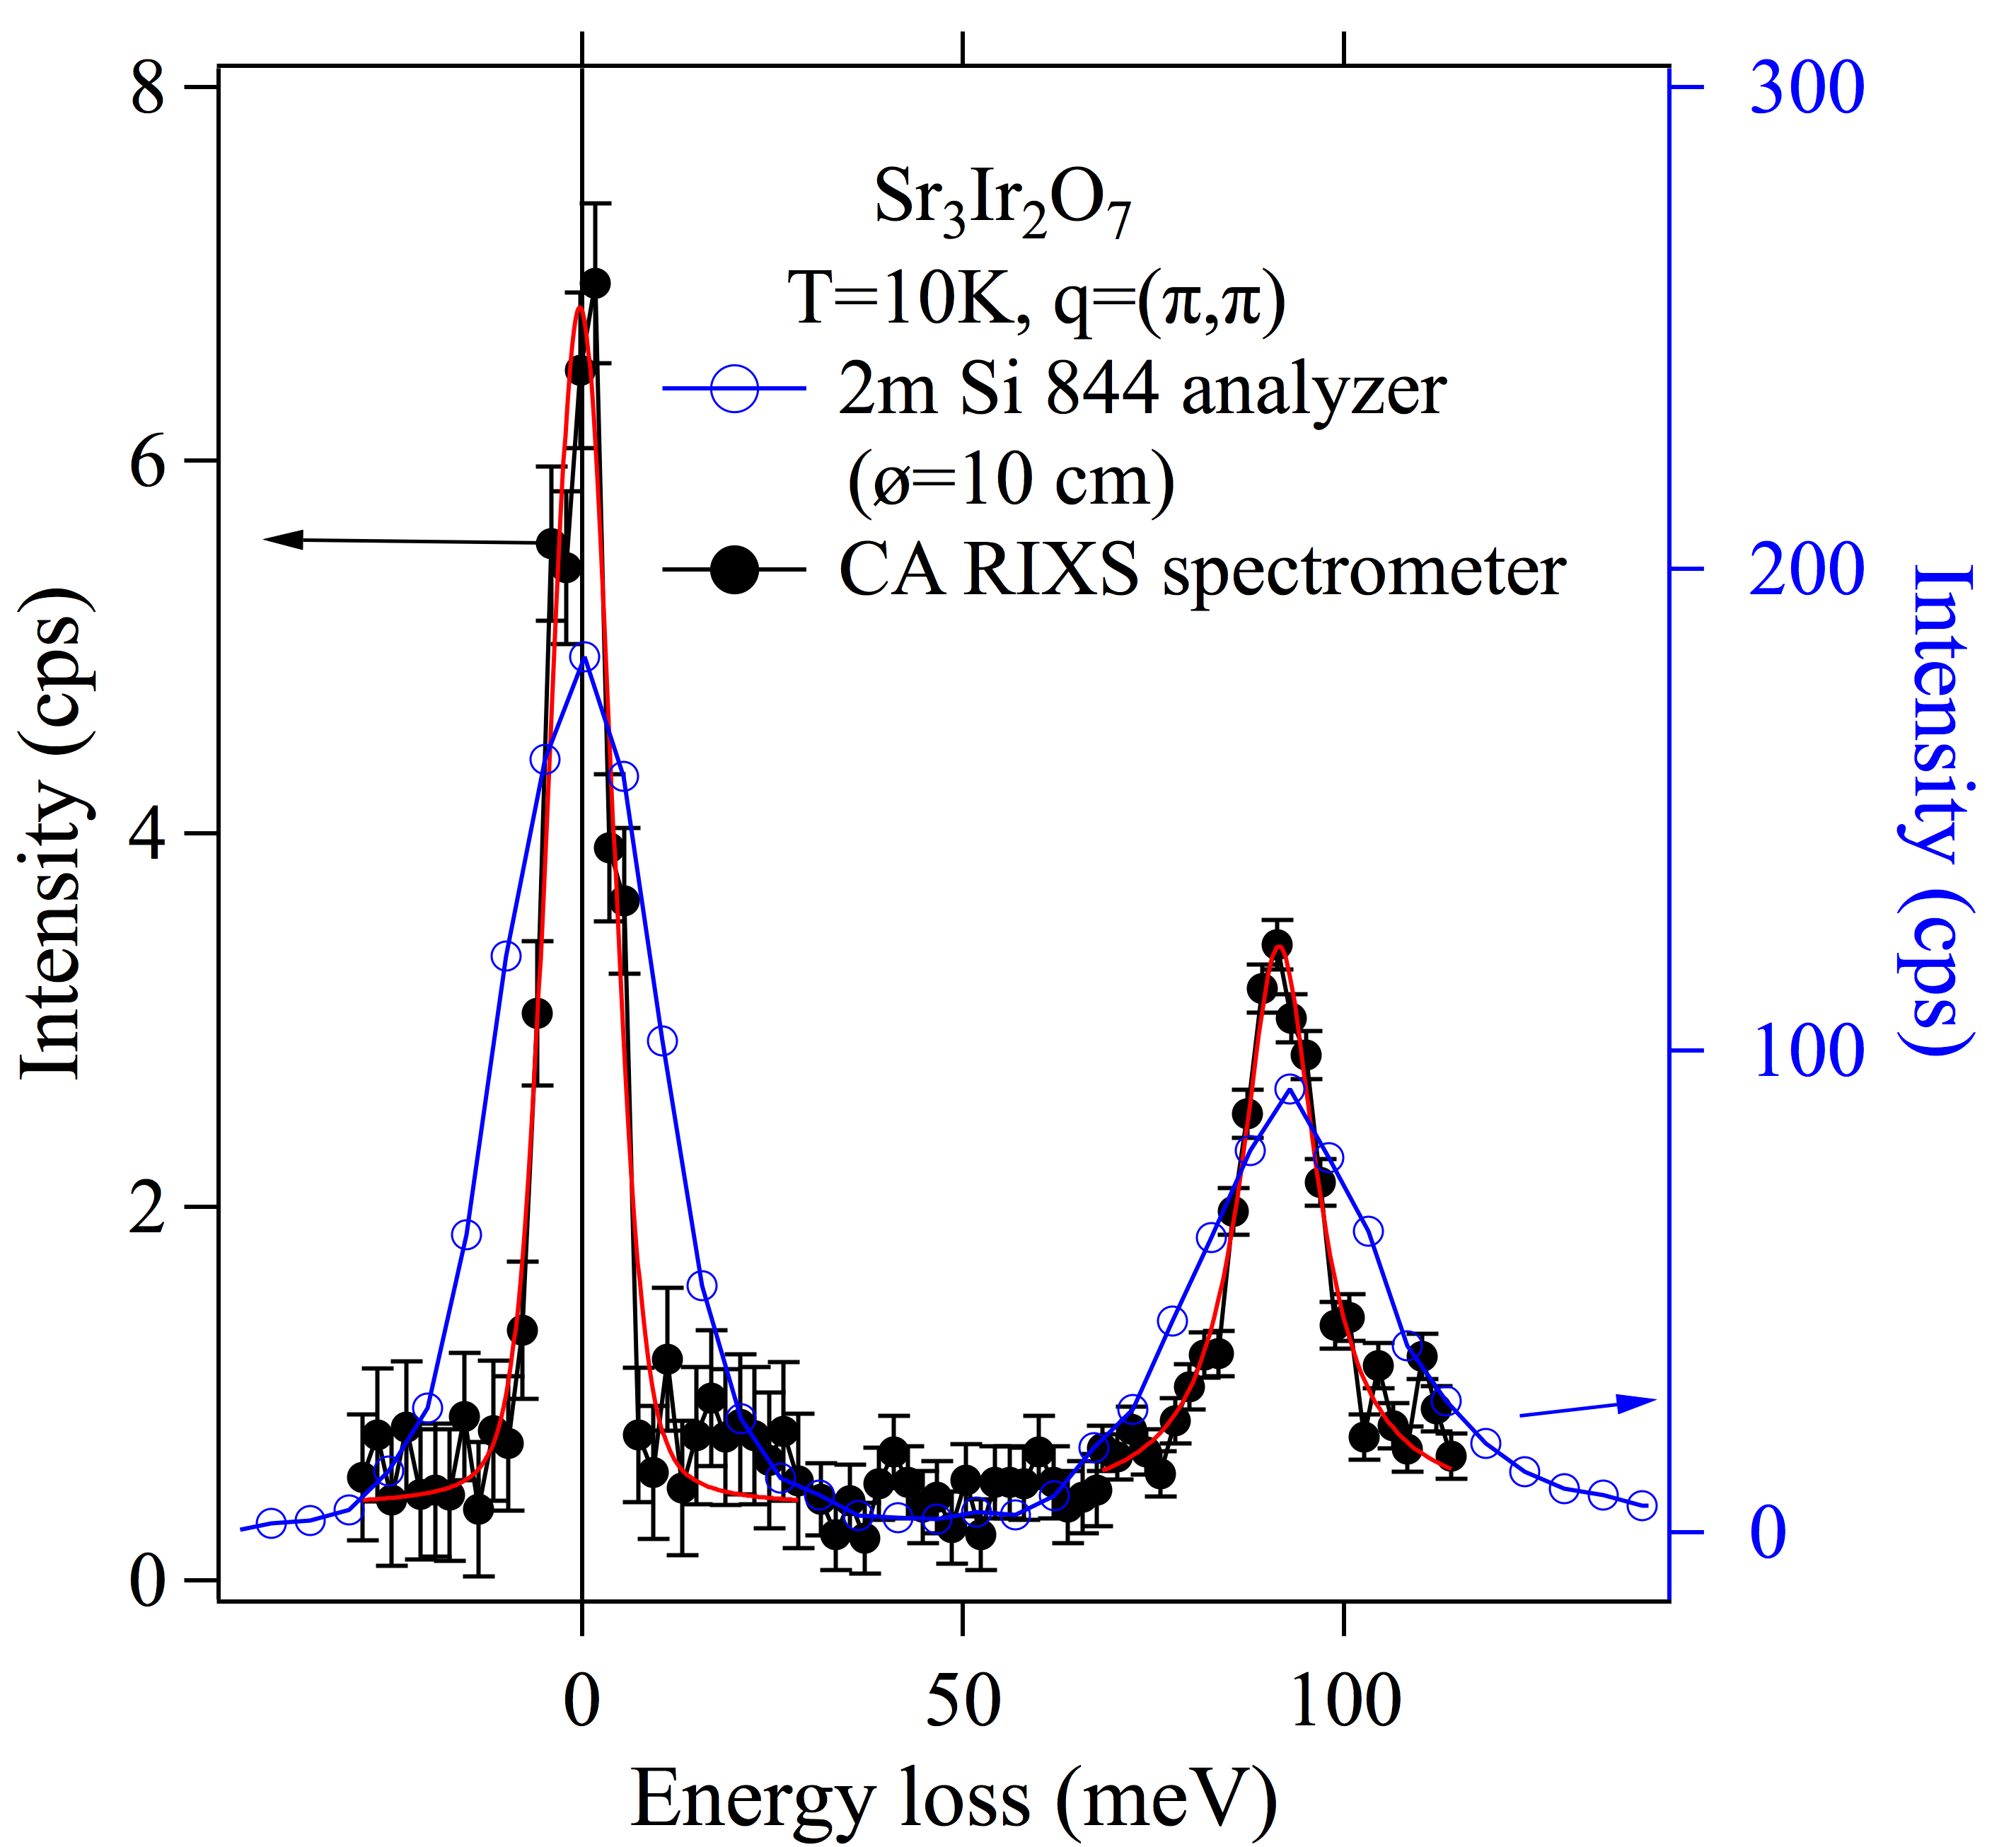
Magnon spectrum in Sr3Ir2O7 at the magnetic zone center
The bilayer iridate Sr3Ir2O7 is a magnetic insulator driven by spin-orbit coupling with a small charge gap Moon et al. (2008). Previous RIXS studies have revealed an exceptionally large magnon gap of 90 meV resulting from bond-directional, pseudodipolar interactions that are strongly enhanced near the metal-insulator transition boundary Kim et al. (2012b). Figure 6 shows the magnon spectrum in Sr3Ir2O7 at the magnetic zone center as measured by the CA-RIXS spectrometer. The elastic scattering at zero energy loss has a FWHM of 9.7 meV, confirming the overall energy resolution determined earlier. A sharp magnon feature is seen at 90 meV, with a FWHM of 12 meV as determined from a Voigt profile fit. Magnon peak measured by a standard RIXS spectrometer with an overall energy resolution of 25 meV Kim et al. (2012b) is also plotted in Fig. 6 for comparison.
Polarization analysis with high efficiency and high energy resolution
Scattered radiation typically contains both and polarizations Ament et al. (2011b). Equally efficient detection of both polarizations is essential. The CA-analyzer presented in this work has a calculated detection ratio of 0.88, suitable for a practical instrument.
Polarization analysis can then be accomplished by including a polarizer between the A-crystal and the detector. A polarizer (P) crystal should have a scattering angle close to 90∘. Si(444) provides 89.68∘ at 11.215keV, and is therefore suitable. A symmetric Si(844) crystal was used for this proof-of principle study. As shown in Fig. 1, the P-crystal is placed in the beam emerging from the A-crystal and the detector is relocated to intercept the diffracted beam from the P-crystal.
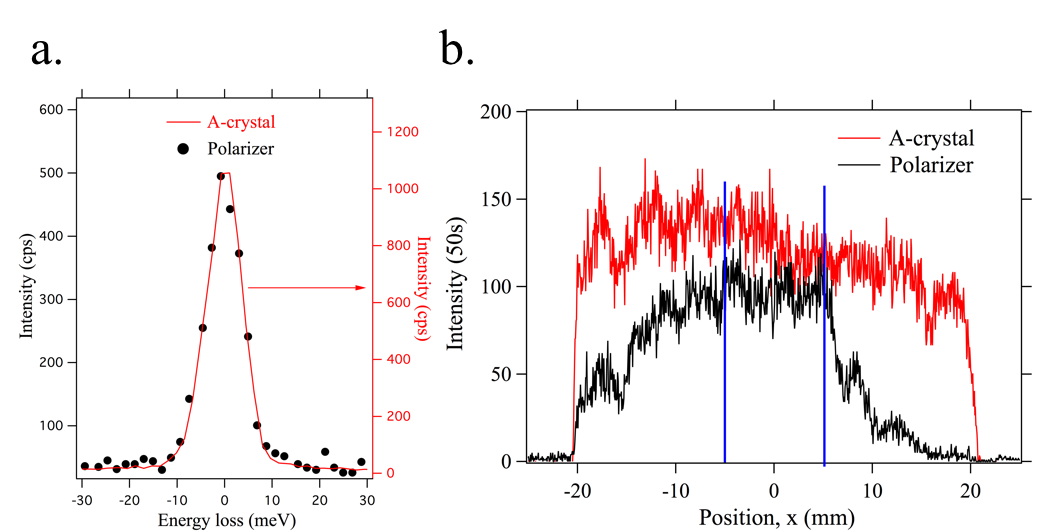
In order to determine the energy resolution in the polarization analyzing mode, elastic scatterings from a tape sample were collected at scattering angles of 2=0∘ and 13∘. Figure 7a shows the spectra for both scattering angles, obtained by scanning the incident energy. Two spectra are virtually indistinguishable from each other, with a FWHM of 9.7 meV. These measurements clearly show that the overall energy resolution is unaffected by adding a polarization analyzer.
Regarding the efficiency, however, the P-crystal used for this demonstration was found to be somewhat strained, not diffracting uniformly over its length and rendering the measured overall efficiency (35) lower than expected. Figure 7b shows the intensity profiles of the A- and P-crystal as a function of position along the detector, recorded at peak intensity. It can be seen that the low overall efficiency is due to poor reflectivity of the P-crystal along its length, except for a small region around the center (5 mmx5 mm). Considering only this region, the reflection efficiency is as good as 76 , comparable to what was expected from simulations.
Discussion and Outlook
In this work, a novel, flat-crystal RIXS spectrometer has been designed and implemented, achieving an unprecedented energy resolution better than 10 meV at the Ir-L3 edge (with the resolution of the CA-analyzer being only 3.9 meV), unprecedented for any RIXS measurement. Besides its superior energy resolution, the flat-crystal system has two additional advantages: the capability to analyze polarization with no loss of resolution and good efficiency, and convenient selection of the momentum resolution.
Improvements in performance and extensions to other absorption edge energies can be realized in future implementation of the instrument. The best energy resolution at optimal throughput is achieved when the incident band pass is matched to the intrinsic energy width of the A-crystal. For the present prototype, according to simulations, reducing the incident energy bandpass from the current 8.9 meV to 3.7 meV would improve the overall energy resolution from 9.7 to 5.2 meV (with the same throughput) and raise the spectral efficiency from 21 to 49.
In order to extend the concept of the flat-crystal spectrometer to other incident energies, its components should be selected following these guidelines: (1) The choice of A-crystal determines the ultimate energy resolution and therefore a reflection with an appropriately small intrinsic width and high reflectivity should be selected. Compared with silicon that has only a few tens of Bragg reflections in the medium energy range (16 keV), quartz has hundreds to thousands of reflections. This enables us to implement flat-quartz analyzers at virtually any photon energies with resolution up to 1 meV. (2) The C-crystal should be of low reflection order, to attain a large angular acceptance at moderate asymmetry. Si(111) is a good choice for most situations. The Montel mirror needs to be designed to achieve appropriate collection, collimation and throughput at a chosen working distance. (3) Finally, the P-crystal needs to provide a near 90∘ scattering angle at the desired energy, have good reflectivity, an asymmetry chosen so that the full beam from the A-crystal is accepted, and the diffracted beam remains wholly within the detector length.
Acknowledgements.
The use of the Advanced Photon Source at the Argonne National Laboratory was supported by the U.S. DOE under Contract No. DE-AC02-06CH11357.References
- Pines (1999) D. Pines, Elementary Excitations in Solids: Lectures on Phonons, Electrons, and Plasmons, Vol. 5 (Westview Press: Boulder, CO, 1999).
- Ament et al. (2011a) L. J. P. Ament, K. G., and J. van den Brink, Phys. Rev. B 84, 020403(R) (2011a).
- Ament et al. (2011b) L. J. P. Ament, van Veenendaal M., D. T. P., J. P. Hill, and J. van den Brink, Rev. Mod. Phys. 83, 705 (2011b).
- Kim et al. (2012a) J. Kim, D. Casa, M. H. Upton, T. Gog, Y.-J. Kim, J. F. Mitchell, M. van Veenendaal, M. Daghofer, J. van den Brink, G. Khaliullin, and B. J. Kim, Phys. Rev. Lett. 108, 177003 (2012a).
- Kim et al. (2012b) J. Kim, A. H. Said, D. Casa, M. H. Upton, T. Gog, M. Daghofer, G. Jackeli, J. van den Brink, G. Khaliullin, and B. J. Kim, Phys. Rev. Lett. 109, 157402 (2012b).
- Kim et al. (2014) J. Kim, D. M., Said, A. H., T. Gog, J. van den Brink, G. Khaliullin, and B. J. Kim, Nat. Commun. 5, 4453 (2014).
- Calder et al. (2016) S. Calder, J. G. Vale, N. A. Bogdanov, X. Liu, C. Donnerer, M. H. Upton, D. Casa, A. H. Said, M. D. Lumsden, Z. Zhao, J. Q. Yan, D. Mandrus, S. Nishimoto, J. van den Brink, J. P. Hill, D. F. McMorrow, and A. D. Christianson, Nat. Commun. 7, 11651 (2016).
- Sala et al. (2013) M. M. Sala, C. Henriquet, L. Simonelli, R. Verbeni, and G. Monaco, J. Electron. Spectrosc. 188, 150 (2013).
- Witczak-Krempa et al. (2014) W. Witczak-Krempa, G. Chen, Y. B. Kim, and L. Balents, Annu. Rev. Condens. Matter Phys. 5, 57 (2014).
- Pesin and Balents (2010) D. Pesin and L. Balents, Nat. Phys. 6, 376 (2010).
- Chaloupka et al. (2010) J. Chaloupka, G. Jakeli, and G. Khaliullin, Phys. Rev. Lett. 105, 027204 (2010).
- Gog et al. (2013) T. Gog, D. Casa, A. H. Said, M. H. Upton, J. Kim, I. Kuzmenko, X. Huang, and R. Khachatryan, J. Synchrotron Rad. 20, 74 (2013).
- Shvyd’ko et al. (2013) Y. Shvyd’ko, J. Hill, C. Burns, D. Coburn, B. Brajuskovic, D. Casa, K. Goetze, T. Gog, R. Khachatryan, J.-H. Kim, C. Kodituwakku, M. Ramanathan, T. Roberts, A. Said, H. Sinn, D. Shu, S. Stoupin, M. Upton, M. Wieczorek, and H. Yavas, J. Electron. Spectrosc. 188, 140 (2013).
- Sutter et al. (2005) J. P. Sutter, A. Q. Baron, T. Ishikawa, and H. Yamazaki, J. Phys. Chem. Solids 66, 2306 (2005).
- Yavas et al. (2017) H. Yavas, J. P. Sutter, T. Gog, H.-C. Wille, and A. Q. Baron, MRS Bulletin 42, 424 (2017).
- DuMond (1937) J. W. DuMond, Phys. Rev. 52, 872 (1937).
- Authier (2001) A. Authier, Dynamical Theory of X-Ray Diffraction (International Union of Crystallography Monographs on Crystallography, 11) (Oxford University Press, 2001).
- Dickinson et al. (2008) B. Dickinson, G. T. Seidler, Z. W. Webb, J. A. Bradley, K. P. Nagle, S. M. Heald, R. A. Gordon, and I. M. Chou, Rev. Sci. Instrum 79, 123112 (2008).
- Bortel et al. (2000) G. Bortel, E. E. Alp, W. Sturhahn, and T. S. Toellner, J. Synchrotron Rad. (2000).
- Shvyd’ko et al. (2014) Y. Shvyd’ko, S. Stoupin, D. Shu, S. P. Collins, K. Mundboth, J. Sutter, and M. Tolkiehn, Nat. Commun. 5, 4219 (2014).
- Huang (2011) X. R. Huang, J. Synchrotron Rad. 18, 899 (2011).
- Cai et al. (2013) Y. Cai, D. Coburn, A. Cunsolo, J. Keister, M. Honnicke, X. Huang, C. Kodituwakku, Y. Stetsko, A. Suvorov, H. Hiraoka, K. D. Tsuei, and H. C. Wille, J Phys.: Conf. Ser. 425, 202001 (2013).
- Honnicke et al. (2011) M. G. Honnicke, J. W. Keister, R. Conley, K. Kaznatcheev, P. Z. Takacs, D. S. Coburn, L. Reffi, and Y. Q. Cai, J. Synchrotron Rad. 18, 862 (2011).
- Mundboth et al. (2014) K. Mundboth, J. Sutter, D. Laundy, S. Collins, S. S., and Y. Shvyd’ko, J. Synchrotron Rad. 21, 16 (2014).
- Suvorov et al. (2014) A. Suvorov, D. S. Coburn, A. Cunsolo, J. W. Keister, M. H. Upton, and Y. Q. Cai, J. Synchrotron Rad. 21, 473 (2014).
- Kim et al. (2016) J. Kim, X. Shi, D. Casa, J. Qian, X. Huang, and T. Gog, J. Synchrotron Rad. 23, 880 (2016).
- Ishii et al. (2011) K. Ishii, S. Ishihara, Y. Murakami, K. Ikeuchi, K. Kuzushita, T. Inami, K. Ohwada, M. Yoshida, I. Jarrige, N. Tatami, S. Niioka, D. Bizen, Y. Ando, J. Mizuki, S. Maekawa, and Y. Endoh, Phys. Rev. B 83, 241101(R) (2011).
- Gao et al. (2016) X. Gao, D. Casa, J. Kim, T. Gog, C. Li, and C. Burns, Rev. Sci. Instrum 87, 083107 (2016).
- Verbeni et al. (2008) R. Verbeni, M. D′Astuto, M. Krisch, M. Lorenzen, A. Mermet, G. Monaco, H. Requardt, and F. Sette, Rev. Sci. Instrum 79, 083902 (2008).
- Moon et al. (2008) S. J. Moon, H. Jin, K. W. Kim, W. S. Choi, Y. S. Lee, J. Yu, G. Cao, A. Sumi, H. Funakubo, C. Bernhard, and T. W. Noh, Phys. Rev. Lett. 101, 226402 (2008).